1. Introduction
Asian type 2 diabetes patients are reportedly character-
ized by lower body mass index (BMI) and lower serum in- sulin levels than Mexican-American or African-American type 2 diabetes patients.
1-3In addition, the association be- tween BMI and impaired glucose tolerance is well docu- mented in cases of overweight and obesity.
4It has been well established that the primary defect in lean subjects with dia-
betes is
β-cell dysfunction while that in their obese counter- parts is
β-cell dysfunction as well as high insulin resistance.
5Asians are considered to have less compensatory β -cell function and have type2 diabetes at lower BMI than people in Western countries.
6Although not only insulin resistance with reduced compensatory
β-cell function but also abso- lute values of insulin deficiency without insulin resistance are well known as causes of diabetes, no study has reported on the association between BMI and diabetes while taking
MS#AMN 07138
Body mass index and triglyceride-to-HDL-cholesterol ratio in relation to risk of diabetes: The Nagasaki Islands study
Yuji S
himizu,
1, 2Mio N
akazato,
2Takaharu S
ekita,
2Koichiro K
adota,
1Shimpei S
ato,
1Jun K
oyamatsu,
2Kazuhiko A
rima,
3Noboru T
akamura,
4Kiyoshi A
oyagi,
3Takahiro M
aeda1, 21 Department of Community Medicine, Nagasaki University Graduate School of Biomedical Science, Nagasaki, Japan
2 Department of Island and Community Medicine, Nagasaki University Graduate School of Biomedical Science, Nagasaki, Japan
3 Department of Public Health, Nagasaki University Graduate School of Biomedical Sciences, Nagasaki, Japan
4 Department of Global Health, Medicine and Welfare, Nagasaki University Graduate School of Biomedical Sciences Atomic Bomb Disease Institute, Nagasaki University, Nagasaki, Japan
Body mass index (BMI) is well known as an independent risk factor for insulin resistance. In addition, lower BMI and lower insulin levels are recognized as specific characteristics of Asian diabetes patients. Since the triglyceride-to-HDL-cholesterol ratio (TG-HDL) is positively associated with insulin level, but inversely associated with insulin sensitivity, we supposed that diabetes combined with high but not with low TG-HDL might be positively associated with BMI. We therefore conducted a cross-sectional study of 2,431 Japanese subjects (905 men and 1,526 women) aged 30-79 years, who underwent a general health check, to investigate associations between BMI, diabetes and its subtypes that we defined on the basis of TG-HDL levels, which in turn were categorized according to sex-specific tertiles. Among the 172 diabetic patients identified in the study group, 45 showed low TG-HDL and 82 high TG-HDL. We found a significant inverse association between low-TG-HDL diabe- tes and BMI, and a significant positive association between high-TG-HDL diabetes and BMI. The multivariable-adjusted odds ratio and 95%CI for a 1SD increment in BMI (3.03 kg/m2 for men and 3.44 kg/m2 for women) for low-TG-HDL diabetes was 0.53 (95%CI: 0.36-0.77) and 1.57 (95%CI: 1.24-2.01) for high-TG-HDL diabetes. These findings demonstrated that for Japanese subjects associations between diabetes and BMI are strongly influenced by the TG-HDL status. Since a previous study of ours found that diabetes combined with high TG-HDL ratios constitutes a risk for atherosclerosis, these findings may serve as an effective tool for estimating risk of atherosclerosis for diabetes patients.
ACTA MEDICA NAGASAKIENSIA 58: 85−91, 2013 Key words: TG-HDL ratio, diabetes, BMI, cross-sectional study, risk.
Address correspondence: Yuji Shimizu, MD, PhD. Department of Community Medicine, Nagasaki University Graduate School of Biomedical Science, Nagasaki-shi, Sakamoto 1-12-4, Nagasaki 852-8523, Japan
Tel.: +81-95-819-7578, Fax: +81-95-819-7189, E-mail: [email protected] Received August 6, 2013; Accepted October 16, 2013
these causes of diabetes into account. Diabetes resulting from the
first cause, insulin resistance with reduced com-pensatory
β-cell dysfunction, may produce higher concen- trations of insulin level while diabetes resulting from the cause, absolute insulin deficiency, may reduce insulin con- centration levels.
On the other hand, insulin concentration was found to be
inversely associated with serum high-density-lipoprotein (HDL) cholesterol concentration
7and positively associated with serum triglyceride (TG) concentration.
8Furthermore, previous studies reported that TG-to-HDL-cholesterol ratio (TG-HDL) reflects the level of insulin resistance in a gen- eral study population,
9overweight individuals,
10,11and type2 diabetes,
12while a higher level of insulin sensitivity was found to be associated with a lower level of TG-HDL in overweight patients.
8Other studies reported that insulin sensitivity and insulin secretion were linked through a neg- ative feedback loop, whereby pancreatic
β-cells compensate for change in whole-body insulin sensitivity through a pro- portionate and reciprocal change in insulin secretion, which suggests that higher levels of insulin secretion may occur when insulin sensitivity is low than when it is high.
13,14These findings and observations suggest that diabetes of in- dividuals with high TG-HDL is mainly caused by insulin resistance with reduced compensatory
β-cell function, while that of patients with low TG-HDL is mainly caused by abso- lute
β-cell dysfunction.
Since absolute β
-cell dysfunction may cause under-nutri- tion, which results in lower BMI, and insulin resistance may be caused by over-nutrition, we hypothesize that BMI is in- versely associated with a prevalence of low-TG-HDL diabe- tes but positively associated with high-TG-HDL diabetes.
Since a previous study of ours found that diabetes combined with high TG-HDL ratios constitutes a risk for atherosclero- sis,
15the aforementioned associations may constitute an ef-
ficient tool for estimating risk of atherosclerosis for diabetespatients. To examine this hypothesis, we analyzed the data for Japanese who underwent a general medical check be- tween 2008 and 2011.
2. Material and Methods
2.1 ParticipantsThe surveyed population included 2,556 individuals aged
30 to 79 years, who were residents of the western a rural community in the Goto Islands in western Japan and par- ticipated in this study between 2008 and 2011. A total of 125 individuals with missing data were excluded. There were no
differences in diabetic risk factors such as systolic blood pressure, antihypertensive medication use, antihyperlipi- demic medication use, current drinker, and current smoker between participants with measured serum data and those without. The remaining 2,431 subjects with a mean age of 65.4 years (
±9.6 SD; range 36-79) were enrolled in thisstudy.
2.2 Data collections and laboratory measurements Body weight and height were measured with an automat-
ic body composition analyzer (BF-220; Tanita, Tokyo, Ja- pan) at the time of drawing blood.
Serum separated from fasting blood samples was centri-
fuged after blood coagulation. Serum samples were also collected in a siliconized tube. Serum TG and serum creati- nine were measured with the enzyme method, serum HDL with the direct method, HbA1c with the latex agglutination method, while serum alanine aminotransferase (ALT) and serum
γ-glutamyltransferase (
γ-GTP) were measured with the JASCC standardization method. Trained interviewers obtained information on smoking status, drinking status, medical history, as well as on use of antihypertensive agents, medication for diabetes mellitus, and medication for dyslipi- demia. GFR was estimated by using the established method but with three variations recently proposed by a working group of the Japanese Chronic Kidney Disease initiative.
16According to this adaptation, GFR (ml/min/1.73 m
2) = 194×
(serum creatinine (enzyme method))
-1.094×(age)-0.287×(0.739for women). HbA1c (NGSP: National Glycohemoglobin Standardization Program) was calculated with the follow- ing equation, which was recently proposed by a working group of the Japanese Diabetes Society (JDS): HbA1c (NGSP) = HbA1c (JDS) + 0.4%.
172.3 Diagnosis of diabetes and classification of its subtypes Diabetes was diagnosed on the basis of HbA1c (NGSP) ≥
6.5% and/or initiation of glucose-lowering medication or insulin therapy.
18We further classified subtypes of diabetes by calculating sex-specific tertiles of TG-HDL for all the participants (median tertiles of TG-HDL ratio (traditional units) were 0.91, 1.57, and 3.34 for men, and 0.80, 1.41. and 2.61 for women) as detailed in a previous study of ours (Shi- mizuʼs diabetes classification).
15The subtypes were low TG- HDL diabetes (diabetes with the lowest TG-HDL levels:
0.82 (
±0.25 SD) for men and 0.74 (±0.20 SD) for women),intermediate TG-HDL diabetes (diabetes with more than
the lowest but less than the highest levels of TG-HDL: 1.62
(
±0.31 SD) for men and 1.41 (±0.22 SD) for women), and high TG-HDL diabetes (diabetes with the highest TG-HDL levels: 4.80 (
±5.3 SD) for men and 3.91 (±2.68 SD) for women).2.4 Statistical analysis
The clinical characteristics reported here were expressed
as follows. TG-HDL categories for all the subjects were es- tablished on the basis of the of TG-HDL tertiles. Differ- ences in sex- and age-adjusted mean values of diabetic risk factors according to TG-HDL categories for diabetes pa- tients were analyzed by using covariance or general linear models. Logistic regression models were used to calculate odds ratios (OR) and 95% confidence intervals (CI) of dia- betes in association with BMI.
A sex-combined model was constructed and two differ-
ent approaches were used for making adjustments for con- founding factors. For the
first approach, we adjusted onlyfor sex and age and for the second, we included other pos- sible confounding factors, namely, smoking status (never smoker, former smoker, current smoker), alcohol consump- tion [non-drinker, and current light to moderate drinker (1-6 times/week), current heavy drinker (every day)], systolic blood pressure (mmHg), antihypertensive medication use (no, yes), antihyperlipidemic medication use (no, yes), antidiabetic medication use (no, yes), body mass index (kg/m
2), ALT (IU/L), γ -GTP (IU/L), and estimated GFR (mL/min/1.73m
2).
All statistical analyses were performed with the SAS sys-
tem for Windows (version 9.3; SAS Inc., Cary, NC). All p- values for statistical tests were two-tailed, and values of
<0.05 were regarded as statistically significant.
3. Results
Of the 2,431 participants, 172 were diagnosed with diabe-
tes, and 45 of whom showed low TG-HDL levels, 45 inter- mediate TG-HDL levels, and 82 high TG-HDL levels. The clinical characteristic of the participants of this study are summarized in Table 1. “No. at risk” refers to the total num- ber of participants at risk of diabetes and men accounted for 37.2% of them.
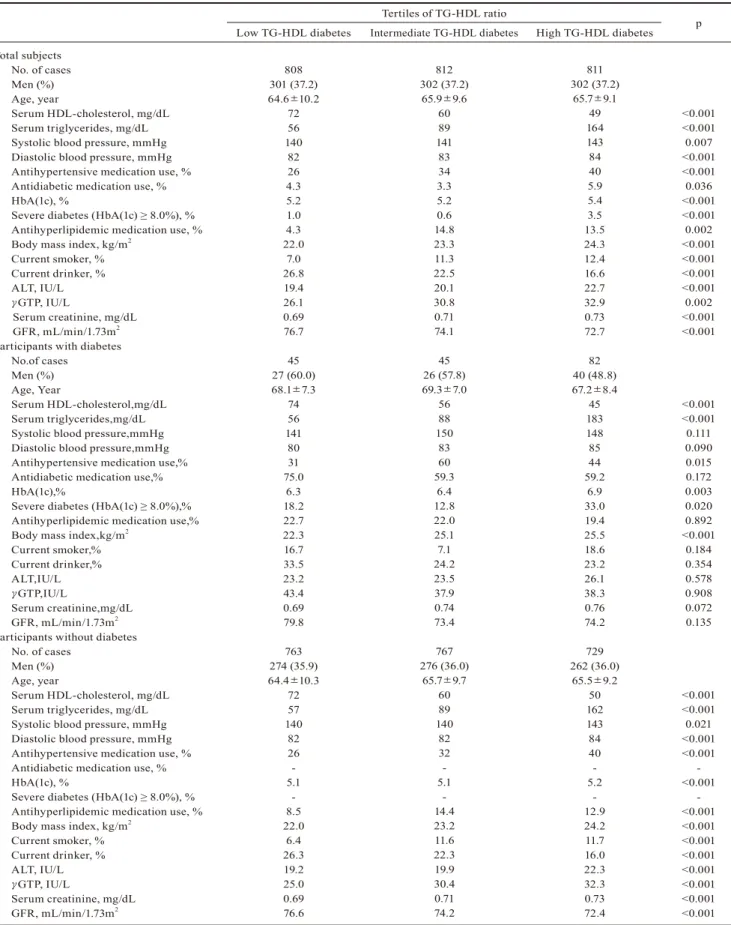
Table 2 shows the characteristics of the study population
according to TG-HDL levels, which were divided into sex- specific tertiles of TG-HDL. HbA1c and BMI were found to be positively associated with TG-HDL levels for total sub- jects as well as for diabetic and non-diabetic participants.
The odds ratios (OR) and 95% confidence intervals (CI)
for overall diabetes by BMI quartile showed J-shaped asso- ciations (Table 3).
Table 3 also shows the odds ratios (OR) and 95% confi-
dence intervals (CI) for subtypes of diabetes by BMI quartile. For low TG-HDL diabetes, we observed an inverse association with BMI, and a positive association for high- TG-HDL diabetes. The multivariable-adjusted OR and 95%CI for a 1SD increment in BMI (3.03 kg/m
2for men and 3.44 kg/m
2for women) for low TG-HDL-ratio diabetes and high TG-HDL-ratio diabetes were 0.53 (95%CI: 0.36-0.77) and 1.57 (95%CI: 1.24-2.01), respectively. Intermediate-TG- HDL diabetes featured a J-shaped association. To avoid the influence of under-nutrition, we performed another analysis restricted to participants with BMI≥19kg/m
2and found al- most the same associations. The multivariable-adjusted OR and 95%CI for a 1SD increment in the BMI for low-TG- HDL-ratio diabetes and high-TG-HDL-ratio diabetes were 0.48 (95%CI: 0.29-0.79) and 1.69 (95%CI: 1.29-2.22), re- spectively.
In addition, we performed a sex-specific analysis for
those subjects and found essentially the same associations for men and women. The multivariable-adjusted OR and 95%CI respectively 1SD increment in BMI for low TG- HDL-ratio and high TG-HDL-ratio diabetes were, respec- tively, 0.55 (95%CI: 0.33-0.93) and 1.85 (95%CI: 1.30-2.64)
Table 1. Clinical characteristics of the study populationParameters Total subjects
No. at risk Men, (n(%)) Age, year
Serum HDL-cholesterol, mg/dL Serum triglycerides, mg/dL TG-HDL ratio, traditional units Systolic blood pressure, mmHg Diastolic blood pressure, mmHg Antihypertensive medication use,(n(%)) HbA1C, %
Diabetes (HbA(1c) ≥6.5%), (n(%)) Severe diabetes (HbA(1c) ≥8.0%),(n(%)) Antidiabetic medication use, (n(%)) Antihyperlipidemic medication use, (n(%)) Body mass index, kg/m2
Current smoker, (n(%)) Current drinker,(n (%))
Serum alanine aminotransferase (ALT), IU/L Serum γ-glutamyltranspeptidase (γGTP), IU/L Serum creatinine, mg/dL
Glomerular Filtration Rate (GFR), mL/min/1.73m2
2,431 905 (37.2) 65.4±9.6 60±15 103±64 1.94±1.68
141±21 83±11 806(33) 5.3±0.5 172(7.1) 41(1.7) 109(4.5) 305(12.5) 23.2±3.3 249(10) 534(22) 20±12 30±42 0.71±0.19 74.5±15.1 Values are given as mean ± standard deviation
Table 2. Sex-and age-adjusted mean values for characteristics in relation to TG-HDL levels of study population and participants with diabetes
Tertiles of TG-HDL ratio
Low TG-HDL diabetes Intermediate TG-HDL diabetes High TG-HDL diabetes p Total subjects
No. of cases Men (%) Age, year
Serum HDL-cholesterol, mg/dL Serum triglycerides, mg/dL Systolic blood pressure, mmHg Diastolic blood pressure, mmHg Antihypertensive medication use, % Antidiabetic medication use, % HbA(1c), %
Severe diabetes (HbA(1c) ≥ 8.0%), % Antihyperlipidemic medication use, % Body mass index, kg/m2
Current smoker, % Current drinker, % ALT, IU/L γGTP, IU/L
Serum creatinine, mg/dL GFR, mL/min/1.73m2 Participants with diabetes
No.of cases Men (%) Age, Year
Serum HDL-cholesterol,mg/dL Serum triglycerides,mg/dL Systolic blood pressure,mmHg Diastolic blood pressure,mmHg Antihypertensive medication use,%
Antidiabetic medication use,%
HbA(1c),%
Severe diabetes (HbA(1c) ≥ 8.0%),%
Antihyperlipidemic medication use,%
Body mass index,kg/m2 Current smoker,%
Current drinker,%
ALT,IU/L γGTP,IU/L
Serum creatinine,mg/dL GFR, mL/min/1.73m2 Participants without diabetes
No. of cases Men (%) Age, year
Serum HDL-cholesterol, mg/dL Serum triglycerides, mg/dL Systolic blood pressure, mmHg Diastolic blood pressure, mmHg Antihypertensive medication use, % Antidiabetic medication use, % HbA(1c), %
Severe diabetes (HbA(1c) ≥ 8.0%), % Antihyperlipidemic medication use, % Body mass index, kg/m2
Current smoker, % Current drinker, % ALT, IU/L γGTP, IU/L
Serum creatinine, mg/dL GFR, mL/min/1.73m2
808 301 (37.2) 64.6±10.2
72 56 140
82 26 4.3 5.2 1.0 4.3 22.0
7.0 26.8 19.4 26.1 0.69 76.7 45 27 (60.0) 68.1±7.3
74 56 141
80 31 75.0
6.3 18.2 22.7 22.3 16.7 33.5 23.2 43.4 0.69 79.8 763 274 (35.9) 64.4±10.3
72 57 140
82 26 - 5.1
- 8.5 22.0
6.4 26.3 19.2 25.0 0.69 76.6
812 302 (37.2)
65.9±9.6 60 89 141
83 34 3.3 5.2 0.6 14.8 23.3 11.3 22.5 20.1 30.8 0.71 74.1 45 26 (57.8) 69.3±7.0
56 88 150
83 60 59.3
6.4 12.8 22.0 25.1 7.1 24.2 23.5 37.9 0.74 73.4 767 276 (36.0)
65.7±9.7 60 89 140
82 32 - 5.1
- 14.4 23.2 11.6 22.3 19.9 30.4 0.71 74.2
811 302 (37.2)
65.7±9.1 49 164 143 84 40 5.9 5.4 3.5 13.5 24.3 12.4 16.6 22.7 32.9 0.73 72.7 82 40 (48.8) 67.2±8.4
45 183 148 85 44 59.2
6.9 33.0 19.4 25.5 18.6 23.2 26.1 38.3 0.76 74.2 729 262 (36.0)
65.5±9.2 50 162 143 84 40 - 5.2
- 12.9 24.2 11.7 16.0 22.3 32.3 0.73 72.4
<0.001
<0.001 0.007
<0.001
<0.001 0.036
<0.001
<0.001 0.002
<0.001
<0.001
<0.001
<0.001 0.002
<0.001
<0.001
<0.001
<0.001 0.111 0.090 0.015 0.172 0.003 0.020 0.892
<0.001 0.184 0.354 0.578 0.908 0.072 0.135
<0.001
<0.001 0.021
<0.001
<0.001 -
<0.001 -
<0.001
<0.001
<0.001
<0.001
<0.001
<0.001
<0.001
<0.001 ALT:alanine aminotransferase; γGTP:γ-glutamyltranspeptidase; GFR:Glomerular filtration rate; TG-HDL ratio: Triglycerides / HDL-cholesterol ra- tio; TG-HDL ratio was categorized by sex-specific tertiles of TG-HDL values for total subjects. Median value of tertiles of TG-HDL ratio (traditional units) were 0.91, 1.57, and 3.34 for men, and 0.80, 1.41. and 2.61 for women.
for men and 0.48 (95%CI: 0.25-0.91) and 1.38 (95%CI: 0.98- 1.94) for women.
To eliminate the influence of menopausal status, we fur-
ther investigated the associations between a 1SD increment in BMI and the risks of low TG-HDL and high TG-HDL diabetes only in elderly women (≥ 60 years) and found es- sentially the same associations: the multivariable OR and 95%CI of low TG-HDL-ratio diabetes and high TG-HDL- ratio diabetes were 0.42 (95%CI: 0.19-0.95) and 1.58 (95%CI:
1.04-2.40), respectively.
As part of our study, we conducted a further investigation
of CAVI (Cardio Ankle Vascular Index) data for 2,414 sub- jects, which showed a significantly positive association be- tween diabetes categorized by TG-HDL and increased arte- rial stiffness (mean CAVI≥8.0). The multivariable OR and 95%CI of increased arterial stiffness were 0.94 (95%CI:
0.42-2.12) for low TG-HDL-ratio diabetes, 0.79 (95%CI:
0.38-1.66) for intermediate TG-HDL diabetes, and 2.27 (95%CI: 1.21-4.24) for high TG-HDL-ratio diabetes, re- spectively.
4. Discussion
A major finding of the present study was that the associa-
tions between diabetes and BMI for Japanese people are
strongly influenced by the status of TG-HDL.
A random-digit telephone survey of 195,005 adults aged
18 years or older concluded that overweight and obesity were significantly associated with diabetes. Compared with subjects of normal weight, those with a BMI of 40 or higher proved to have an odds ratio (OR) of 7.37 (95%CI: 6.39- 8.50) for having been diagnosed with diabetes.
4However, numerous studies have shown there are striking differences in the average BMI of diabetes patients from different popu- lations: The UK Prospective Diabetes Study (UKPDS) re- ported that the average BMI of patients with diabetes was 29.4 kg/m
2, whereas the Japan Diabetes Complications Study (JDCS) reported a corresponding value of 23.1 kg/
m
2.
19,20A pooled cross-sectional analysis that was conducted to evaluate the association between baseline BMI and self- reported diabetes status in over 900,000 individuals showed that the prevalence of diabetes in Japan was higher for indi- viduals with lower BMI (22.5 kg/m
2>BMI) than it was in China, Taiwan, Korea, and Singapore, while for individuals with higher BMI, the prevalence was similar.
21In addition, our analysis showed a J-shaped association between BMI levels and overall risk of diabetes.
Moreover, Asian type 2 diabetes patients are reportedly
characterized by lower BMI and lower serum insulin levels than their Mexican-American or African-American coun- terparts.
1-3These findings seem to indicate that the risk of
Table 3. Odds ratios (OR) and 95% CI for total diabetes and subtypes in relation to BMI level quartilesHeight quartiles
1 SD increment in BMI
Q1 (low) Q2 Q3 Q4 P for trend
Total diabetes No. at risk
No. of cases (percentage) Sex-and age-adjusted OR Multivariable OR Diabetes (low TG-HDL ratio)
No. of cases (percentage) Sex-and age-adjusted OR Multivariable OR
Diabetes (intermediate TG-HDL ratio) No. of cases (percentage) Sex-and age-adjusted OR Multivariable OR Diabetes (high TG-HDL ratio)
No. of cases (percentage) Sex-and age-adjusted OR Multivariable OR
607 36 (5.9) 1.69 (0.97-2.92) 1.82 (0.66-5.03)
18 (3.0) 1.00 1.00 9 (1.5) 2.22 (0.68-7.31) 2.14 (0.50-9.08)
9 (1.5) 1.00 1.00
608 22 (3.6)
1.00 1.00 9 (1.5) 0.49 (0.22-1.04) 0.79 (0.29-2.17)
4 (0.7) 1.00 1.00 9 (1.5) 1.00 (0.39-2.53) 1.34 (0.48-3.73)
609 46 (7.6) 2.18 (1.29-3.67) 3.05 (1.20-7.79)
12 (2.0) 0.65 (0.31-1.37) 0.62 (0.23-1.67)
10 (1.6) 2.50 (0.78-8.02) 1.91 (0.55-6.65)
24 (3.9) 2.71 (1.25-5.88) 3.12 (1.29-7.58)
607 68 (11.2) 3.35 (2.04-5.51) 4.09 (1.63-10.29)
6 (1.0) 0.32 (0.13-0.82) 0.17 (0.05-0.55)
22 (3.6) 5.58 (1.91-16.33) 3.65 (1.14-11.73)
40 (6.6) 4.64 (2.23-9.66) 4.34 (1.82-10.31)
0.026 0.004
<0.001
<0.001
0.66 (0.48-0.92) 0.53 (0.36-0.77)
1.83 (1.51-2.21) 1.57 (1.24-2.01) Odds ratios and 95% CI obtained from conditional logistic regression models. Multivariable OR: adjusted further for body mass index, smoking status, drinking status, systolic blood pressure, antihypertensive medication use, antidiabetic medication use, antihyperlipidemic medication use, ALT, γGTP and GFR. The median values of BMI quartiles were 20.5kg/m2, 22.7kg/m2, 24.0kg/m2 and 27.2kg/m2 for men and 19.1kg/m2, 21.5kg/m2, 23.7kg/m2, 26.9kg/m2 for women.
diabetes for those with lower BMI is associated with lower serum insulin levels.
Since absolute insulin deficiency may cause relative un-
der-nutrition because of a lack of ability to metabolize glu- cose, which could result in a lower BMI, and insulin resis- tance, which may be caused by over-nutrition, the association between BMI and diabetes may be confounded by these two different mechanisms. However, and to the best of our knowledge, no studies have been reported on the associa- tion between BMI and diabetes while taking these two mechanisms into account.
On the other hand, in the presence of insulin resistance,
HDL levels are often found to be reduced
4,22and TG levels elevated.
8Furthermore, previous studies reported that TG- HDL also reflected the level of insulin resistance in general participants,
9overweight individuals,
10,11and type2 diabe- tes,
12while other studies reported that insulin sensitivity and insulin secretion were linked.
13,14High TG-HDL levels can indicate the presence of insulin resistance, while lower serum insulin levels can be indicated by low TG-HDL lev- els. In our study, low TG-HDL diabetes showed an inverse association with BMI, while high TG-HDL diabetes showed a positive association with BMI, which can be explained by the mechanisms described above. Furthermore, the associa- tion between the prevalence of diabetes in patients with in- termediate TG-HDL and BMI, which showed a J-shape, is essentially the same as that between the overall prevalence of diabetes and BMI. These two types of associations can be explained by confounding caused by two different types of diabetes. It is well known that patients with advanced severe diabetes often show low BMI. However, our analysis showed the sex- and age-adjusted prevalence of severe diabetes (HbA1c
≥ 8%) was significantly and positively associatedwith TG-HDL levels. This prevalence was 18.2% for low- TG-HDL diabetes, 12.8% for intermediate-TG-HDL diabe- tes and 33.0% for high-TG-HDL diabetes (P=0.020).
Certain potential limitations of this study warrant consid-
eration. First, although significant associations were ob- served in our study of BMI-levels, there was a wide confi- dence interval due to the small number of incident cases.
However, a 1SD increment in BMI showed significant as- sociations with both low- and high-TG-HDL diabetes.
Second, since no data on exercise were available, we
could not adjust for the effect of exercise. Third, there might be a difference in patient compliance between low- and high-TG-HDL diabetes patients, which may influence as- sociations between diabetes and BMI. However, our study showed that associations between BMI and risk of subtypes of diabetes remained significant even after adjustment for
anti-diabetic and anti-hyperlipidemic medication use. Fur- thermore, we detected no significant differences in the sex- and age-adjusted prevalence of taking anti-diabetic and an- ti-hyperlipidemic medication among subtypes of diabetes.
Fourth, we had no access to menopausal status data, al- though menopause is well known as a strong classical risk factor for diabetes among women. However, the previously observed associations remained essentially the same even after we restricted the analysis to women over 60 years old.
Fifth, a number of the participants with type1 diabetes were initially diagnosed with type 2 diabetes at disease onset and in our study, too, it was difficult to differentiate type1 from type 2 diabetes.
23However, most subjects in previous stud- ies were also defined as type 2 diabetes without information on serum insulin levels, urinary C-peptide, anti-glutamic acid decarboxylase and anti-islet cells, which is considered necessary to rule out type1 diabetes.
1-3What is more, type1 diabetes is also considered to be an independent risk factor for atherosclerosis,
24while a previous study of ours, on high TG-HDL diabetes, and which did not distinguish between type1 and type 2, identified a significant risk of atheroscle- rosis for men.
15Also, and as part of our study, high TG-HDL diabetes was found to be significantly and positively associ- ated with increased arterial stiffness whereas no such asso- ciation was observed for intermediate and low TG-HDL diabetes. This means that associations between BMI and diabetes in relation to TG-HDL do constitute an efficient tool for estimating risk of atherosclerosis for diabetes pa- tients. And because other Japanese studies have reported that there may be a complex association between drinking status and insulin resistance
25as well as incidence of diabe- tes for Japanese men,
26pancreatic dysfunction may also have an effect on the association between BMI and diabetes in relation to TG-HDL. Since it is known that a high preva- lence of drinking is characteristic of Japanese men,
27, 28the associations discussed here may be affected by sex differ- ences if pancreatic dysfunction is found to have a major in-
fluence on those associations. However, our additional anal-yses found that a 1SD increment in BMI was positively associated with high TG-HDL diabetes and inversely asso- ciated with low TG-HDL diabetes for both men and women, that is, regardless of sex. Finally, because this study is a cross-sectional study, we cannot establish any causal rela- tionships.
In conclusion, our findings suggest that the associations
between diabetes and BMI for Japanese subjects are strong-
ly influenced by the status of TG-HDL. This indicates that
such associations may constitute an efficient tool for esti-
mating risk of atherosclerosis for diabetes patients.
Acknowledgements
This work was supported by Grants-in-Aid for Scientific
Research from the Japan Society for the Promotion of Sci- ence (No. 22370090). All authors declare to have no finan- cial or any other kind of conflicting interests in connection with this paper. We are grateful to the staff of Goto City Hall for their outstanding support.
References
1. Duval S, Vazquez G, Baker WL, Jacobs DR Jr; CODA study group.
The Collaborative Study of Obesity and Diabetes in Adults (CODA) project: meta-analysis design and description of participating studies.
Obes Rev 8:263–276, 2007.
2. Ehm MG, Karnoub MC, Sakul H, Gottschalk K, Holt DC, Weber JL, Vaske D, Briley D, Briley L, Kopf J, McMillen P, Nguyen Q, Reisman M, Lai EH, Joslyn G, Shepherd NS, Bell C, Wagner MJ, Burns DK.
American Diabetes Association GENNID Study Group. Genetics of NIDDM. Genomewide search for type 2 diabetes susceptibility genes in four American populations. Am J Hum Genet 66:1871–1881, 2000.
3. Wong KC, Wang Z. Prevalence of type 2 diabetes mellitus of Chinese populations in Mainland China, Hong Kong, and Taiwan. Diabetes Res Clin Pract 73:126–134, 2006.
4. Mokdad AH, Ford ES, Bowman BA, Dietz WH, Vinicor F, Bales VS, Marks JS. Prevalence of obesity, diabetes, and obesity-related health risk factors,2001. JAMA 289:76-79, 2003.
5. Suraamornkul S, Kwancharoen R, Ovartlarnporn M, Rawdaree P, Ba- jaj M. Insulin clamp-derived measurements of insulin sensitivity and insulin secretion in lean and obese asian type 2 diabetic patients. Me- tab Syndr Relat Disord 8:113-118, 2010.
6. Ko GT, Chan JC, Cockram CS, Woo J. Prediction of hypertension, diabetes, dyslipidaemia or albuminuria using simple anthropometric indexes in Hong Kong Chinese. Int J Obes Relat Metab Disord 23:1136-1142, 1999.
7. Stalder M, Pometta D, Suenram A. Relationship between plasma insulin levels and high density lipoprotein cholesterol levels inhealthy men. Diabetologia 21:544-548, 1981.
8. Farquhar JW, Frank A, Gross RC, Reaven GM. Glucose, insulin and trigryceride responses to high and low carbohydrate diets in man. J Clin Invest 45:1648-1656, 1966.
9. Antonio GC, Luis ESM, Sandra EA. Elevated triglycerides / HDL- cholesterol ratio associated with insulin resistance. Cir Cir 79:126-131, 2011.
10. McLaughlin T, Abbasi F, Cheal K, Chu J, Lamendola C, Reaven G.
Use of metabolic marker to identify overweight individuals who are insulin resistant. Ann Intern Med 139:802-809, 2003.
11. Karelis AD, Pasternyk SM, Messier L, St-Pierre DH, Lavoie JM, Gar- rel D, Rabasa-Lhoret R. Relationship between insulin sensitivity and the triglyceride-HDL-c ratio in overweight and obese postmenopausal women: a MONET study. Appl Physiol Nutr Metab 32:1089-1096, 2007.
12. Surapton T, Prapaporn P, Orathai T. Association of serum lipoprotein ratios with insulin resistance in type2 diabetes mellitus. Indian J Med Res 131:641-648, 2010.
13. Kahn SE. The relative contributions of insulin resistance and β-cell, dysfunction to the pathophysiology of type 2 diabetes. Diabetologia 46:13–19, 2003.
14. Bergman RN, Ader M, Huecking K, Van Citters G. Accurate assess- mentof beta-cell function: the hyperbolic correction. Diabetes 51:
212–220, 2002.
15. Shimizu Y, Nakazato M, Sekita T, Kadota K, Yamasaki H, Takamura N, Aoyagi K, Maeda T. Association of arterial stiffness and diabetes with triglycerides-to-HDL cholesterol ratio for Japanese men: The Nagasaki Islands Study. Atherosclerosis 228:491-495, 2013.
16. Imai E. Equation for estimating GFR from creatinine in Japan. Nihon Rinsho 66:1725-1729, 2008.
17. Kashiwagi A, Kasuga M, Araki E, Oka Y, Hanafusa T, Ito H, Tomi- naga M, Oikawa S, Noda M, Kawamura T, Sanke T, Namba M, Hashi- ramoto M, Sasahara T, Nishio Y, Kuwa K, Ueki K, Takei I, Umemoto M, Murakami M, Yamakado M, Yatomi Y, Ohashi H. Committee on the Standardization of Diabetes Mellitus Related laboratory Testing of Japan Diabetes Society: International clinical harmonization of gly- cated hemoglobin in Japan: From Japan Diabetes Society to National Glycohemoglobin Standardization Program values. J of diabetes In- vest 3:39-40, 2012.
18. American Diabetes Association. Diagnosis and classification of diabe- tes mellitus. Diabetes Care 33:562-569, 2012.
19. Davis TM, Cull CA, Holman RR; U.K. Prospective Diabetes Study (UKPDS) Group. Relationship between ethnicity and glycemic con- trol, lipid profiles, and blood pressure during the first 9 years of type 2 diabetes: U.K. Prospective Diabetes Study (UKPDS 55). Diabetes Care 24:1167–1174, 2001.
20. Sone H, Katagiri A, Ishibashi S, Abe R, Saito Y, Murase T, Yamashita H, Yajima Y, Ito H, Ohashi Y, Akanuma Y, Yamada N; JD Study Group. Effects of lifestyle modifications on patients with type 2 diabe- tes: the Japan Diabetes Complications Study (JDCS) study design, baseline analysis and three year-interim report. Horm Metab Res 34:509–515, 2002.
21. Boffetta P, McLerran D, Chen Y, Inoue M, Sinha R, He J, Gupta PC, Tsugane S, Irie F, Tamakoshi A, Gao YT, Shu XO, Wang R, Tsuji I, Kuriyama S, Matsuo K, Satoh H, Chen CJ, Yuan JM, Yoo KY, Ahsan H, Pan WH, Gu D, Pednekar MS, Sasazuki S, Sairenchi T, Yang G, Xiang YB, Nagai M, Tanaka H, Nishino Y, You SL, Koh WP, Park SK, Shen CY, Thornquist M, Kang D, Rolland B, Feng Z, Zheng W, Potter JD: Body Mass Index and Diabetes in Asia. A Cross-Sectional Pooled Analysis of 900,000 Individuals in the Asia Cohort Consortium. PLos One 6:e19930, 2011.
22. Fossati P, Romon.RM. Insulin and HDL-cholesterol metabolism. Dia- bete Metab 13:390-394, 1987.
23. Kawasaki E, Ide A, Abiru N, Eguchi K. Review article immunogenic heterogeneity of type 1 diabetes in Japan. Acta Med Nagasaki 47:81- 88, 2002.
24. Duncan B, Darryl M, Kenneth S, Michel C. Endothelial dysfunction and presymptomatic atherosclerosis in type 1 diabetes-pathogenesis and identification. Br J Diabetes Vasc Dis 3:27-34, 2003.
25. Gunji T, Matsuhashi N, Sato H, Iijima K, Fujibayashi K, Okumura M, Sasabe N, Urabe A: Alcohol consumption is inversely correlated with insulin resistance, independent of metabolic syndrome factors and fatty liver disease. J Clin Gastroenterol 45:808-813, 2011.
26. Waki K, Noda M, Sasaki S, Matsumura Y, Takahashi Y, Isogawa A, Ohashi Y, Kadowaki T, Tsugane S; JPHC Study Group: Alcohol con- sumption and other risk factors for self-reported diabetes among mid- dle aged Japanese: a population-based prospective study in the JPHC study cohort I. Diabet Med 22:323-331, 2005.
27. Shimiuz Y, Imano H, Ohira T, Kitamura A, Kiyama M, Okada T, Ishikawa Y, Shimamoto T, Yamagishi K, Tanigawa T, Iso H: Alkaline phosphatase and risk of stroke among Japanese: The Circulatory Risk in Community Study (CIRCS). J stroke cerebrovas dis 22:1046- 1055,2013.
28. Shimizu Y, Maeda K, Imano H, Ohira T, Kitamura A, Kiyama M, Okada T, Ishikawa Y, Shimamoto T, Yamagishi K, Tanigawa T, Iso H:
Chronic kidney disease and drinking status in relation to risk of stroke and its subtypes. The Circulatory Risk in Communities Study (CIRCS). Stroke 42:2531-2537, 2011.