Acta med. Nagasaki. 18: 26-34
Influence of the Excessive Intake of Monosodium
L-Glutamate on the Growth and the Livers of Albino Rats
Kazuko OKA*, Noriko SUWA*, and Issei NISHIMORI**
*Nagasaki Prefectural Women's Junior College
**Department of Pathzlogy, Nagasaki University School of Medicine
Received for publication, February 10, 1974
It is already known that the excessive administration of monosodium L-glutamate (MSG) will cause various symptoms, and that the overmuch ingestion of amino acids will also give rise to liver disturbances. In the present study, MSG was administered to albino rats orally at varied concentrations, and its influences on the animals' growth and on their livers were examined.
In the group given a 1 % MSG solution, the deviation of the body-weight began to enlarge on about the 30th day, because some of the individuals had an inclination to grow corpulent. The vitamin A content of the liver from this group was larger than that from the control group. In the examination of the liver tissue specimens, a little fatty degeneration assumed to be due to toxication was observed, but it seemed not to be so severe as to impede liver function.
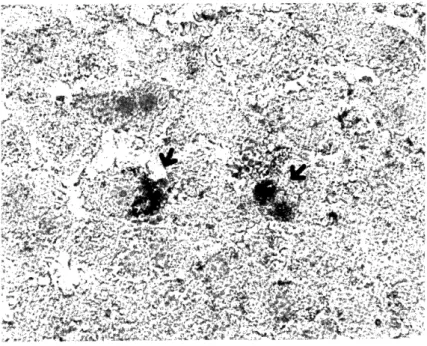
In the group given a 5% MSG solution, some were thinner than the individuals of the 1 % group. The vitamin A content of the liver from this group was smaller than that from the control group. In some individuals in this group, their body coats turned brown in some spots, with some hairs falling off. Some of the liver tissue cells were attacked by necrosis, showing secondary fatty degeneration. The degeneration was presumed to be caused by toxication.
In the group given a 10 MSG solution, all the individuals died by the 5th day.
Their body coats had turned brown with a great many hairs falling off.
*岡 和 子,諏 訪 紀 子 **西 森 一 正
INTRODUCTION
In 1971 MOTOYAMAI) reported on cases that had, after eating mu.suhi kombu (knot- ted sea tangles), showed symptoms of numbness on the back of the head and neck, burning sensations, headache, band-like pressure around the temples and forehead, palsy on the limbs, nausea, etc. In these sea tangles, 30-50% monosodium L-glutamate (MSG) was detected, which he assumed to be the cause of these symptoms. SCHAUMBURG, et al .2) noticed that the ingestion of a large amount of MSG to an. empty human stomach caused similar symptoms, such as burning sensations, facial pressure, and chest pain, and they called these symptoms "Chinese Restaurant Syndrome." On the other hand, OLNEY"
reported in 1969 that injection of MSG to newborn albino mice had caused an abnormal increase in bodyweight after about 150 days and the development of necrosis in the hypothalamus. Moreover, there are some more reports which state that the excessive intake of amino acids or the extremely unbalanced amino acids in diet will give rise to the disturbances in the liver including fatty degeneration 4)-9) .
In the present study, therefore, the authors have attempted to examine the degrees of the abnormalities in the livers caused by the oral administration of varied dosages of MSG to albino rats. As it is generally said that the liver stores vitamin A and that the abnormality in liver function causes the decrease in its vitamin A content, the amount of vitamin A contained in the liver has been measured, and together with it the external symptoms assumed to be due to the deficiency of vitamin A have been investigated.
Furthermore, the abnormal changes in the liver have been examined histologically, and the causes of them discussed.
MATERIALS AND METHODS
Wistar male albino rats weighing approximately 30 g were used for the experiment.
Prior to the experiment, they were fed for a week with MF solid food prepared by the Oriental Yeast Industry Co. , Ltd. They then were divided into four groups consisting of six each, and each of the animals was kept in a single cage separately.
The MSG solutions which were given to these groups orally are shown in Table 1.
The concentrations of these solutions were adjusted to 0% (for control), 1.%, 5%, and10%
respectively by diluting MSG with drinking water. Each solution was administered to the animals of each group as much as they wanted. The animals were fed with MF solid food for 37 days. During the period the animals' body-weight and their daily intake of MSG solutions were measured on some fixed days. As for the difference in body-weight between the groups, the analysis of variance of the mean values") for all the groups was made on every measuring day. On the 37 th day the rats were decapitated and bled under anaesthe-
sia with ether, and the livers were taken out by means of laparotomy. A part of each liv-
er was used for the colorimetri determination of vitamin A by means of the Carr-Price
reaction. For the colorimetry a 5hbnazv spectrophotometer, QR-50 type, was used. From
the other part of the liver, histological specimens were prepared by fixing with a
10% formalin solution. The specimens were subjected to fat-staining with haematoxylin- eosin and Sudan III for the pathohistological study.
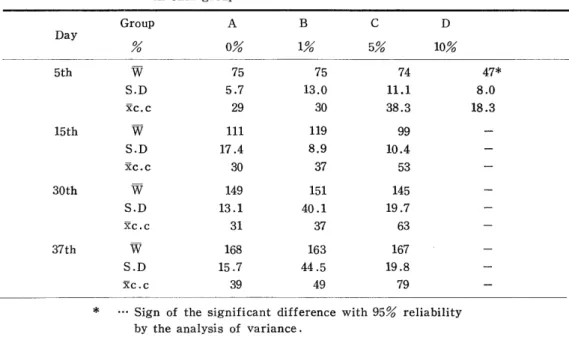
Table 1 Mean intakes of MSG Solution, mean body weights, and standard deviations of individual body weights
in each group.
Group A B C D
Day
0% 1% 5% 10%
5th W 75 75 74 47*
S.D 5.7 13.0 11.1 8.0
Re. c 29 30 38.3 18.3
15th W 111 119 99 -
S.D 17.4 8.9 10.4 -
Re. C 30 37 53 -
30th W 149 151 145 -
S.D 13.1 40.1 19.7 -
Re. c 31 37 63 -
37th W 168 163 167 -
S.D 15.7 44.5 19.8 -
Re. c 39 49 79 -
* ... Sign of the significant difference with 95% reliability by the analysis of variance.
x ... Mean intake of MSG solution W ... Mean body weitht
S . D ... Standard deviation of weights
RESULTS
1. Growth
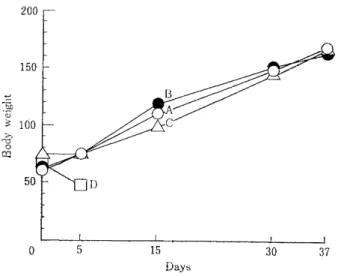
The changes of the mean body-weights of the groups shown in Fig. 1. The figure
tells that the animals in the group given a 10% MSG solution lost weight rapidly and died
soon. Of all the mean body-weights of the groups on measuring days in Table 1, what is
significantly different from others is marked with an asterisk, indicating that the mean
volue of the 10% MSG group on the 5th day was especially small. But the mean values of
the other experimental groups showed no significant differenence5) from that of the control
group on any measuring day. And the comparison of the standard deviations of the body-
weights of the groups on all the measuring days showed that the standard deviation for
the 1.% MSG group increased rapidly after the 30th day. This is due to the fact that in
this group there were some especially weighty ones among them then compared with the
controls. On the other hand, the 5 MSG group gave a little larger standard deviations
than the control group. But in the group given a 10 % MSG solution which is considered
to have had a fatal influence, the standard deviation of the body-weight on the 5th day
showed an especially small value.
Days
Fig. 1 Growth of the rats in each group.
2. Intake of MSG
The daily intakes of MSG solutions are shown in Table 1. Some reasons are pre- sumed for the change of the intakes, but the experiments to ascertain them have not yet been made. As for the mean intakes of the groups, the 1% and 5% MSG groups had a tendency to show a greater increase than the control group as days passed . And the 10%
MSG group gave a very small value for the intake on the 5th day. The mean daily MSG intakes of the groups obtained from the daily intakes of the solution are shown in Table 2.
It shows that in the 1% and 5% MSG groups the MSG intakes increased as the body- weights increased.
Table 2 Mean intakes of MSG in each group.
Group A B C D
Day
5th 0.3mg 1.9mg 1.8mg
15th 0.4 2.6 -
30th 0.4 3.1 -
37th 0.5 3.9 -
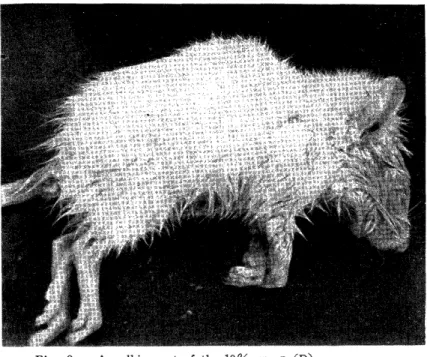
3. Skin Disorders
The external symptoms seen on an individual of the group given MSG at a fatal con- centration of 10% are as shown in Fig. 2.
The body coat, which had been white, turned brown with some hairs falling off. And in
the 5% MSG group, some individuals were often observed to have the hairs on their faces
or lumbar regions turned brown some falling off from about the 8th day on. But this
symptom was reversible.
Fig. 2. An albino rat of the 10% group (D).
The hair has turned brown, some falling off.
4. Vitamin A Content of the Liver
The mean vitamin A contents of the livers from the rats of the 0%, 1%, and 5 6 groups on the 37th day are shown in Table 3.
The analysis of the variance10) of the mean values for the groups showed that the mean vitamin A content of the 1 % MSG group was larger than that of the control group. On the other hand, the mean vitamin A content of the 5% MSG group was observed to be smaller than that of the control group. It is because some individuals of the 1% MSG group contained much higher percentages of vitamin A in the livers than the controls, and most of the 5% MSG group contained lower percentages of vitamin A in the livers than the con-
Table 3 Liver vitamin A contents in each group. I.U./g
Group
No A B C
.