Discussion Paper Series
Graduate School of Economics and School of Economics Meisei University
Discussion Paper Series, No. 36 April 2017
Relative Performance Information Feedback and Just-Pass Behavior: Evidence from a Field Experiment
Shinya Kajitani (Meisei University)
Keiichi Morimoto (Meisei University)
Shiba Suzuki (Seikei University)
Hodokubo 2-1-1, Hino, Tokyo 191-8506 School of Economics, Meisei University
Phone:+81-(0)42-591-9479 Fax: +81-(0)42-599-3024 URL: http://keizai.meisei-u.ac.jp/econ/
E-mail: [email protected]
Relative Performance Information Feedback and Just-Pass Behavior:
Evidence from a Field Experiment
∗Shinya Kajitani† Keiichi Morimoto‡ Shiba Suzuki§ April 24, 2017
Abstract
This paper investigates the relationship between the feedback of performance information and effort input by students under a relative grading scheme. By con- ducting a randomized experiment in an economics course at a Japanese university, we demonstrate that relative performance information feedback improves the per- formance of students with only intermediate scores in the midterm examination, but worsens the performance of high-scoring students. A theoretical interpreta- tion suggests that a decrease in uncertainty in the relative ability of students is responsible, which we refer to as “just-pass” behavior.
Keywords: education, experiment, relative performance information feedback, tour- naments
JEL Classification: D03, D81, I21
∗We are very grateful to Kentaro Kobayashi, Hayato Nakata, and Masahiro Watabe for invaluable advice. We also thank Naohito Abe, Kosuke Aoki, Shigeki Kano, Akira Miyaoka, Tomoharu Mori, Masao Nagatsuka and participants at annual meeting on Japanese Economic Association 2013 Spring Meeting (Toyama, Japan), Economic Science Association European meeting 2015 (Heidelberg, Gernamny), and seminar participants at Osaka University, Seikei University, and the University of Tokyo for their helpful comments. This experiment was approved by the university’s research ethics committee (Application No. H26-002). Of course, we are responsible for any remaining error.
†Corresponding author. Department of Economics, Meisei University, 2-1-1, Hodokubo, Hino, Tokyo 191-8506, Japan. E-mail address: [email protected]
‡Department of Economics, Meisei University, 2-1-1, Hodokubo, Hino, Tokyo 191-8506, Japan. E-mail address: [email protected]
§Faculty of Economics, Seikei University, 3-3-1, Kichijoji-kitamachi, Musashino, Tokyo 180-8633, Japan. E-mail address: [email protected]
1 Introduction
Recently, researchers have become interested in information feedback as an efficient way of eliciting the incentives of students to study. This is because information feedback is associated with the reward scheme, and this is critically important in considering student incentives. As regards the reward scheme in an educational context, “relative grading” or “grading on a curve” is widely used, although it remains controversial.1 In relative grading, student grades depend on their positions in the class score distribution.
Such a reward scheme is then a type of rank-order tournament. Becker and Rosen (1992) extend the rank-order tournament model in Lazear and Rosen (1981) to understand better student incentives in a relative grading scheme. Becker and Rosen (1992) emphasize the importance of a student’s position in the distribution of academic attainment and show that competition between students indeed stimulates their learning effort. This indicates that information on a student’s position in the distribution of academic attainment affects their decision-making in providing effort. In actual schooling environments, multiple examinations, including midterm and final examinations, determine student grades. It is then worth considering the relationship between information on a student’s relative position in the distribution of past examination scores and the student’s incentive to provide study effort for future examinations.2
In this paper, we conduct a randomized field experiment using students undertaking a compulsory course in economics at a Japanese university, relatively graded using the results of midterm and final examinations. In our experiments, as in most academic coursework, the performance of students in the midterm and final examinations deter- mines student grades. We divide the student into a control group and a treatment group immediately after the midterm examination. While students in the control group are informed only about their midterm examination score, those in the treatment group also receive their rank in the midterm examination. That is, we provide relative performance information feedback to students in the treatment group. We then explore the impact of this relative performance information feedback on student performance in the final
1Volokh (2015) argues that relative grading is favorable for teachers as a means to control grade inflation and to ensure students have an opportunity to receive a higher grade, even if the examinations are too difficult to obtain high marks. Conversely, Grant (2016) points out the problematic aspects of relative grading that prevent students from collaborating owing to the overly competitive environment.
2Aoyagi (2010) and Ederer (2010) theoretically analyze information feedback in a dynamic tournament context.
examination. To our knowledge, this paper is the first attempt to investigate the impact of relative performance information feedback on student incentives to study when graded relatively.
Prior to investigating the experimental results, we construct a simple theoretical tour- nament model. We assume that students only care about whether they pass the course.
That is, we assume that students are interested in passing the course with minimal provi- sion of effort and do not consider getting a higher grade.3 In our simple theoretical model, the information on relative performance in the midterm examination serves as a source of information for borderline passing as it depends on the distribution of the midterm examination scores. A student who knows her own relative performance can then more accurately calculate the effort provision they need to exert to pass the course than a student who does not. Our theoretical model demonstrates that for marginal students with intermediate marks in the midterm examination, relative performance information serves as a signal that they will need to work harder to pass the final examination. In contrast, for students with sufficiently high marks in the midterm examination, relative performance information is a signal that they can pass the final examination with only moderate effort. That is, students espouse just-pass behavior.
Using data from the field experiment, we then show that the impact of relative per- formance information feedback varies according to students midterm examination perfor- mance. This is because relative performance information feedback has a positive impact on the final scores of students whose midterm scores are intermediate, but a negative im- pact on the final scores of students whose midterm scores are high. These experimental findings are consistent with our theoretical results.
The remainder of the paper is organized as follows. Section 2 relates the study to the existing literature and Section 3 describes the experimental design. In Section 4, we construct the theoretical tournament model and provide the testable hypothesis.
Section 5 presents the empirical framework and reports the estimation results. Section 6 concludes.
3As described in the following section, existing evidence on the Japanese higher education system and labor markets suggests that Japanese university students adopt “just-pass” behavior.
2 Background
Revealing the role of relative performance information feedback in providing agent incen- tives is often achieved through laboratory experiments. Existing research demonstrates that relative performance information feedback can have both a positive and a negative impact on the agent’s effort provision. Azmat and Iriberri (2016) conduct a laboratory experiment to compare piece-rate incentives, where the reward depends on the number of tasks the subjects solved, and a flat-rate incentive, where the reward is independent of the number of tasks the subjects solved. They find that the relative performance in- formation feedback improves the subjects’ performance when rewards are absolute. In terms of relative performance information feedback in tournament schemes, Eriksson et al. (2009), Freeman and Gelber (2010), and Ludwig and L¨unser (2012) explore the im- pact of relative performance information feedback on agent performance when subjects are rewarded relatively. Eriksson et al. (2009) and Freeman and Gelber (2010) con- clude that relative performance information feedback lowers the performance of subjects whose interim performance is relatively low. However, those subjects whose midterm performance is relatively high do not slacken off. In contrast, Ludwig and L¨unser (2012) examine the effects of effort information in a two-stage rank-order tournament in labo- ratory experiments. They demonstrate that the subjects who lead (“favorites”) tend to lower their effort, but those who lag (“underdogs”) increase it relative to the first stage, while favorites exert a greater effort than underdogs. These results suggest that the impact of relative performance information feedback should vary according to subjects’
initial level of attainment in our relative grading framework.
Information feedback is also the subject of investigation, in particular in actual ed- ucational decision-making.4 Azmat and Iriberri (2010), using data from Spanish high schools, and Tran and Zeckhauser (2012), in a field experiment of Vietnamese university students, demonstrate that relative performance information feedback raises the perfor- mance of students when they are rewarded absolutely. Both these studies argue that if students have competitive preferences, which means that they inherently prefer getting a higher rank than do others, relative performance information has a positive impact on their incentives to study, even if the information is intangible in their reward scheme.
4De Paola and Scoppa (2011) conduct a field experiment in an Italian university to prove that students taking midterm and final examinations obtain higher scores than students taking only final examinations, the difference being that the former receive information on the midterm performance.
Bandiera et al. (2015) employ a sample of students rewarded absolutely in a UK grad- uate school and demonstrate that absolute (but not relative) performance information feedback improves the performance of students whose midterm performance is high; the authors relate the results to knowledge of the educational production function. That is, absolute performance information, which provides students with precise information on their absolute productivity, makes students direct greater effort to study.
These findings imply that relative performance information feedback may have a pos- itive impact on student performance, even in our relative grading setup. If absolute performance information feedback tends to improve student performance, because rela- tive performance information provides students with precise information on theirrelative productivity and the distribution of examination scores, it will exert a significant impact on student behavior in a relative grading scheme. However, there has been no exami- nation of the impact of relative performance information feedback on student incentives under relative grading or grading on a curve in an actual education environment.
Relative rewarding and grading on a curve are themselves issues worth considering because existing research demonstrates that relative grading has an empirically debatable impact on student performance.5 For example, Ashraf et al. (2014) conduct a field experiment in Zambia’s health assistant-training program. In their experiment, student rewards are absolute, with some students advised they will receive a rank-related reward.
The authors conclude that the performance of students whose initial achievement level is relatively low is significantly lower when announced that they will receive a rank- related reward. In contrast, Jalava et al. (2015) conduct a field experiment in Swedish primary schools to compare schemes with different types of reward and find that student performance is higher when rewarded relatively. Czibor et al. (2014) conduct a field experiment in a Dutch university and compare relative and absolute grading. They find that motivated male students rewarded relatively tend to obtain higher performance than students rewarded absolutely. However, both female and male students as a whole are largely unaffected by the reward scheme. On this basis, Czibor et al. (2014) contend that rank incentives are weak if students adopt just-pass behavior. That is, if students only care about whether they can pass the course or not, they will not want to provide effort
5From a theoretical viewpoint, Becker and Rosen (1992) employ a rank-order tournament model to analyze student incentives to study in an educational environment. Dubey and Geanakoplos (2010) compare absolute grading and relative grading, while Paredes (2016) and Brownback (2014) construct a theoretical model of relative grading employing an all-pay auction.
for any higher rank than that to which they aspired. Even if graded relatively, relative performance information feedback may exert different impacts on student incentives to study depending on their attitude toward getting higher grades.
Based on anecdotal and other evidence concerning the university advancement rate and labor markets in Japan, the just-pass behavior observed by Czibor et al. (2014) is a key feature of Japanese university students. The School Basic Survey, which is conducted by the Ministry of Education, Culture, Sports, Science and Technology, shows that the university advancement rate was about 50% in 2014, whereas it was less than 20% in 1990.
Increasing the university advancement rate in Japan could reflect demand-side forces that lead to greater incentives to pursue university education. Most Japanese firms distinguish new college graduates from other job seekers, in the sense that many vacancies for regular full-time jobs explicitly target new college graduates (Genda et al. 2010). Moreover, Lise et al. (2014) show that the wage premium for education, measured by the ratio of mean wages for college-educated full-time workers to less-than-college-educated full-time workers, has tended to increase since 2000 in Japan. Interestingly, while the admission process to prestigious Japanese universities is competitive, credit standards in college courses are low (Abe 2002). That is, hard work is not generally needed for graduation.6
The hiring policy of many Japanese firms also discourages students from studying hard. For example, before 2013, most Japanese firms did not consider a student’s grade point average (GPA) when seeking recruits in labor markets for new graduates.7 Taken together, the high college wage premium, low credit standards in college courses, and recruitment policies in labor markets for new graduates that ignore student GPAs may result in students adopting just-pass behavior.
This background contextualizes our research question: Does relative performance in- formation feedback improve student examination scores under a relative grading scheme?
We shed light on how students with high midterm scores slacken off when given this in- formation. To examine this issue, we construct a simple theoretical model where students exhibit just-pass behavior in a relative grading scheme, and conduct a field experiment
6Kaji (2015) notes that a nontrivial proportion of students in Japanese universities eschew classes that demand serious reading and homework, instead preferring classes in which they will easily earn a credit (raku-tan) and seeking off-campus experiences.
7According to the Nihon Keizai Shinbun (in Japanese), the reason for this was that most firms considered the GPA an unreliable indicator of student attainment. Because each university has its own grading guidelines, firms cannot account for the difference in GPA between one university and another (Nihon Keizai Shinbun, December 8, 2013).
to investigate relative performance information feedback in a relative grading setting.
3 Experimental Design
We performed an experiment using first-year students enrolled in an introductory eco- nomics course during the second semester of 2012 (Economics II) offered by a faculty of economics at a Japanese private university.8 Prior to taking Economics II, these students had already taken an earlier introductory economics course during the first semester of 2012 (Economics I). Credits for both Economics I and II are required for graduation.
Therefore, successfully completing the Economics II course is a primary concern for stu- dents. If a student fails the course, she has to repeat the course the following year. There is a separate class for those students who have previously failed the course (theSai-rishu class). Students were obliged to attend one of four classes in one of four classrooms available for Economics I and II. We placed all students with a top-40 score obtained in a mathematical test conducted immediately following university entrance (Pretest of Mathematics) in one class in one small classroom. We then randomly allocated the re- maining students to the other three classes and classrooms, with all class enrolments fixed across the first and second semesters.
A weighted average of the midterm and final examination scores and the number of homework submissions determine student grades in this course.9 All students take the
8The university where the experiment was conducted is not very selective. Most Japanese universities hold entrance examinations and universities are ranked by their selectivity, as measured by hensachi.
Hensachi is a standardized score published by major cram schools, which offer specialized training for students to pass university entrance examinations. The medianhensachi for students seeking admission to university is 50. Most high school students who wish to enter university sit simulation examinations offered by these cram schools. The schools collect information on student scores in these simulation examinations and the universities whose entrance examinations they successfully passed. Although the manner of calculating hensachi varies according to the school, we consider that it reflects the approx- imate relationship between student scores in the simulation examinations and the university entrance examinations they are expected to pass. According to Kawai-juku (2016), one of the most prominent cram schools, the borderlinehensachifor the economics department where the experiment was conducted indicates that thehensachi score (giving a student a 50% chance of gaining admission to the faculty) is relatively low (40.0–42.5 in 2017).
9In the second semester of 2012, the score calculation was as follows: “40% of the midterm examination score” + “60% of the final examination score” + “the number of homework submissions” (there were 10 homework assignments each worth one point). Perfect scores for both examinations were 110 points.
From the total score of 110 points, 100 points were for the economics component, and the remaining 10 points for basic mathematics.
same examinations at the same time regardless of their classroom. According to the university’s guidelines, the standard pass score for the course is 60 out of 100. If students were to be strictly graded using this guideline, the number of students who fail the course and then have to attend the Sai-rishu class in the following year would be inordinately high. This is because the capacity of the Sai-rishu class is limited and there is only one classroom. Consequently, in many cases, relative not absolute scores decide if students pass or fail the course, with instructors adjusting the final scores to obtain a reasonable pass rate. For example, in Economics I, because the perfect score was 100, the official pass score was 60 but the instructors set the pass score at 51. In other words, instructors determine the borderline score between success and failure. Students are aware of this particular evaluation system as the course instructors announce it at the beginning of the semester. However, students do not know the exact borderline score in advance of taking their examinations.
The details of the experiment are as follows. We randomly assigned all students to a treatment or a control group regardless of classroom. Following the midterm examination, we sent students letters revealing their total score for the midterm examination and their score for the mathematics problems, delivered to them in person during class time. In addition, the letters sent to students in the treatment group also reported their ranks in the midterm examination (i.e., the rank of each student in relation to other students in the course and the total number of students in the course). We did not include this information in the letters to the students in the control group.10 Therefore, while students in the treatment group know their precise rank, students in the control group will only have a vague awareness of their rank. Thus, our experiment can reveal whether the difference in the precision of their relative performance information accounts for the difference in final examination scores under a relative grading setup.11
10The student letter content is similar to that in Ashraf et al. (2014). Appendix Figure 1 reproduces the information provided to the students in the treatment and control groups. One point to note is that the sample used in the estimation model in Section 5.1 is excluded to individuals who could not receive the letters (e.g., those who were absent from classes) regardless of whether they took the final examination (28 individuals). Comparing their mean scores in the midterm examination for the control and treatment groups, the means (standard deviations) for the control and treatment groups are 40.62 (16.75) and 38.27 (18.89), respectively. However, the null hypothesis that “the mean values of the two groups are not different” is not rejected.
11We note that because our experimental design is similar to Tran and Zeckhauser (2012), except for the grading scheme, we share the same problem that students could always exchange rank information to determine their own rank. Moreover, we excluded from our sample the 5% of students who took the
4 A Theoretical Model
In this section, we construct a simple model in which students choose effort input under uncertainty at the borderline of the final examination score to pass the course. The borderline is the score of a representative imaginary rival, which is uncertain because students cannot observe the potential ability of the rival. Student just-pass behavior is then one of the following equilibrium actions.
4.1 Setup and Equilibrium
Setup Consider a course where the assessment comprises a midterm examination and a final examination. The course grade awarded for each student depends on a total score, which is the sum of the scores in the midterm and final examinations: s0 +s, where s0 and s are the scores in the midterm and the final examinations, respectively.12 The midterm examination results are available and each student knows her own score in that examination. Consider a student with midterm examination scores0. She chooses a level of effort input for the final examination to pass the course, incorporating the effort cost.
The student imagines that she competes with a rival student representing the borderline for passing. Because the number of participants is sufficiently large, she thinks of this as an approximately nonstrategic situation. Given this, she regards the rival’s features, such as the score in the midterm examination, ability, and effort inputs, as exogenously given. The student assumes that to achieve a pass, it suffices to beat her imaginary rival in terms of the total score, that is, to control her own score in the final examination to satisfy
s0+s≥S0+S, (1)
whereS0 andS are the rival’s score in the midterm and final examinations, respectively.
The inequality (1) is the condition for the student winning.
The student has a production function of final examination scores such that
s=b+as0e, (2)
midterm examination and received a letter, but who did not subsequently sit the final examination. As for the average midterm score, we cannot readily observe a distinct difference between the two groups.
We discuss these in Section 5.3.
12We consider the case of the weighted average, such asϕs0+ (1−ϕ)s, whereϕ∈[0,1] is the relative weight of the two examinations. However, because the basic results do not depend on the relative weight, we adopt the case of a simple sum.
wherebis the expected minimal score that students can obtain without making effort,ais her potential ability, which is observable to herself, andeis the level of effort input.13 The productivity of the student isas0. Note that this consists of not only abilityabut alsos0. This is because the accumulation of knowledge by the midterm examination positively affects the result of the final examination as effective preparation. The imaginary rival has a similar production function, such that
S =B+AS0E, (3)
whereB is the expected minimal score of the rival, andA andE are the rival’s potential ability and the level of effort input, respectively. The productivity of the imaginary rival is AS0. Suppose that the student can read the level of B, S0, and E but not observe A.14 While the student knows the difference in potential ability among all students is not generally large, whether the rival’s potential ability A is higher or lower than her own is uncertain given the lack of firm belief. The student has a confidence interval of A that depends on the volume of information on the rival’s potential. Suppose that her subjective distribution of A is a uniform distribution along the interval [a −ε, a+ε], where 0 < ε < a. Parameter ε measures the degree of uncertainty for students and captures the degree of her confidence. Note that the distribution is centered at a. By this setting, we interpretAas relative potential ability, although from (3) it appears only like absolute potential ability. Hereafter, we consider A as the level of relative potential ability. Therefore, we believe thatεdecreases when the student is given some information that contributes to the estimation of her relative position in ability among other students.
For example, when the student is informed of her ranking in the midterm examination score, which provides a proxy for relative performance, she also obtains information about the relative ability of her rivals. The confidence interval of the rival’s ability, [a−ε, a+ε], then becomes narrower, that is,ε decreases.
13We adopt the multiplicative form of the production function, as in the theoretical analysis of tour- naments, such as Hammond and Zheng (2013).
14We may choose a setting in which the structure ofS is unknown to each individual. It suffices to assume that the students have a subjective distribution ofS in such a case.
In reality, students appear able to conceive the average competitor’s achievement and learning attitude from the state of affairs in the various classrooms. However, potential ability seems more difficult to estimate precisely and hence is one of the most natural sources of uncertainty. In addition, it helps us obtain a simple analytical expression and concrete interpretation. Therefore, for simplicity, we assume thatB, S0, and E are deterministically given parameters andA is a random variable for the student.
The student obtains utility depending on the result of the tournament with the imag- inary rival. We assume that the student is concerned only whether she passes the course, which is the source of just-pass behavior:15
u=
{ 1 if she wins, 0 otherwise.
Effort inputs generate effort cost, denoted by c. The cost function is of the form c= e2
2. (4)
The student selects a level of effort input, e, to maximize her expected net payoff con- ditioned on her own information set. In a mathematical formulation, the optimization problem for the student is
Maximize U(e)≡E[u−c], subject to (2),(4), e≥0.
For simple expressions, we set B =b and normalize S0E = 1 anda = 1.16
Equilibrium Substituting (2) and (3) into (1) and rearranging it, we reduce the con- dition for winning to
A≤A(e),ˆ
where ˆA(e) =s0e+ (s0−S0). Given her own effort level e, ˆA(e) represents the maximal productivity of the rival with which the student can win the tournament. Given the rival’s productivity A is uncertain, the student has to control ˆA(e) by incorporating the degree of uncertainty, ε, and effort cost.
15This zero–one payoff is a variant of the ordinal tournament structure in Hammond and Zheng (2013).
The reward system in our experiment is a tournament because of the relative evaluation of students. Of course, in reality, some students will attempt to obtain the best grade possible. However, in general, the reward is discretized into a set of some values in relative grading. Thus, we can locally approximate the reward system using the zero–one payoff structure. To keep the model simple and to understand better the role of a borderline as clearly as possible, we assume this preference relation.
16Although we obtain the same theoretical results without these parameter constraints, it requires some complicated algebra.
Through simple calculations, we obtain the functional form of U:
U(e) =
−e22 if 0≤e < e
¯,
(s0−S0)−(1−ε)
2ε +s2ε0e− e22 if e
¯≤e <e,¯ 1− e22 if e≥¯e, wheree
¯≡ 1−ε−(ss00−S0) and ¯e≡ 1+ε−(ss00−S0).17 Fore < e
¯, the student deterministically loses and only incurs the effort cost. Fore
¯≤e <¯e, it is probabilistic whether the student wins.
Therefore, she weighs the expected gain of winning and the effort cost. For e ≥ ¯e, she necessarily wins. Note that the thresholds decrease in the midterm examination score:
∂e
∂s¯0 <0, ∂s∂¯e
0 <0. Because the midterm examination score is her own initial condition for preparing for the final examination, the reduced payoff function depends on it, as does the student’s optimal choice.
We adopt the following assumption to focus on the solution most relevant for the empirical analysis.
Assumption. Uncertainty for students is sufficiently strong:
ε ≥ε
¯, where ε
¯ = 1+S4 0.18
If ε is small, then each student selects either a zero or minimal input for passing the examination regardless ofs0. This is because students can deterministically control their grades because of weak uncertainty and hence weigh the certain benefits of qualification and the required effort costs. In contrast, ifεis sufficiently large, then students cannot do this when their scores in the midterm examination are of an intermediate value. Because the latter case is relevant for the experimental results, we adopt this assumption to rule out the former irrelevant case.19
17See Appendix A for the derivation.
18We also assumeS0<3 to ensureε
¯<1.
19Strictly speaking, we need assume onlyε >(√
2−1)2(1 +S0), which is implied by the assumption, to ensure that the following proposition holds, as explained in the proof. However, we adopt the assumption to obtain one of the main results for the comparative statics, Result 1, in Section 4.2.
Proposition. Let s0
¯ = 2
[−ε+√
(1 +S0)ε ]
and s¯0 =−ε+√
ε2+ 2ε(1 +ε+S0). In equilibrium, the optimum e∗ is characterized by
e∗ =
0 if s0 < s0
¯ ,
s0
2ε if s0
¯ ≤s0 <s¯0,
1+ε−(s0−S0)
s0 if s0 ≥s¯0, and continuous with respect to s0 at s¯0.
Proof See Appendix B.
The intuition underlying the proposition is as follows. If the student obtains a low score in the midterm examination (that is, s0 < s0
¯), she will make no effort because an unacceptably large effort is required in the final examination to pass the course. In the intermediate case (that is, s0
¯ ≤ s0 < s¯0), the student selects the inner solution as a means of balancing the uncertain benefit and certain cost. In this case, the student cannot predict with certainty the result of the final examination. Finally, if her score in the midterm examination is sufficiently high (that is, s0 ≥s¯0), the student will minimize her effort under the constraint of a passing score because this can be at a small effort cost. This case captures the just-pass behavior. In this case, the higher the midterm scores the student receives, the less effort she puts into the final examination.
4.2 Empirical Implication
We focus on the relationship between uncertainty and the final examination score, s∗ ≡ b+s0e∗. For clarity, we divide the distribution of the students into three classes according to the forms of equilibrium behavior, e∗: A student with midterm score s0 belongs to class L if s0 < s0
¯, class M if s0
¯ ≤s0 <s¯0, or class H if s0 ≥s¯0. Decreasing uncertainty has two distinct effects. One is to prompt some students to transfer to other classes, and the other is to make a difference in the equilibrium effort input of the students remaining in the same class.
Transferring Effect Let us first examine the effect of decreasing uncertainty on the thresholds of the classes, s0
¯ and ¯s0, defined in the proposition. The student withs0 can
move from one class to another after ε changes. Given the assumption, we obtain the following:20
−∂s0
∂ε¯ ≥0, (5)
−∂s¯0
∂ε <0. (6)
By (5), decreasing uncertainty raises the threshold between classLandM, which implies that the region of classLspreads. This is because classM students near the lower thresh- old s0
¯ recognize the small possibility of passing by information provision and cease the input of effort. In addition, a decrease in uncertainty enlarges classH by (6). Intuitively, class M students around the upper threshold ¯s0 find that they can pass the course with certainty with an acceptable degree of effort input.
As an implication for practice, we can state the following result.
Result 1 Decreasing uncertainty expands the class of students who abandon the course and who exhibit just-pass behavior. In particular, the former implies that the observed final score of students with relatively lower midterm score is lower because some students’
scores jump into the minimal level by giving up the final examination.
Stimulating and Dampening Effect Next, we consider the second effect of a decrease in uncertainty. Suppose that the student withs0 remains in the same class afterεchanges.
Then, given the equilibrium marginal effect of an increase in uncertainty, sign
{∂s∗
∂ε }
= sign {∂e∗
∂ε }
holds according to the student’s production function. Immediately from the proposition, we obtain the relationship between the degree of uncertainty and the final examination score.
Result 2 A marginal decrease in the degree of uncertainty improves the final examination scores of students with intermediate scores in the midterm examination. However, this exerts a detrimental effect on the final examination scores for students with high scores in the midterm examination.
20A derivation is provided in Appendix C.
Result 2 demonstrates that the effects of information feedback on the final examina- tion scores vary according to the range of midterm examination scores. In particular, the information feedback has positive (negative) effects for students with intermediate (high) midterm scores. Greater transparency thus encourages students with intermediate scores in the midterm examination. This is because it reduces the risk of a fail in the final examination and therefore induces them to increase their required effort to achieve a passing score. However, decreasing uncertainty through information provision also ex- pands the opportunity for students with high scores to economize on the required level of effort to pass the final examination. This possibly amplifies student just-pass behavior.
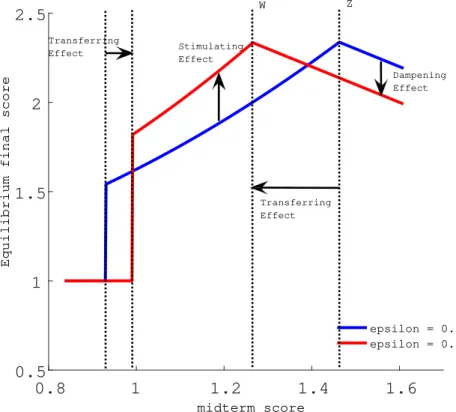
For information, we visualize a decomposition of the two above effects using a numeri- cal example. Figure 1 illustrates the case whereb=S0 = 1 andεchanges from 0.8 to 0.6.
This illustrates a hump-shaped relationship between the midterm and equilibrium final scores. ClassesLandHexpand with the decrease in uncertainty, which corresponds with the transferring effect. For a sufficiently high and genuinely intermediate s0, decreasing uncertainty has only the dampening and stimulating effect, respectively. These are the assertions of Result 2. For every student who remains in the same class, the total effect simply coincides with the stimulating or dampening effect. However, it is more compli- cated for students who transfer from class M to H. In the right neighborhood of the latter threshold (the dotted line W in Figure 1), the total effect is positive because the positive transferring effect accompanied by the stimulating effect for class M dominates the saving of effort input by the just-pass behavior. We interpret this as a stimulation of just-pass behavior with certain success. Conversely, the total effect is negative in the left neighborhood of the former threshold (the dotted line Z in Figure 1) because of the strong reduction in effort input. In contrast, for students who transfer from class M to L, the total effect is necessarily negative. This is because there is neither a stimulating nor dampening effect within class L and the transferring effect is negative. Intuitively, information provision discourages marginal students and encourages them to give up.
[Insert Figure 1 here]
Testable Hypotheses If a student does not have information on the potential ability of her rival, she has to consider the possibility that her rival’s potential ability is much higher or lower than her own. That is, the variance of her subjective distribution of the
rival’s ability is high. On the other hand, if she has some information on the potential ability of her rival as in our experiment, she can narrow the distribution of the potential ability of the rival. Therefore, we argue that students in the control group have a smaller ε than students in the treatment group.
According to Results 1, 2, and Figure 1, the predicted relationships between the midterm and final scores are as follows. For students whose midterm scores are suffi- ciently low or high, the more precise the information on relative ability, the lower the final scores students achieve. Conversely, for students whose midterm scores are interme- diate, the more precise the information on relative ability, the higher the final scores the students achieve. In interpreting the experimental results, we draw on these theoretical predictions.
5 Estimation Model and Results
5.1 Estimation Model
Students in the treatment group have information about both their own midterm scores and rank, whereas students in the control group have information only on their own midterm scores. That is, the students in the treatment group have more precise informa- tion on relative ability than do students in the control group. Thus, from a theoretical point of view, theε of students in the treatment group is lower than the ε of students in the control group. According to Results 1, 2, and Figure 1, for students whose midterm scores are sufficiently low or high, the students in the control group tend to achieve higher scores than those in the treatment group. In contrast, for students whose midterm scores are intermediate, the students in the control group tend to achieve lower scores than those in the treatment group. To confirm this theoretical prediction, we use a quadratic specification.
We employ the following empirical framework:
YF i=α(
YM i2 /100×Di)
+β(YM i×Di) +γDi+θYM i2 /100 +ϕYM i+Xiδ+ϵi, (7) whereYF i andYM idenote the respective scores in the final and the midterm examinations for student i, YM i2 /100 is the squared midterm score for student i, divided by 100. Di
is a dummy variable equal to one if student i is given information on her relative rank in the midterm examination (i.e., the student is in the treatment group), and zero if
student i is not given this information (i.e., in the control group). YM i2 /100×Di and YM i×Di are interaction terms for both variables.21 The vector Xi contains the student characteristics, including the final scores for Economics I, the Pretest of Mathematics, the number of homework submissions, dummy variables for male students and students in different classrooms, and a constant term. ϵi are disturbances, which we assume are distributed N(0, σ2).
The coefficients upon which we focus areαandβ, which are the estimated coefficients for the interaction terms. These coefficients enable us to determine whether the impact of information on a student’s relative rank in the midterm examination and the improvement (if any) in the final examination score vary in accordance with the midterm examination score.22
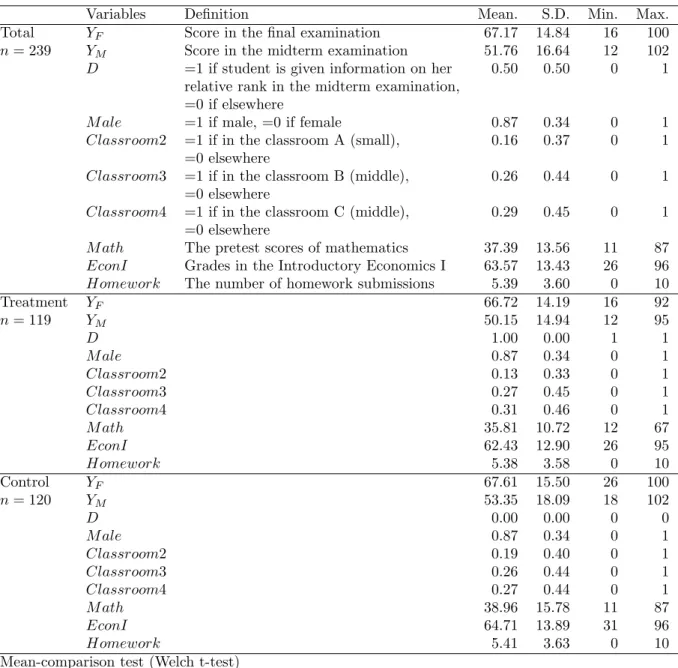
5.2 Descriptive Statistics
Comparing the mean scores in the midterm examinationYM for the control and treatment groups in Table 1, the means (standard deviations) for the control and treatment groups are 53.35 (18.09) and 50.15 (14.94), respectively. However, we fail to reject the null hypothesis that “the mean values of the two groups are not different” (Welch’s t-test:
p-value is 0.14).
[Insert Table 1 here]
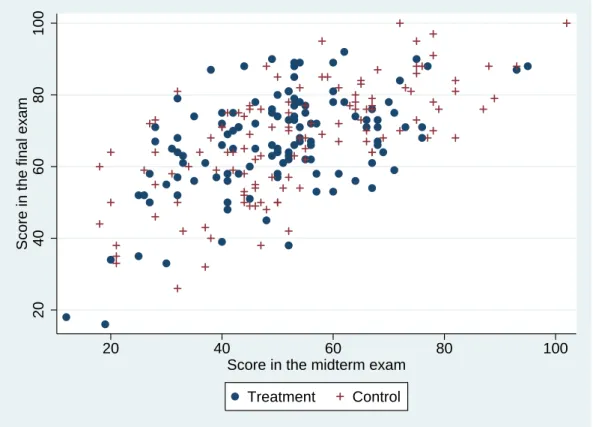
To visualize the relationship between the midterm and final examination scores, we show a scatterplot for the control and treatment groups in Figure 2. We can see that improvements in the final examination scores depend on the range of midterm exami- nation scores. For example, students in the control group with a score of 60 or more in the midterm examination tend to obtain higher scores in the final examination than comparable students in the treatment group. Moreover, control group students with a midterm examination score of less than 30 show greater improvement in their final ex- amination scores than do students in the treatment group. These observations suggest
21As Barnett et al. (2005) argue, randomized experiments can reduce the effect of the regression to the mean (RTM). As the responses from both the control and treatment groups are equally affected by RTM, the differences between the treatment group and the control group, that is, the coefficients forDi
and the interaction terms, comprise the treatment effect after adjusting for the RTM.
22All regression results reported in this section are estimated using STATA version 14.
that the impact of information on a student’s relative rank in the midterm examination on the extent of improvement in the final examination varies according to the midterm examination score.
[Insert Figure 2 here]
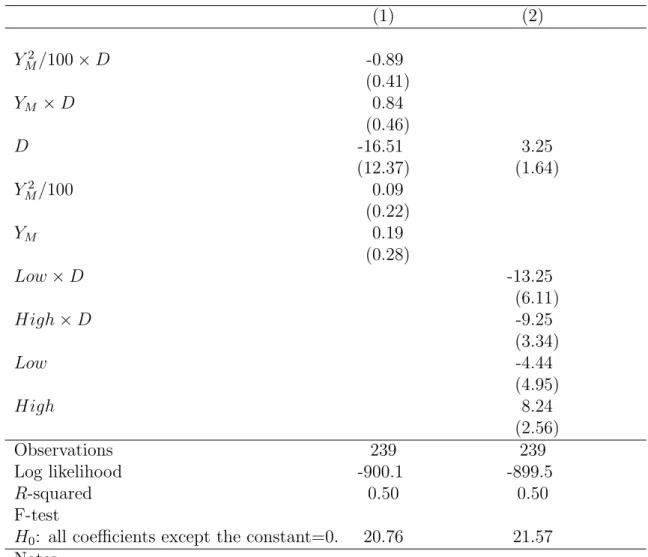
5.3 Estimation Results
The estimation results following Equation (7) are shown in Column (1) in Table 2. The coefficient for YM i2 /100×Di is significantly negative and the coefficients for YM i×Di are significantly positive. This indicates that the impact of information on the student’s relative performance in the midterm examination on the final score varies according to the midterm score. That is, relative performance information feedback on the midterm examination exerts asymmetric effects on the final scores for the control and treatment groups.23
One point to note is that we excluded from our sample the 5% of students who took the midterm examination and received a letter, but who did not subsequently sit the final examination. The average score for these students in the midterm examination was 28.7, suggesting that sample attrition correlates with lower scores in the midterm examination.
However, among these students, the average midterm score in the treatment group was 29.3, while that in the control group was 28.4. As for the average midterm score, we cannot readily observe a distinct difference between the two groups.
[Insert Table 2 here]
We calculate the fitted values of the final score, categorized by the control and treat- ment groups, using the estimated coefficients of the variables in Column (1) of Table 2. As shown in Figure 3, we clearly see that for students with intermediate midterm scores (scores between 28 and 67), the more precise the relative performance information provided, the higher the score in the final examination. In contrast, for students with relatively high scores in the midterm examination, those in the treatment group obtained lower scores in the final examination than those in the control group.
23When we exclude students whose scores in the midterm examination are more two standard devia- tions from the mean from our analysis as potential outliers, the estimation results are almost identical to those shown in Column (1).
[Insert Figure 3 here]
To confirm whether these results are robust, we identify three groups corresponding to students with low (less than 28), intermediate (between 28 and 67), and high (68 and above) scores in the midterm examination, and examine whether the impact of relative performance information feedback on the final examination differs between these groups.
If the impact of the relative performance information feedback depends on the midterm score, we should be able to observe a varying impact between these groups. The estima- tion results are shown in Column (2) of Table 2. For the intermediate midterm scores group, relative performance information feedback has a significantly positive effect on the final examination scores (the coefficient for D is 3.25). This indicates that for students with an intermediate midterm score, information about their relative performance in the midterm examination improved their score in the final examination.
In contrast, relative performance information feedback has a significantly negative effect on the final examination scores for the high midterm examination scores group.
The magnitude of the coefficient for High is 8.24, while the magnitude of the coefficient for (1 +High)×D is −6.00 (= −9.25 + 3.25), which is statistically significant (f-value is 4.01). That is, for students with high midterm examination scores, on average, the final examination scores among the treatment group are 14.24 points significantly lower than those among the control group (f-value is 8.24). For students with low scores in the midterm examination, the magnitude of the coefficient for (1 +Low)×D is −10.00 (= −13.25 + 3.25), which is statistically significant (f-value is 2.88), but there are no significant differences in the final examination scores between the treatment and control groups (f-value is 0.31). For students with high scores in the midterm examination, infor- mation on their relative performance in the course could reduce their incentive to study for the final examination. In other words, relative performance information discourages student incentives to study given just-pass behavior. On the other hand, there is no clear difference between the control and treatment groups with low scores in the midterm ex- amination. This is somewhat expected because according to the theoretical model, some of the students in both groups belong to class L, in which students exert no effort and accordingly receive a minimal score.
In terms of other research considerations, similar to the experimental design employed by Tran and Zeckhauser (2012), we divided students into control and treatment groups