Discussion Paper Series
Graduate School of Economics and School of Economics Meisei University
Hodokubo 2-1-1, Hino, Tokyo 191-8506 School of Economics, Meisei University
Phone: +81-(0)42-591-9479 Fax: +81-(0)42-599-3024 URL: https://keizai.meisei-u.ac.jp/econ/
Discussion Paper Series, No.40 July, 2018
Information Feedback in Relative Grading: Evidence from a Field Experiment
Shinya Kajitani
(Kyoto Sangyo University)
Keiichi Morimoto
(Meisei University)
Shiba Suzuki (Seikei University)
Information Feedback in Relative Grading:
Evidence from a Field Experiment
Shinya Kajitani
∗Keiichi Morimoto
†Shiba Suzuki
‡July 3, 2018
Abstract
The impact of relative performance information feedback could vary according to each stu- dent’s previous examination performance. Binary grade environments enable us to identify the heterogeneous impacts of this feedback. Conducting a randomized control trial employing a compulsory course in economics at a Japanese university, we show the heterogeneous impacts of relative performance information feedback attributable to the students’ earlier examination scores under a binary grade environment. Our experimental results prove that previous per- formance information feedback improves the performance of students with only intermediate scores but worsens the performance of high-scoring students in their next examination.
Keywords: Education; experiments; relative performance information feedback; rel- ative grading.
JEL Classification: D81, I21
∗Corresponding author. Associate Professor, Faculty of Economics, Kyoto Sangyo University, Mo- toyama, Kamigamo, Kita-ku, Kyoto-city 603-8555, Japan. Phone number: +81-75-705-1739. E-mail address: [email protected]
†Associate Professor, Department of Economics, Meisei University, 2-1-1, Hodokubo, Hino-city, Tokyo 191-8506, Japan. Phone number: +81-42-591-6964. E-mail address: [email protected]
‡Associate Professor, Faculty of Economics, Seikei University, 3-3-1, Kichijoji-kitamachi, Musashino-city, Tokyo 180-8633, Japan. Phone number: +81-422-37-3571. E-mail address:
I Introduction
How does relative performance information feedback affect the incentive of students to study for multiple examinations in a relative grading environment? Many consider in- formation feedback associated with a reward scheme as an efficient way of eliciting the incentives of students to study. Further, “relative grading” or “grading on a curve”
is widely used in grading students, although its use remains controversial.1 In relative grading, student grades depend on their positions in the class score distribution. To understand student incentives in a relative grading scheme, Becker and Rosen (1992) extend the rank-order tournament model of Lazear and Rosen (1981) to emphasize the importance of a student’s position in the distribution of academic attainment and show that competition between students indeed stimulates learning effort. This suggests that relative performance information feedback affects student decision-making in providing effort. In addition, in actual schooling environments, students are graded using multiple examinations. It is then worth considering the relationship between information on a stu- dent’s relative position in the distribution of earlier examination scores and the student’s incentive to provide study effort for the following examination.2
The impact of relative performance information feedback may vary according to each student’s previous examination performance. In a relative grading scheme, a student needs to receive a higher score than her opponent to obtain a better grade. That is, an opponent’s score serves as a threshold she must exceed. In this grading environment, the relative performance information feedback is then a signal of the effort she should provide. For example, when relative performance information feedback tells the student her current score is relatively low, she understands that she has to provide a higher level of effort to get above the threshold. Conversely, she may give up, saving the cost of effort. In a multiple examinations environment, for students with relatively low marks in the previous examination, relative performance information serves as a signal that they will need to work harder for the next examination to obtain a better grade. In contrast, for students with sufficiently high marks in the previous examination, relative
1Volokh (2015) argues that teachers appreciate relative grading as a means to control grade inflation and to ensure students have an opportunity to receive a higher grade, even if the examinations make it difficult to obtain high marks. Conversely, Grant (2016) points out that relative grading can be problematic in that it prevents students from collaborating owing to the overly competitive environment.
2Aoyagi (2010) and Ederer (2010) theoretically analyze information feedback in a dynamic tournament context.
performance information may be a signal that they can slack off. Therefore, the impact of relative performance information feedback varies according to each student’s previous examination performance. That is, there are heterogeneous impacts associated with previous examination performance.
Binary grade environments, such that only a pass or fail matters, enable us to iden- tify the heterogeneous impacts of the relative performance information feedback on the students’ incentive to study according to their previous examination performance. In most academic courses, there are multiple grades, such as A, B, C, D, and F, such that when a student is above the threshold between B and C, she is also below the threshold between A and B. Suppose that the relative performance information feedback has a positive impact on students above the threshold but negative impacts on students below the threshold. That is, the negative aspects of relative performance feedback may can- cel out its positive aspects on a given student’s incentive to study. In contrast, under binary grade environments, we can accurately identify the effect of relative performance information feedback on the student’s incentive to study.3
Conducting a randomized control trial employing a compulsory course in economics at a Japanese university, this paper identifies the heterogeneous impacts of relative per- formance information feedback due to the students’ midterm scores. As explained later, empirical and anecdotal evidence concerning both the university advancement rate and labor markets in Japan suggest that students care only about whether they can pass the course. In our experiment, students receive relative grades using the results of their midterm and final examinations. Given the students are aware of this situation, we can indeed identify the impact of relative performance information feedback in a binary grade environment. We allocated more than 200 students into a control group and a treatment group immediately following the midterm examination. We only provided rel- ative performance information feedback to students in the treatment group and explored the impact of this feedback on student performance in the final examination. We then constructed a simple theoretical model of binary grading to clarify the impact of the rel-
3Binary grade environments are themselves of some practical importance. For instance, some argue that there is grading on a curve in bar examinations in some US states (Stenson, 2017). For example, the Massachusetts Court System states that “A Final Total Scale Score of 270 or greater is required to pass the Massachusetts Bar Examination” (Massachusetts Court System, 2017). In calculating scale scores, there is also sometimes an adjustment of raw scores to account for variations in the level of difficulty of an examination over time.
ative performance information feedback on the student’s incentive where there are many participants. Subsequently, using data from the field experiment, we demonstrated that for students with sufficiently high marks in the midterm examination, students in the treatment group tended to receive lower scores in the final examination than students in the control group. In contrast, for students with intermediate marks in the midterm examination, students in the treatment group tended to earn higher scores in the final examination than students in the control group. These findings are almost consistent with our simple theoretical model.
To our knowledge, this paper is the first attempt to investigate the impact of relative performance information feedback on student incentives to study in an actual educational environment encompassing relative grading. The remainder of the paper is organized as follows. Section II relates the analysis to the existing literature and Section III describes the experimental design. Section IV details the theoretical tournament model and pro- vides the testable hypothesis. Section V presents the empirical framework and reports the estimation results. Section VI concludes.
II Background
Revealing the role of relative performance information feedback in providing agent in- centives is often through laboratory experiments. Existing research demonstrates that relative performance information feedback can have both a positive and a negative im- pact on the agent’s effort provision. For instance, Azmat and Iriberri (2016) and Gill et al. (2018) conduct a laboratory experiment to examine the impact of relative per- formance information feedback on the subjects’ performance when rewards are absolute, but independent of the other subjects’ performance. In particular, Gill et al. (2018) find that the rank-response function is U-shaped, that is, subjects increase their effort most in response to relative performance information feedback when they are ranked first or last.
On the other hand, Eriksson et al. (2009), Freeman and Gelber (2010), and Ludwig and L¨unser (2012) conduct laboratory experiments to explore the impact of relative perfor- mance information feedback on agent performance when subjects are rewarded relatively.
Eriksson et al. (2009) and Freeman and Gelber (2010) conclude that relative performance information feedback lowers the performance of subjects whose interim performance is relatively low. However, those subjects whose midterm performance is relatively high do
not slacken off. In contrast, Ludwig and L¨unser (2012) examine the effects of effort infor- mation in a two-stage rank-order tournament. They demonstrate that subjects who lead tend to lower their effort, but those who lag increase it relative to the first stage, while the subjects who lead exert a greater effort than those who lag. These results suggest that the impact of relative performance information feedback should vary according to the subjects’ initial level of attainment in our relative grading framework.
Information feedback is also a subject of investigation in actual educational decision- making.4 Azmat and Iriberri (2010), using data from Spanish high schools, and Tran and Zeckhauser (2012), in a field experiment of Vietnamese university students, demonstrate that relative performance information feedback raises the performance of students when they are rewarded absolutely. Both these studies argue that if students have competitive preferences, which means that they inherently prefer receiving a higher rank than others, relative performance information has a positive impact on their incentive to study, even if the information is intangible in the reward scheme. Bandiera et al. (2015) employ a sample of students rewarded absolutely in a UK graduate school and demonstrate that absolute (but not relative) performance information feedback improves the performance of students whose midterm performance is high, which the authors relate to knowledge of the educational production function. These findings imply that relative performance information feedback may have a substantial impact on student performance, even in our relative grading setup. However, there has been no examination of the impact of relative performance information feedback on student incentives under relative grading in an actual education environment.
Relative rewarding and grading on a curve are themselves worth considering because existing research demonstrates that relative grading in particular has an empirically de- batable impact on student performance.5 For example, Ashraf et al. (2014) conduct a field experiment in Zambia’s health assistant-training program. In their experiment,
4De Paola and Scoppa (2011) conduct a field experiment in an Italian university to prove that students taking midterm and final examinations obtain higher scores than students taking only final examinations, the difference being that the former receive information on the midterm performance.
5From a theoretical viewpoint, Becker and Rosen (1992) employ a rank-order tournament model to analyze student incentives to study an educational environment. Dubey and Geanakoplos (2010) compare absolute grading and relative grading, while Paredes (2016) constructs a theoretical model of relative grading employing an all-pay auction. In addition, Andreoni and Brownback (2017) undertake a laboratory experiment to relate an increase in the number of enrollments in an all-pay auction to a decrease in the uncertainty of the threshold needed to pass in a tournament.
student rewards are absolute, with some students advised they will receive a rank-related reward. The authors conclude that the performance of students whose initial achievement level is relatively low is significantly lower when told that they will receive a rank-related reward. In contrast, Jalava et al. (2015) conduct a field experiment in Swedish primary schools to compare schemes with several types of reward and find that student perfor- mance is higher when rewarded relatively. Czibor et al. (2014) conduct a field experiment in a Dutch university and compare relative and absolute grading. They find that moti- vated male students rewarded relatively tend to obtain higher performance than students rewarded absolutely. However, both female and male students are largely unaffected by the reward scheme. On this basis, Czibor et al. (2014) contend that rank incentives are weak if students adopt just-pass behavior. That is, if students only care about whether they can pass the course or not, they will not want to provide effort for any higher rank than that to which they aspired. Even if graded relatively, relative performance informa- tion feedback may exert different impacts on student incentives to study depending on their attitude toward getting higher grades.
As explained earlier, by considering students who care only about whether they can pass the course enables us to identify the impact of relative performance information feedback unrelative grading in a binary grading environment. As also discussed, most university students in Japan only care about whether they can pass the course. The School Basic Survey, which is conducted by the Ministry of Education, Culture, Sports, Science and Technology in Japan, shows that the university advancement rate was about 50% in 2017, whereas it was less than 20% in 1990. Increasing the university advancement rate in Japan could reflect demand-side forces that lead to greater incentives to pursue university education. Most Japanese firms distinguish between new college graduates and other job seekers, in the sense that many vacancies for regular full-time jobs explicitly target the former (Genda et al., 2010). Moreover, Lise et al. (2014) show that the wage premium for education, as measured by the ratio of mean wages for college-educated full-time workers to less-than-college-educated full-time workers, has tended to increase in Japan since 2000. Interestingly, while the admission process to prestigious Japanese universities is competitive, credit standards in college courses are low (Abe 2002). That is, hard work is not generally needed for graduation.6 The hiring policy of many Japanese
6Kaji (2015) notes that a nontrivial proportion of students in Japanese universities eschew classes that demand serious reading and homework, instead preferring classes in which they will easily earn a
firms also discourages students from studying hard to obtain better grades. For example, before 2013, most Japanese firms did not consider a student’s grade point average (GPA) when seeking recruits in the labor market for new graduates.7 Taken together, the high college wage premium, the low credit standards in college courses, and recruitment poli- cies in new graduate labor markets that ignore student GPAs, may result in students caring only about whether they can pass the course, and so they attempt to pass their courses with minimal effort cost.
This background contextualizes our research question. Does relative performance information feedback improve student examination scores under a relative grading scheme in a binary grading environment? To examine this, we conduct a field experiment to investigate relative performance information feedback in a relative grading scheme.
III Experimental Design
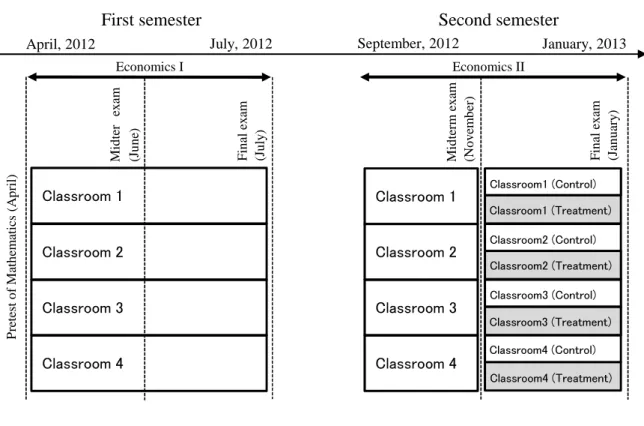
Description of a randomized trial This section provides the details of a randomized trial, which was performed using first-year students in an economics department at a Japanese private university. We begin by describing the flow of interventions in the experiments, which are displayed in Figure 1. The academic year comprised first and second semesters. The first semester began in April 2012 and ended in July 2012. The second semester began in September 2012 and ended in January 2013. We conducted a mathematical achievement test (referred to as the Pretest of Mathematics) immediately following university entrance. Students were enrolled in two compulsory introductory economics courses in their first year: Economics I in first semester and Economics II in second semester. In Economics I and II, we administered midterm and final examinations to grade students. While the midterm and final examinations in Economics I were in May and July 2012, those in Economics II were in November 2012 and January 2013. We note that the score for the Pretest of Mathematics was independent of the grades for Economics I and II. The dotted vertical lines in Figure 1 represent the timing of the examinations.
[Insert Figure 1 here]
credit (raku-tan) and seeking off-campus experiences.
7According to the Nihon Keizai Shinbun (in Japanese), the reason for this is that most firms con- sidered the GPA an unreliable indicator of student attainment. Because each university has its own grading guidelines, firms also cannot account for the difference in GPA between one university and another (Nihon Keizai Shinbun, December 8, 2013).
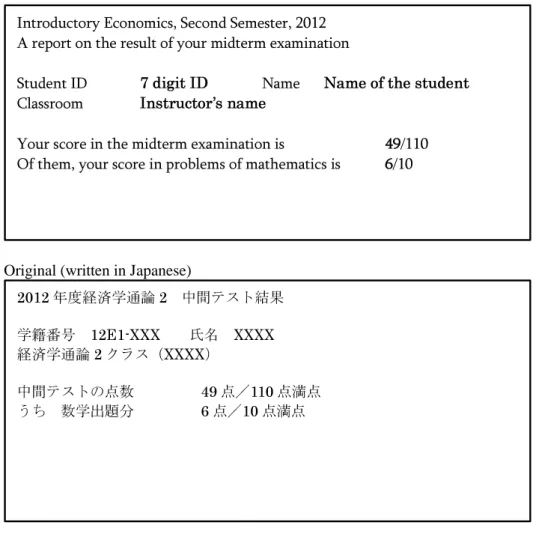
We conducted our randomized control trial immediately after the midterm exami- nation in Economics II and randomly assigned all students to the treatment or control group. Following the midterm examination, we gave letters to students revealing their score for the midterm examination, delivered to them in person during class time. In addition, the letters given to students in the treatment group also reported their ranks in the midterm examination. We did not include this information in the letters to the stu- dents in the control group. The student letter content is similar to that used by Ashraf et al. (2014). Figures 4 and 5 in Appendix C reproduce the information provided to the students in the treatment and control groups. On this basis, while students in the treatment group knew their precise rank, students in the control group would only have a vague awareness.
Because of the Pretest of Mathematics, we can focus only on those students who care about whether they can pass the course, although some students are also eager to get a better grade. We divided students into four classes according to their score in the Pretest of Mathematics. We regard students who mark higher in the Pretest of Mathematics as students who are willing to get a better grade as the score is independent of their grades.
In particular, we placed all students with a top-40 score in the one small class. Hereafter, we refer to this as Classroom 1. We then randomly allocated the remaining students to the other three classes. Hereafter, we refer to these as Classrooms 2, 3, and 4. We regard students in Classroom 1 as those eager to get a better grade, but students in Classrooms 2, 3, and 4 as students who only care about whether they can pass the course. We fixed all class enrollments and instructors across both semesters. However, even though each class had its own instructors, all students took the same examination at the same time.
There are two points to note in our randomized control trial. First, some students did not receive the letter regarding the midterm examination because they were not in class. However, the grade is independent of course attendance, and we later confirmed the robustness of our experimental results with this in mind. Second, some students may have exchanged their rank information. Because our experimental design is similar to that of Tran and Zeckhauser (2012), except for the grading scheme, we share the problem that students in both the control and treatment groups sit in the same classroom, making this exchange of rankings a very real possibility. We discuss this further in Section V.3.
The grading scheme In our experiment, the uncertain threshold plays a crucial role in determining whether students pass the course. In this department, credits for both Economics I and II are required for graduation. Therefore, successfully completing the courses is a primary concern for all students. In both Economics I and II, instructors determine a threshold between pass and failure so that a pass rate is reasonable in the following sense. Officially, the university’s guidelines recommend that the standard “ab- solute” pass score for the course is 60 out of 100. However, if students were to be strictly graded using the guideline, then the number of students who fail the course would fre- quently be inordinately high. Because credits in both Economics I and II are mandatory, a student who fails the course must repeat the course the following year, and for whom there is a separate class. Because the capacity of the repeating class is limited and there is only one classroom, instructors have to adjust the pass scores to obtain “a reasonable”
pass rate.8 For example, in Economics I, the instructors decided the pass rate was the top 87.3% percent of students, and so they set the cutting score at 51 rather than 60.
There are also more than 200 participants, and students compete not only with stu- dents in their own classroom but also the other classrooms. Moreover, the cutting score is common to the four classes. Therefore, whether students pass or fail will depend on their relative position in the score distribution of all students. However, students do not know the exact cutting score in advance of taking their examinations. Our experiment can reveal whether the difference in the precision of their relative performance informa- tion accounts for the difference in final examination scores under a relative grading setup.
Note that students were already aware of this evaluation system. This is because they had already experienced it in Economics I, and the instructors repeated its details again at the beginning of the second semester.9
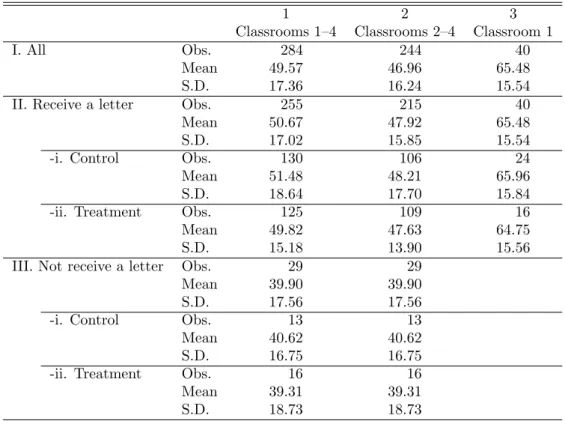
Balance between the control and treatment groups Table 1 provides the total number of students and the means and standard deviations of the midterm examination scores in Economics II for the control and treatment groups. Table 1 also shows how
8Instructors also determine the scores between one grade and another.
9In Economics II, the score calculation was as follows: “40% of the midterm examination score” +
“60% of the final examination score” + “the number of homework submissions” (there were 10 homework assignments each worth one point). Perfect scores for both examinations were 110 points. From the total score of 110 points, 100 points were for the economics part, and the remaining 10 points for basic mathematics.
we randomly divided these students into the control and treatment groups. The total number of students who took the midterm examination amounts to 284 and the mean score is 49.57. We randomly divided these students into control and treatment groups.
However, some students failed to receive the letter. Then, in our experiment, the number of subjects amounts to 255 and the mean score is 50.67. The number of students for the control and treatment groups are 130 and 125, respectively. The mean scores for the control and treatment groups are 51.48 and 49.82, respectively, and there is no significant difference in the mean scores between the control and treatment groups, as shown in row (a) in Panel B.
Although there were students who failed to receive the letter, they were also randomly divided into the treatment and treatment groups. The total number of students who failed to receive the letter amounted to 29 and the mean score is 39.90. The mean score of the students who received the letters is significantly different from that of the students who did not, as shown in row (b) in Panel B. However, the number of students who were assigned to the control group but did not receive the letter amounts to 13 and the mean score is 40.62, while the number of students who were assigned to the treatment group, but did not receive the letter amounts to 16 and the mean score is 39.31. We fail to reject the null hypothesis that “the mean values of these two groups are not different”, as shown in row (c) in Panel B. These results suggest that students who did not receive the letter were also randomly divided into the treatment and treatment groups.
[Insert Table 1 here]
Another point to note is the differences between classrooms. Table 1 also shows that we randomly divided students into the control and treatment groups if we take these differences into account. The mean score in the midterm examination in Classroom 1 is much higher than that in Classrooms 2–4, because students with a top-40 mark in the Pretest of Mathematics were enrolled in Classroom 1. The number of students who received the letter in Classrooms 2–4 is 215, while that in Classroom 1 is 40. The mean for students who received the letter in Classroom 1 is 65.48 and that in Classrooms 2–4 is 47.92. We reject the null hypothesis that “the mean values of the two groups are not different” in row (d) in Panel B. On the other hand, there is no significant difference in the mean scores between the control and treatment groups within Classrooms 2–4.
While the number of students and the mean for the control group are 106 and 48.21,
respectively, those for the treatment group are 109 and 47.63, respectively. We do not reject the null hypothesis that “the mean values of the two groups are not different”, as shown in row (e) in Panel B. In addition, as for Classroom 1, the number of students for the control and treatment groups are 24 and 16, respectively, and the mean scores for the control and treatment groups are 65.96 and 64.75, respectively. We again do not reject the null hypothesis that “the mean values of the two groups are not different”, as shown in row (f) in Panel B.
IV A Theoretical Model
In this section, we construct a simple model in which students choose their effort input under uncertainty to pass the course. As the cutting score depends on the class score distribution in our experiment, strategic interaction among students may play a role in determining the effort input. However, as the number of students is sufficiently large, each student recognizes that a change in her own action makes little difference in the distribution of the scores of all students. We assume that any strategic interaction can be assumed away in the theoretical model. Nonetheless, this simple model helps us understand several key theoretical insights.
Setup Consider a course where the assessment comprises a midterm examination and a final examination. The course grade awarded for each student depends on the final score, which is the sum of the scores obtained in the two examinations: s0+s, where s0 and s are the scores for the midterm and the final examinations, respectively.10 Before the course commences, the cutting score is set to S ∈ R and is known to all students.
However, as previously described, students know that the actual cutting score can change according to the profile of all student final scores to realize a reasonable distribution of student grades. Therefore, S is not a rigorous criterion for course success, rather an approximate standard expected for the cutting score.
Introducing uncertainty in the cutting score, we model this environment as follows. A student with scores0 in the midterm examination then believes that the average required
10We could consider the weighted-average score, ϕs0+ (1−ϕ)s, according to the actual evaluation method, but the basic results do not change.
score in the final examination is equal to11
¯
s≡S−s0,
but the actual cutting score, denoted by ˆs, is a random variable of form ˆ
s=θ¯s, (1)
whereθis a random variable that follows a uniform distribution [1−ε,1+ε] andε∈(0,1).
Following the midterm examination, every student in the class knows their own score s0 ∈R. Each student then makes efforte≥0 in preparing for the final examination, and obtains a score
s=e (2)
in the final examination, but at a cost of c= e2
2. (3)
Finally, we assume that students are concerned only about whether they pass the course.12 For any final examination scores s, the utility of the student is given by
u(s) =
{ 1 if s≥s,ˆ
−1 if s <ˆs.
Equilibrium The students select their level of effort e to maximize their expected utility. Mathematically, the optimization problem for students is
Maximize U(e)≡E[u(s)−c], subject to (2),(3), e≥0.
11When there is no uncertainty in the cutting score, the condition for passing the examination would bes0+s≥S. This is equivalent tos≥s.¯
12The reward system in our experiment is a tournament in the sense students are evaluated relatively.
However, because there are many participants and many winners, we assume that participants do not care about the performance of other participants directly, but rather pay attention to the borderline between winning and losing. Of course, some students will still attempt to obtain the best grade possible.
However, to keep the model simple and to clearly understand the role of the borderline, we assume this preference relation. In the context of tournaments, Aoyagi (2010) and Ederer (2010) theoretically explore the relationship between information feedback and agent incentives.
Through simple calculations, we obtain the functional form of U13:
U(e) =
−1− e22 if 0≤e <(1−ε)¯s,
−1ε +ε¯1se− e22 if (1−ε)¯s≤e <(1 +ε)¯s, 1− e22 if e ≥(1 +ε)¯s.
We adopt the following assumption to focus on the solution most relevant to the empirical analysis.
Assumption. Uncertainty for students is sufficiently strong:
ε > 1 3.
If ε is small, then each student selects either zero or minimal input for passing the examination regardless ofs0. This is because students can deterministically control their grades because of weak uncertainty and hence weigh the certain benefits of qualification and the required effort costs. In contrast, ifεis sufficiently large, then students cannot do this when their scores in the midterm examination are of an intermediate value. Because the latter case is relevant for the experimental results, we adopt this assumption to exclude the former irrelevant case.
Proposition. Let s0
¯ =S−[2ε(1−ε)]−12 and s¯0 =S−[ε(1 +ε)]−12. In equilibrium, the optimum e∗ is characterized by
e∗ =
0 if s0 < s0
¯ ,
1
ε¯s if s0
¯ ≤s0 <s¯0, (1 +ε)¯s if s0 ≥s¯0. Proof. See Appendix B.
The intuition underlying the proposition is as follows. If a student obtains a low score in the midterm examination (that is, s0 < s0
¯), they will make no effort because an unacceptably large effort is required in the final examination to pass the course. In contrast, if their grade in the midterm examination is sufficiently high (that is, s0 ≥s¯0), the student will minimize their effort under the constraint of a cutting score because this
13The derivation is in Appendix A.
can be at a very small effort cost. Finally, in the intermediate case (that is,s0
¯ ≤s0 <s¯0), the student selects the inner solution as a means of balancing the uncertain benefit and certain cost. In this case, the student cannot predict with certainty the result of the final examination. Hereafter, we say students belong to: the lower class if their scores in the midterm examination scores lie within the range of s0 < s0
¯; the middle class if their scores in the midterm examination scores lie within the range of s0
¯ ≤s0 <s¯0; and the upper class if their scores in the midterm examination scores lie within the range of
¯ s0 ≤s0.
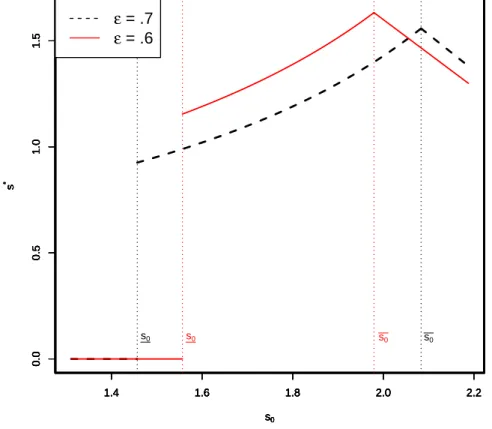
As ¯s is decreasing in s0, we find that e∗ is increasing in [s0
¯,s¯0) and decreasing in [ ¯s0,+∞) with respect tos0. Thus,e∗has a single peak at ¯s0. Figure 2 provides numerical examples of the relationship between s0 and s∗ = e∗, the equilibrium score in the final examination.
[Insert Figure 2 here]
Empirical Implications We focus on the relationship between grading uncertainty and the final examination scores. A change in uncertainty has two effects on the equi- librium final examination score. First, given the classification, information provision changes the equilibrium score: ε¯1s and (1 +ε)¯s. Second, a change in uncertainty affects the thresholds of classification,s0
¯ and ¯s0. In particular, we focus on the upper threshold,
¯
s0. We obtain the following immediately from the proposition.
Result 1 A decrease in the degree of uncertainty improves the final examination scores of students in the middle class (s0
¯ ≤s0 <s¯0). However, this exerts a detrimental effect on the final examination scores for students in the upper class (s0 ≥s¯0).
Result 2 A decrease in the degree of uncertainty lowers the upper threshold, s¯0.
Result 1 demonstrates that the effects of information feedback on the final examina- tion scores vary according to the range of midterm examination scores. In particular, the information feedback has positive (negative) effects for students in the middle (upper) class. Information feedback thus encourages students in the middle class. This is be- cause it reduces the risk of a fail in the final examination and therefore induces them to increase their required effort to achieve a cutting score. However, this also expands the
opportunity for students in the upper class to economize on the required level of effort to pass the final examination. Result 2 shows that information feedback converts some middle classstudents intoupper classstudents. Intuitively, the reason is that information feedback notifies students near the (old) upper threshold so that they can pass the exam with certainty at small cost.
A consequence of information feedback is theoretically ambiguous around the upper threshold. While Figure 2 provides an example in which the total effect is complicated, we evaluate the total effect using the actual experiment.
V Estimation Model and Results
V.1 Estimation Model
From a theoretical point of view, the ε of students in the treatment group is lower than the ε of students in the control group. This is because students in the treatment group have information about both their own midterm scores and rank, whereas students in the control group have information only on their own midterm scores.
According to the proposition and Figure 2, the final score increases as the midterm score increases (decreases) for students whose midterm scores are intermediate (high).
A quadratic specification enables us to capture this relationship. In addition, according to Result 1, for students whose midterm scores are sufficiently high, the students in the control group tend to achieve higher scores than those in the treatment group. In contrast, for students whose midterm scores are intermediate, the students in the control group tend to achieve lower scores than those in the treatment group.
We employ the following empirical framework:
YF i =α (YM i2
100 ×Di )
+β(YM i×Di) +γDi+θYM i2
100 +ϕYM i+Xiδ+ϵi, (4) whereYF i andYM idenote the respective scores in the final and the midterm examinations for student i, Y100M i2 is the squared midterm score for student i, divided by 100. Di is a dummy variable equal to one if studenti is given information on her relative rank in the midterm examination (i.e., the student is in the treatment group), and zero if student i is not given this information (i.e., the student is in the control group). Y100M i2 ×Di and
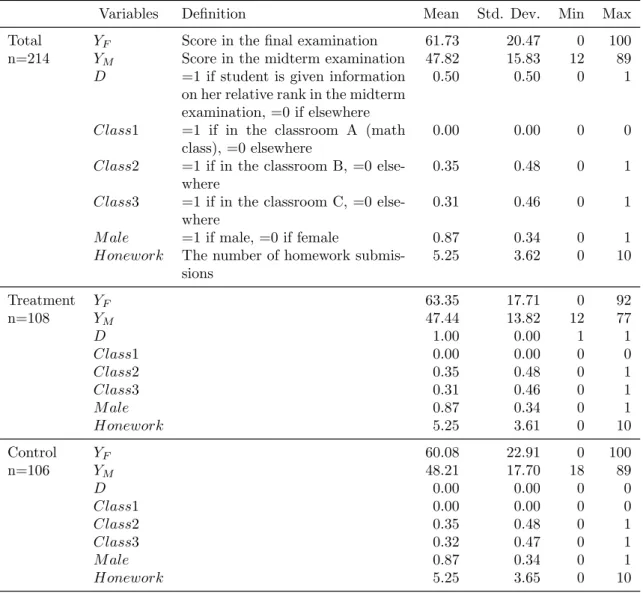
YM i×Di are interaction terms for both variables.14 The vector Xi contains the student characteristics, including the number of homework submissions, dummy variables for male students and students in different classrooms, and a constant term. ϵi are disturbances, which we assume are distributedN(0, σ2). The definitions of all variables in equation (4) are in Table 2.
[Insert Table 2 here]
The coefficients upon which we focus areαandβ, which are the estimated coefficients for the interaction terms. These coefficients enable us to determine whether the impact of information on a student’s relative rank in the midterm examination and the improvement (if any) in the final examination score vary in accordance with the midterm examination score.15
V.2 Descriptive Statistics
In the baseline estimation model, the sample is restricted to students who meet the following criteria: (i) students who received the letter, (ii) students in Classrooms 2–
4, and (iii) students for whom information on all the relevant variables is available.16 Table 2 displays descriptive statistics for all the variables used in the baseline estimation model. Comparing the mean scores in the midterm examination YM for the control and treatment groups, the means (standard deviations) for the control and treatment groups are 48.21 (17.70) and 47.44 (13.82), respectively. We fail to reject the null hypothesis that “the mean values of the two groups are not different”.
To visualize the relationship between the midterm and final examination scores, we provide a scatterplot for the control and treatment groups in Figure 3. We can see that improvements in the final examination scores depended on the range of midterm examination scores. These observations suggest that the impact of information on a student’s relative rank in the midterm examination on the extent of improvement in the final examination varies according to the midterm examination score.
14As Barnett et al. (2005) argue, randomized experiments can reduce the effect of the regression to the mean (RTM). As the responses from both the control and treatment groups are equally affected by the RTM, the differences between the treatment group and the control group, that is, the coefficients for Di and the interaction terms, comprise the treatment effect after adjusting for the RTM.
15All regression results in this section are estimated using Stata version 14.
16We exclude three students who took a makeup examination, whose midterm score was revised, or who made a mistake in writing on their answer sheet from the sample.
[Insert Figure 3 here]
V.3 Estimation Results
V.3.1 The quadratic specifications
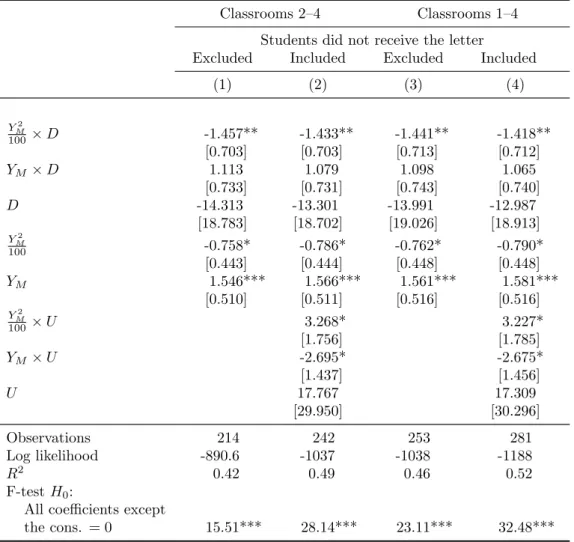
The estimation results in Table 3 demonstrate that the final score is an inverted U-shaped function of the mid score, which is consistent with the proposition. The estimation results for the baseline model (equation (4)) are in column (1). The coefficient for Y100M2 is significantly negative (θ =−0.758) and the coefficient for YM is significantly positive (ϕ= 1.546). These values indicate that for students in the control group, the final score is an inverted U-shaped function of the mid score. Holding everything else constant, it is easy to see that the value of the final scores are maximized, that is, the upper threshold, when YM∗ = −50ϕθ for the control group and YM∗ = −50(β+ϕ)α+θ for the treatment group, respectively. Because the value of the upper thresholdYM∗ for the control group is 101.98, the upper classcannot be observed in the control group. That is, students who receive a higher midterm score tend to get a higher final score regardless of their midterm score.
On the other hand, the coefficient for Y100M2 ×D is significantly negative (α=−1.457) and the coefficient for YM ×D is positive (β = 1.113). The value of the upper threshold YM∗ for the treatment group is 60.03. These values indicate that for the students in the treatment group, the final score is also an inverted U-shaped function of the mid score.
The students whose midterm score is lower (higher) than 60 in the treatment group are theoretically classified as the middle (upper)class.17
[Insert Table 3 here]
We calculate the fitted values of the final score, categorized by the control and treat- ment groups, using the estimated coefficients of the variables in column (1) of Table 3. As shown in Figure 3, we clearly see that for students in the middle class (who scored under approximately 60), the more precise the relative performance information provided, the higher the score in the final examination. In contrast, for students with relatively high scores (over approximately 60) in the midterm examination, those in the treatment group obtained lower scores in the final examination than those in the control group.
17When we exclude students whose scores in the midterm examination are more than two standard deviations from the mean from our analysis as potential outliers, the estimation results are almost identical to those shown in column (1).
The baseline result shown in column (1) is robust even if we consider potential self- selection bias. As discussed in Section III, some students did not receive the letter.
These students were excluded from the baseline estimation result reported in column (1). However, as some students decided not to receive the letter (by not attending class, possibly because they were unwilling to study hard), there is a potential for self-selection bias. To confirm the robustness of the estimation result in column (1), we added students who did not receive the letter into the sample. Ui denotes a dummy variable equal to one if student i did not receive the letter and zero if student i received the letter. Y100M i2 ×Ui and YM i×Ui are interaction terms, respectively. As shown in column (2), the coefficient for Y100M2 is significantly negative and the coefficient for YM is significantly positive. On the other hand, the coefficient for Y100M2 ×Dis significantly negative and the coefficient for YM ×D is positive. These values are quite close to those reported in column (1). These indicate that our baseline result is quite robust, even if we include students who did not receive the letter.
Another question is whether the baseline result is robust when some students are eager to receive a better grade. While most students care only about whether they can pass the course, some students are keen to earn the highest possible grade. As discussed in Section III, we placed all students with a top-40 score in the Pretest of Mathematics in Classroom 1. We consider these students as being motivated compared with students in Classrooms 2, 3, and 4. For this reason, we excluded them from our baseline sample identifying the impact of relative performance information feedback on the incentives of students who only care about whether they can pass the course. To confirm the robustness of our baseline result, we then incorporated the students in Classroom 1 into the sample.18 As reported in column (3), the coefficient for Y100M2 is significantly negative (−0.762) and the coefficient for YM is significantly positive (1.561). Conversely, the coefficient for Y100M2 ×D is significantly negative (−1.441) and the coefficient forYM×Dis positive (1.098). These values are quite close to those reported in column (1). Our baseline result is then quite robust, even when we consider the presence of motivated students. The estimation results reported in column (4) reflect where we added students who did not receive the letter
18We additionally included the following variables into the baseline model (equation (4)); Class1i,
YM i2
100 ×Class1i,YM i×Class1i, Y100M i2 ×Di×Class1i,YM i×Di×Class1i andDi×Class1i. We exclude students whose scores in the midterm examination exceed two standard deviations from the mean as potential outliers in the mathematics class.
into the sample reported in column (3). The estimated coefficients for Y100M2 , YM, Y100M2 ×D, and YM ×D in column (4) are also quite close to those reported in column (1).19
In terms of other research considerations, such as the experimental design employed by Tran and Zeckhauser (2012), we divided students into control and treatment groups within each classroom. Because of this, we cannot discount the possibility that students shared their ranks with their classmates because we are unable to restrict student in- teractions outside the classroom entirely. However, it would be generally difficult for a student in the control group to identify a student in the treatment group with exactly the same score.20 In addition, when students exchange information to determine their own rank, this leads to an underestimation (toward zero) in the estimated treatment effects. If so, our estimated treatment effects—that for students with intermediate (high) midterm examination scores, the more precise the information provided, the higher (lower) their score in the final examination—might be smaller than the true treatment effects.
V.3.2 The heterogeneous impacts due to the students’ midterm scores Based on the results in Table 3, Table 4 investigates the empirical implications from Results 1 and 2, which argue that the relative performance information feedback has heterogeneous impacts due to the students’ midterm scores. Result 1 points out that the relative performance information feedback raises effort for students in the middle class but reduces the effort for students in the upper class. However, Result 2 demonstrates that the threshold between the upperand middle classes decreases because of a decrease in uncertainty. That is, there is a range of midterm scores where students who know their ranks are in the upper class but students who do not are in the middle class. Therefore, the relative performance information feedback has ambiguous effects on these students.
According to the results in Table 3, when the range of midterm scores is lower than 60 (the value of the upper threshold for the treatment group), students in both the control and treatment groups belong to the middle class. For students whose midterm scores are below 60, the relative performance information feedback would then have a positive impact on their performance. In contrast, when the range of midterm scores is over 60,
19One point to note is that the relative performance information feedback has an insignificant impact on the students in Classroom 1. The estimation results are available upon request.
20Further, we also perceive that many Japanese students do not like revealing their grades to friends.
As observed by Benedict (1946), Japan has a long tradition as a shame society where students receiving higher (lower) grades prefer to avoid the envy (derision) of those with lower (higher) grades.
students in the treatment group belong to the upper class, while students in the control group still belong to the middle class. For students whose midterm scores are over 60, the impact of relative performance information feedback on their performance would be ambiguous.
In order to identify the heterogeneous impact of the relative performance information feedback, we consider the following equation:
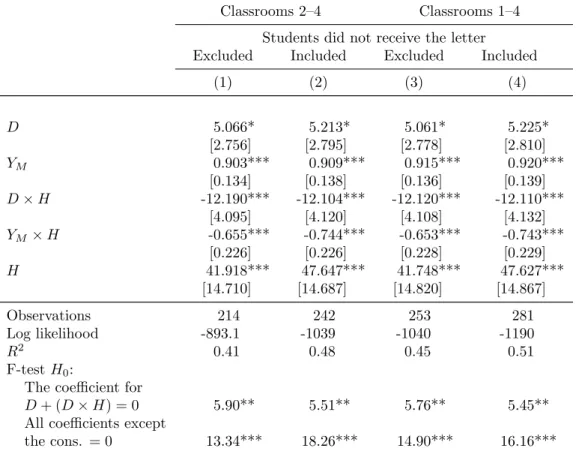
YF i =γDi+ϕYM i+λHi+β(Di×Hi) +ζ(YM i×Hi) +Xiδ+ϵi, (5) whereHi is a dummy variable equal to one if studenti’s midterm score is higher than 60.
Table 4 demonstrates the significance in the relative performance information feedback.
As reported in column (1), the coefficient forDis significantly positive (γ = 5.066). This indicates that the relative performance information feedback has a substantial positive impact on the performance of students whose midterm scores are below 60. In contrast, the coefficient for the interaction terms, D×H, is significantly negative (β =−12.190), and the coefficient for D+ (D×H) is also significantly negative (f-value = 5.90). That is, for students whose midterm scores are over 60, the relative performance information feedback has a negative impact on their performance. In other words, the relative perfor- mance information feedback only exploits the incentive to study of students inthe middle class. By way of contrast, it makes students whose midterm scores are relatively high slacken off.
[Insert Table 4 here]
These empirical results are robust, even if we consider the potential self-selection bias and the presence of students in Classroom 1. As for the potential self-selection bias, we include Ui, YMi ×Ui, Hi ×Ui, and YMi ×Hi ×Ui into the equation (5). As shown in column (2), the coefficient for D is significantly positive (γ = 5.213). In contrast, the coefficient for the interaction terms, D×H, is significantly negative (β =−12.104), and the coefficient forD+ (D×H) is also significantly negative (f-value = 5.51). These values are quite close to those reported in column (1). These indicate that our baseline result is quite robust, even if we consider the students who did not receive the letter. As for the presence of students in Classroom 1, as shown in column (3), the coefficient forD is significantly positive (γ = 5.061).21 In contrast, the coefficient for the interaction terms,
21The model shown in column (3) includes Class1i, Di×Class1i, YM i×Class1i, Hi ×Class1i, Di×Hi×Class1i andYM i×Hi×Class1i into the equation (5).
D×H, is significantly negative (β = −12.120), and the coefficient for D+ (D×H) is also significantly negative (f-value = 5.76). These values are quite close to those reported in column (1). Our result is then quite robust even when we consider the presence of students in Classroom 1. The estimation results reported in column (4) are from the case where we considered both the potential self-selection bias and the presence of students in Classroom 1. The estimated coefficients for D, YM and D×H in column (4) are also quite close to those reported in column (1).
VI Concluding Remarks
Our experimental results demonstrate that relative performance information feedback on final scores has opposing effects depending on a student’s midterm score. For students with average scores in the midterm examination, relative performance information serves as a signal indicating that they will need to work harder to pass the course. In contrast, for students with sufficiently high scores in the midterm examination, relative performance information is a signal that they can pass with only moderate effort.
Our results suggest that the information on relative performance is not necessarily beneficial in incentivizing students to study in the binary grade environments. For stu- dents with intermediate midterm examination scores, it is beneficial to inform them of their performance ranking as a means of decreasing uncertainty. In contrast, for stu- dents with high midterm examination scores, providing their own relative performance information could be detrimental to their overall performance in the course. From an examiner or policy maker perspective, the relative performance information is favorable if examiners prefer encouraging students who lie on the threshold. This is not the case if examiners prefer exploiting the effort of already high-performing students.
We conclude the paper by discussing the prediction for an education environment where there are multiple grades and students are eager to earn their highest possible grade. Our findings suggest that relative performance information feedback may also have a positive impact on the incentive to study here. In multiple threshold environments, a student above the threshold between B and C is also below the threshold between A and B. If students prefer to receive their highest possible grade, the positive aspect of the relative performance feedback always dominates its negative aspect. In this case, relative performance information feedback would always be favorable. It remains to
future research to investigate these predictions.
Appendix A Derivation of the Functional Form of U (e)
For the case of s = e < (1−ε)¯s, students fail the examination for certain. Therefore, U(e) =−1− e22. At the same time, s=e ≥(1−ε)¯s ensures that the students pass the examination, that is, U(e) = 1− e22. If (1−ε)¯s ≤ s = e < (1 +ε)¯s, whether students pass or fail the examination depends on the realized ˆs. Because ˆs≤s =e⇔θ ≤ e¯s,U(e) can be written as follows:
U(e) =
∫ e
¯ s
1−ε
1× 1 2εdθ+
∫ 1+ε
e
¯ s
(−1)× 1
2εdθ− e2 2
= −1 ε + 1
ε¯se− e2 2.
Appendix B Proof of Proposition
Put ˜U(e) = −1ε +ε¯1se− e22. Let ˜e be the unique maximizer of ˜U, ε¯1s. As U is decreasing in [0,(1−ε)¯s) and [(1 +ε)¯s,+∞),U can be maximized only at 0, ˜e or (1 +ε)¯s.
Case 1: e <˜ (1−ε)¯s
In this case, e∗ = 0 because U is decreasing throughout the domain. We obtain that
˜
e <(1−ε)¯s if and only if
s0 < S−[ε(1−ε)]−12 ≡s10. Case 2: (1−ε)¯s ≤˜e <(1 +ε)¯s
The condition (1−ε)¯s≤e <˜ (1 +ε)¯s is equivalent to s10 ≤s0 < S−[ε(1 +ε)]−12 ≡s20.
In this case, e∗ = 0 or ˜e because U is decreasing for e ≥ e. The condition for˜ e∗ = ˜e is U(0)≤U(˜e), which can be reduced to
s0 ≥S−[2ε(1−ε)]−12 ≡s30.
It is obvious that s10 < s30. Besides, s30 < s20 under Assumption 1.
Therefore, e∗ = 0 ifs0 < s30 and e∗ = ˜e if s30 ≤s0 < s20. Case 3: (1 +ε)¯s≤e˜
By Case 2, (1 +ε)¯s≤˜e if and only ifs0 ≥s20. In this case,e∗ = 0 or (1 +ε)¯s because U is increasing in [(1−ε)¯s,(1 +ε)¯s). The condition for e∗ = (1 +ε)¯s isU((1 +ε)¯s)≥U(0) and it is equivalent to
s0 ≥S−2(1 +ε)−1 ≡s40.
By long but straightforward calculations, we find that s40 < s20 under Assumption 1.
Hence, e∗ = (1 +ε)¯s if s0 ≥s20.
In sum, we obtain the characterization of e∗ in Proposition 1 by puttings30 =s0
¯ and s20 = ¯s0 (Q.E.D.)
Appendix C The letters to the students
[Insert Figures 4 and 5 here]
Acknowledgements
We are very grateful to Akira Yamazaki, Kentaro Kobayashi, Hayato Nakata, and Masahiro Watabe for invaluable advice. We also thank Naohito Abe, Kosuke Aoki, David Gill, Tao Gu, Shigeki Kano, Vu Tuan Kai, Jun-Hyung Ko, Akira Miyaoka, Tomoharu Mori, Chang Min Lee, David Reiley, Masao Nagatsuka, Kengo Nutahara, Daniela Puzzello, Kan Takeuchi, and participants at annual meeting on Japanese Economic Association 2013 Spring Meeting (Toyama, Japan), Economic Science Association European meeting 2015 (Heidelberg, Germany), and seminar participants at Osaka University, Seikei University, and the University of Tokyo for their helpful comments. This experiment was approved by the university’s research ethics committee (Application No. H26-002). We have not received financial support for this research from any outside agency or foundation.
References
Abe, Y. (2002). Universities and the entry-level job market: Evidence from Japanese panel data.Labour Economics 9(6): 699–715.
Andreoni, J., and Brownback, A. (2017). All pay auction and group size: Grading on a curve and other applications. Journal of Economic Behavior and Organization, 137:
361-373.
Aoyagi, M. (2010). Information feedback in a dynamic tournament.Games and Economic Behavior 70(2): 242–260.
Ashraf, N., Bandiera, O., and Lee, S. S. (2014). Awards unbundled: Evidence from a natural field experiment.Journal of Economic Behaviorand Organization 100: 44–63.
Azmat, G., and Iriberri, N. (2010). The importance of relative performance feedback information: Evidence from a natural experiment using high school students. Journal of Public Economics 94(7): 435–452.
Azmat, G., and Iriberri, N. (2016). The provision of relative performance feedback: An analysis of performance and satisfaction.Journal of EconomicsandManagement Strat- egy 25(1): 77–110.