A Study of Limited Resources and Security Adaptation in Wireless Sensor Network
著者 ジュマディ マベ パレンレン
著者別表示 Jumadi Mabe Parenreng journal or
publication title
博士論文本文Full 学位授与番号 13301甲第4825号
学位名 博士(工学)
学位授与年月日 2018‑09‑26
URL http://hdl.handle.net/2297/00053072
doi: 10.3390/s18051594
Creative Commons : 表示 ‑ 非営利 ‑ 改変禁止 http://creativecommons.org/licenses/by‑nc‑nd/3.0/deed.ja
i
DISSERTATION
A Study of Limited Resources and Security Adaptation in Wireless Sensor Network
Graduate school of
Natural Science & Technology Kanazawa University
Division of
Electrical Engineering and Computer Science
Student ID: 1524042009
Name: Jumadi Mabe Parenreng
Chief Advisor: Prof. Akio Kitagawa
June, 2018
ii
Acknowledgements
Alhamdulillahi Rabbil ‘Alamin for His belessing to me, so that I am able to finish my dissertation and all achievement in my PhD study at Kanazawa University.
Here, I am very grateful to whom has been contributed directly and indirectly during my study.
First of all, I would like to express my gratitude to my academic supervisor, Professor Akio Kitagawa, for his full support and valuable advice during my PhD study.
Provided me the outstanding environment and material for conducting my research, and as well has supervised me with his high ability, ethic, and work culture. I also would like to express my gratitude to Professor Junichi Akita who has shared his laboratory and has given some fruitful discussion and especially constructive comments at my progress seminar. Also, I thank to all members of MicroElectronic Research Laboratory (MeRL) and Interface Device Laboratory (IfDL), special thanks to Imamura-san for two years being my tutor with friendly.
I am deepest thankful for my parents (Mabe Parenreng-Salma) and my parents in law (Yusuf Baco-Halipa) for spirit support and praying. Most specials, I am grateful to my wife Irmawati Baco, my daughters Adelia Azzahra and Adiva Anindita, my sons Arziki Akira and Akio Othman who has accompanied me through every stage, whose endless encouragement coupled with love has been my source of inspiration and all my Family in Indonesia.
I am very grateful to DIKTI (Indonesian Directorate Higher Education Ministry of Education and Culture) which has funded this study as a whole, Kanazawa University and KU-DIKTI staffs which has facilitated, and Universitas Negeri Makassar for allowing me to continue my Ph.D. study.
Finally, I thank my colleagues and friends KU-DIKTI, PPI Ishikawa group, for all valuable support and encouragement throughout my study and especially to Mr.
As’ad for all discussion. Further, I would like to thanks for all staffs of Graduate School of Natural Science and Technology, Kanazawa University for their kind help and care during the years I was studying here.
Kanazawa, June 2018 Jumadi Mabe Parenreng
iii
Abstract
View of WSN devices is small, but have exceptional functionality and widely implemented technology for early warning detection systems. Each node of a WSN must have the ability to compute, to transmit and to receive data. However, WSN nodes have limited resources in terms of battery capacity, CPU, memory, bandwidth, and data security. Memory limitations mean that WSN devices cannot store a lot of information, while CPU limitations make them operate slowly and limited battery capacity makes them operate for shorter periods of time.
The main advantage of WSNs is their ability to be deployed in areas that are difficult to access by humans. In such areas, regular maintenance may be impossible;
therefore, WSN devices must utilize their limited resources to operate for as long as possible, but longer operations require maintenance.
Moreover, the data gathered and processed by the network face real security threats. The availability of resources and data security on WSN devices is an absolute requirement, but resource capacity is very limited. The limitation of resources force the devices to use the resources as efficiently as possible. Security is the largest resource used when the highest security is required for the output security data.
Resource-adaptation and security-adaptation solutions on sensors nodes are extremely important, particularly if they are used to monitor extreme areas where maintenance, such as replacing batteries or just checking the proper position of the device, is very difficult. One method of maintenance is to apply a resource adaptation policy when a system reaches a critical threshold.
This study presents an Adaptable Resource and Security Framework (ARSy Framework) that is able to adapt to the workload, security requirements, and available resources in a wireless sensor network. The workload adaptation is intended to preserve the resource availability of the WSN, while the security adaptation balances the level of security with the resource utilization.
Sending all collected data to the server is not a solution, so filtering data collected by a sensor is done through data mining. The data-mining is done on-board, each datum is collected by the sensor directly, and selection is done with the data- mining algorithm at the board node. The final result is then sent to the data server.
For security, data in this research is collected by estimating security-level based on average resources availability in sensor node. The more average resource availability, the higher the security level that will be implemented in the output data. This solution makes resources available on the basis of the workload of the system and adjusts the level of security for resource savings and makes the WSN devices work more efficiently.
For testing this model, using a single node comprising a Raspberry Pi 3 Model B and a DS18B20 temperature sensor were tested in a laboratory under normal and stressful conditions. The result shows that under normal conditions, the system operates approximately three times longer than under stressful conditions.
Maintaining the stability of the resources also enables the security level of a network’s data output to stay at a high or medium level.
Keywords: Wireless Sensor Network; Sensor Node, Resource-Aware; Security-Aware;
Security Levels; Limited Resources; Adaptable System; ARSy Framework; Mining Data.
iv
Table of Contents
Acknowledgements ... ii
Abstract ... iii
Table of Contents ... iv
List of Figures ... vii
List of Table ... ix
Chapter 1. Introductions ... 1
1.1. Background Overview ... 2
1.2. Research Objectives ... 5
1.3. Contributions ... 7
1.4. Dissertation Organization ... 7
Chapter 2. Fundamental Literature Review ... 8
2.1. Basic of Resources in WSN ... 9
2.1.1. Sensors ... 11
2.1.2. CPU ... 12
2.1.3. Memory ... 13
2.1.4. Radio Communication ... 14
2.1.5. Power Resource Node ... 15
2.2. Basic of Data Stream ... 18
2.3. Mining Data Stream ... 20
2.4. Resources Aware ... 21
2.5. Security Aware ... 23
2.6. Sensor for Environmental Extremes ... 25
2.6.1. Space ... 25
2.6.2. Underwater ... 27
2.6.3. Underground ... 28
Chapter 3. A Framework of Security Adaptation for Limited Resources in Wireless Sensor Network ... 30
3.1. Components Model ... 30
v
3.1.1. Resource of WSN Node ... 30
3.1.2. Resource Awareness ... 31
3.1.3. Mining Data ... 32
3.1.4. Resource-Aware and Mining Data Algorithm ... 32
3.1.4.1. Resource-Aware Cluster Algorithm ... 32
3.1.4.2. Resource-Aware Classification Algorithm ... 33
3.1.4.3. Resource-Aware Frequent Item Algorithm ... 33
3.1.5. Security Awareness ... 34
3.1.6. Security Level ... 34
3.1.7. Workload ... 34
3.2. Adaptable Resource and Security (ARSy) Framework ... 35
3.2.1. Data Input ... 35
3.2.2. Resource Monitor ... 36
3.2.3. Resource Adaptation ... 36
3.2.3.1. Battery ... 36
3.2.3.2. CPU ... 37
3.2.3.3. Memory ... 38
3.2.4. Workload System ... 38
3.2.5. Resource, Workload and Security Level Setting ... 38
3.2.6. Data Mining and Output ... 39
3.2.7. Security Level ... 40
3.3. Solution and Evaluation ... 40
3.3.1. Workload Solution ... 40
3.3.2. Security Level Solution ... 41
Chapter 4. Effectiveness Model of Resource and Security Adaptation for Wireless Sensor Network ... 43
4.1. Resource and Security in WSN ... 44
4.2. System Design ... 45
4.2.1. Architecture System ... 45
4.2.2. ARSy Framework ... 46
4.2.2.1. Resource Adaptation ... 47
4.2.2.2. Security Adaptation ... 48
4.3. Results ... 48
vi
4.3.1. Testing Scenario ... 49
4.3.2. Collecting and Data Mining ... 50
4.3.3. Resources ... 51
4.3.3.1. Battery ... 51
4.3.3.2. CPU ... 52
4.3.3.3. Memory ... 53
4.3.4. Security Level ... 55
4.3.5. Operating System ... 55
4.4. Discussion ... 56
Chapter 5. Concluding Remarks... 58
5.1. Conclusion ... 58
5.2. Future Work ... 58
Publication List ... 59
Bibliography ... 60
Appendix ... 69
Appendix A. Data Sheet Raspberry Pi 3 Model B ... 70
Appendix B. Data Sheet Temperature Sensor DS18B20 ... 72
Appendix C. Capture Hardware Hookup ... 76
Appendix D. Capture View Desktop ... 77
Appendix E. Log File Normal Test 30 mAh and 30s release data to server ... 79
Appendix F. Log File Stress Test 30 mAh and 30s release data to server .... 96
vii
List of Figures
Figure 1.1. Early Detecting forest fires using Wireless Sensor Networks ... 2
Figure 1.2. Forest fires (Javier Solobera, 2010) ... 3
Figure 1.3. Relationship Resource-Aware and Security-Aware ... 6
Figure 2.1 Illustration of WSN usage and implementation ... 9
Figure 2.2. WSN Node Mica Z (Luca Mottola., 2007) ... 10
Figure 2.3. The Components of a Sensor Node (Sahitya, 2016) ... 10
Figure 2.4. Analog to Digital value (Jimbo, 2018) ... 12
Figure 2.5. Achieving the Lowest Sensor Power Consumption ... 17
Figure 2.6. Battery discharge Curve for WSN ... 17
Figure 2.7. Energy consume wireless communication versus data rate ... 18
Figure 2.8. Writing Bits to Buffers ... 19
Figure 2.9. The Buffer writes the full stream byte to the OutputStream ... 19
Figure 2.10. Filling Buffer before bit reading, from InputStream... 20
Figure 2.11. Filling Buffer from InputStream to Buffer ... 20
Figure 2.12. Adaptation Mechanism (Phung, Gaber, & Röhm, 2007) ... 22
Figure 2.13. Smart sensor for the telemetry subsystem on WSN ... 26
Figure 2.14. Wireless sensor technology placement and deployment plan for Ariane 5’s upper stage ... 26
Figure 2.15. Application of PZT sensor networks: (a) Wired PZT sensor network in UAV wing box; (b) High-throughput wireless data acquisition system; (c) Next- generation wireless active PZT sensor system... 27
Figure 2.16. Underwater communicating nodes using acoustic links (L. Emokpae, 2013) ... 28
Figure 2.17. Underground sensor monitoring (KawamuraLab., 2018) ... 29
Figure 3.1. ARSy framework. ... 35
Figure 3.2. Pseudocode for battery adaptation. ... 36
Figure 3.3. Pseudocode for CPU adaptation. ... 37
Figure 3.4. Pseudocode for memory adaptation. ... 38
Figure 3.5. Light Weight Frequent Item Algorithm (Gaber et al., 2003) ... 40
Figure 3.6. Pseudocode for Workload Detection ... 41
viii
Figure 3.7. Pseudocode for Security Level Adaptation ... 42
Figure 4.1. Architecture system ... 46
Figure 4.2. Testing design ... 49
Figure 4.3. Collecting and mining data... 50
Figure 4.4. Battery consumption during normal and stress testing. ... 51
Figure 4.5. Battery adaptation during normal and stress testing. ... 52
Figure 4.6. CPU resource and adaptation during stress testing. ... 52
Figure 4.7. CPU resource during normal testing. ... 53
Figure 4.8. Memory resource and adaptation during stress testing. ... 54
Figure 4.9. Memory resource during normal testing. ... 54
Figure 4.10. Security level of data output during stress and normal testing. ... 55
ix
List of Table
Table 1.1. Power consume Telos Mote-iv (Moteiv-Corporation, 2004) ... 5
Table 2.1. Variant and characteristic sensor ... 11
Table 2.2. MCU specifications ... 13
Table 2.3 Operating System for WSN ... 14
Table 2.4. Sleep status for sensor node (Amit, Sinha., Anantha, 2001) ... 14
Table 2.5. Energy harvesting transducer comparisons (Cymbet Corporation, 2011)16 Table 2.6. Power Source Trade-offs in Sensors (PSMA Energy Harvesting, 2012) .... 16
Table 2.7. Power Consume under different situations ... 18
Table 2.8 Hash Function Overhead ... 23
Table 2.9. Attacks on WSN and countermeasures (Wang, Attebury, Ramamurthy, & -Lincoln Wang, 2006) ... 24
Table 3.1. Lists adaptations based on resources, workload and level of security .... 39
Table 4.1. Hardware system specifications ... 45
Table 4.2. Resource-adaptation formulas ... 47
Table 4.3. Testing parameters ... 49
Table 4.4. Operation duration. ... 56
Table 4.5. Memory consumption during normal and stress testing ... 57
1
Chapter 1. Introductions
Evolution Technology occur so rapidly entering all fields and strive to maximize all possible potentials to be managed, not only on human resources but also in natural resources. To be able to maximize the utilization of existing potentials, then used wireless sensor network technology (WSN) that is able to explore cheaper, faster, precise and continuously, so that every change is recorded in the form of data and allows for analysis at certain times.
Wireless sensor network technology (WSNs) is known as low-cost, small, applicable, very powerful and useful technology for a wide range of applications, enabling to monitor and control the physical environment from remote locations with high accuracy, can be applied to various domains such us monitoring environment and agriculture, healthcare, public safety and military system, Industry, and transportation system (Rault, Bouabdallah, & Challal, 2014), The biggest achievement of researchers in this field is design system that can combine not only in scientific community but also to the industry so that they can synergize together.
The use of WSN is not only for regular area monitoring, but it is much more advanced and developed to monitor the more difficult and even extreme areas to reach by humans. For extreme areas usually use a new smart sensor that allows for areas such as underground, underwater and space (Habib F. Rashvand., 2017). For implementation in areas that are difficult to reach usually this sensor network system without regular maintenance. So that required mechanism to maximize lifetime system. Lifetime sensor nodes rely heavily on the success of system design whose determinant factors are based on several parts, such as fault tolerant, scalability, production cost, hardware constraints, network topology sensors, environment, transmission media and power consumption (Ian F. Akyildiz, Su, Sankarasubramaniam, & Cayirci, 2002).
Nodes are usually widely distributed in certain environments for controlling, interconnecting and communicating, processing data when needed, sending and receiving data, from and to the sensing node, connected to the sync node in a centralized network between one node and the node other. These nodes are dispersed in large amounts of density in the target area of monitoring and sensing for a long time, with data transmitted so that the node is able to provide much more detailed information about the physical environments in the area it is monitoring (Archana, Bharathidasan., Vijay, Anand, Sai, 2003).
To more effectively communicate and coordinate between nodes, network systems typically use network topologies such as mesh, star or other options, allowing faster coordination of the node to sink sensor, and then to the server as the information center. In general, such as computer networks, there are three challenges when designing a network node system and is very influential on the efficiency of network systems, the first is a type of network protocol that can minimize control data and packets to be sent, the second is the selection of the best network topology and position the node where the most appropriate, and the third is the application of a
2 routing algorithm that is able to work effectively pass data on the network from the original node to the destination node (Pour, 2016).
In the implementation of each sensor node only allows to perform limited data processing based on the availability of resources attached to it. The most difficult challenge so far is how to maximize the utilization of WSN resources in the form of battery, CPU, memory and radio communications, because this is the main part that supports wireless sensor network to be able to work with long time (Karl, Holger., Andreas, 2005), (Phung, Gaber, & Roehm, 2007), (I.F. Akyildiz, Su, Sankarasubramaniam, & Cayirci, 2002).
1.1. Background Overview
Generally the sensor node is small, cheap, and lightweight and the function is extraordinary. There are many variations of sensors commonly used for WSN such as acoustic, seismic, image, heat, direction, smoke, temperature and other sensors.
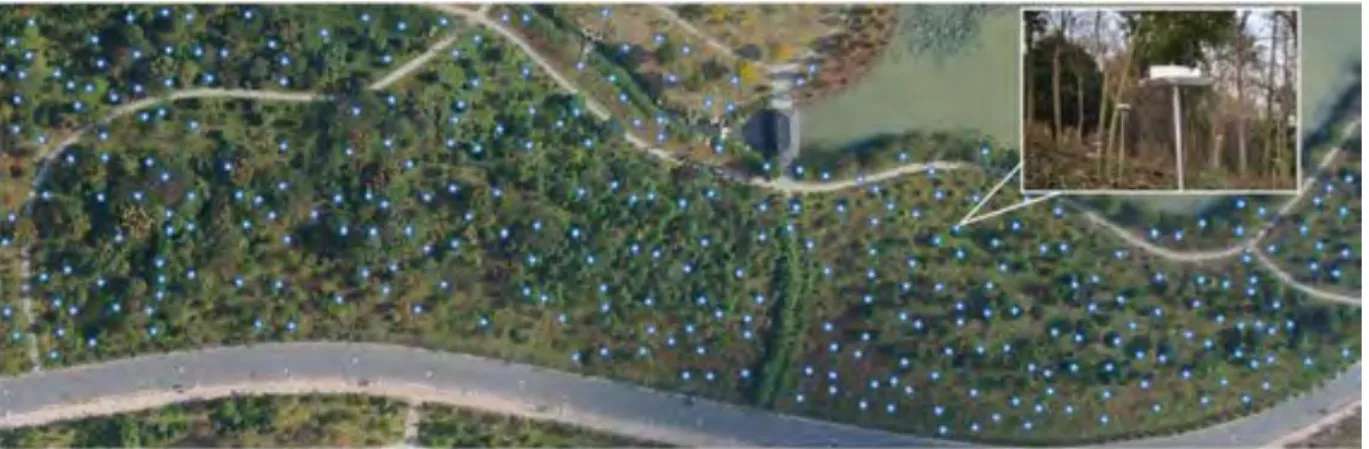
Implementation is also diverse, for example, used for traffic congestion information, forex movements, public transportation arrival schedules, even used to monitor unaffordable environmental conditions, such as detection of earthquake triggers in the depths of the ocean, radiation levels of chemicals in certain areas, monitoring volcanic conditions and many other functions. WSN has the ability to receive data, process data and transmit the results. To perform monitoring, tracking and controlling continuously for 24 hours full on large area. For the implementation of WSN network is not stand alone, but is supported with network systems and supporting devices are scattered (I.F. Akyildiz et al., 2002). Figure 1.1 and figure 1.2 shows WSNs implementation for forest fires detection.
Figure 1.1. Early Detecting forest fires using Wireless Sensor Networks
3 Figure 1.2. Forest fires (Javier Solobera, 2010)
The main components of the node sensor consist of a sensing unit usually composed of sub-unit sensors and analog to digital converters (ADCs), processing units for processing data, managing the procedures that make the sensor nodes collaborate to another node for completing a particular spell, a transceiver unit for connection node to a wider network, the power unit becomes a very important part of a sensor node because the lifetime depends on the availability of the battery resource (I.F. Akyildiz et al., 2002). For more details, see Figure 2.3.
To maximize the lifetime sensor node, the success depends on the system design, based on (Ian F. Akyildiz et al., 2002):
- Fault tolerant; this is related to the failure that may be caused by one of the node sensor in the network for example due to the failure of source power that impact on the system as a whole.
- Scalability; this concept is related to the range of the system, because the use of device node sensor is usually in large quantities with the implementation covering a large area.
- Production cost; sensor nodes with large numbers, small and lightweight, then the cost per item should be as cheap as possible. For cost production embedded WSN devices that are integrated with flash storage, analog-to-digital converter and digital I / O per item price between $ 1- $ 5 (Jason Lester Hill, 2003).
- Hardware constraints; basically subunits on each sensor node i.e. sensing unit, processing unit, transceiver unit, power unit and storage unit. All of these subunits may need to fit in a matchbox-sized module (C. Intanagonwiwat, R.
Govindan, 2000), with size stringent constraints will affect the existing resource constraints on the sensor node (Kahn, Fellow, & Pister, 1999).
- Sensor network topology; this becomes a very important part because the sensor nodes are not stand alone but work in parallel and dispersed with high density.
4 - Environment; the placement environment becomes a challenge for node sensor equipment because it could be placed in an area that is not reachable by humans.
- Transmission media; choice of communication media between node to node, node to sink and node to main server can be done with some variant such as using radio communications, infrared or optic media.
- Power consumption; this part is a big challenge as it impacts the lifetime.
System requirements require the sensor nodes to operate for as long as possible.
Operationally supported by battery equipped with a limited power source (<0.5 Ah, 1.2 V) and should be capable of supporting the work of sensing, communication and data processing.
With a small average node sensor size, the embedded resource also adjusts, for example wireless integrated network sensor (WINS). WINS nodes get a power supply from a lithium battery (Li) coin cells with a diameter of 2.5 cm and 1 cm in thickness.
The total average system supply currents must be less than 30 microampere to support longer operation time. Another alternative power unit using Energy scavenging (Cymbet Corporation, 2011) allows extend lifetime sensor network, which means doing extract energy from the surrounding environment.
With limited resources, unreachable placement, and without alternative energy scavenging, then the choice is only by using a power battery. In this condition, the energy saving mechanism is required from all operational aspects of the sensor node.
The latest trend in the wireless network scope is online data stream where data processing is done on a wireless sensor network scope that rely on high speed data input stream, then at the same time sending data update with energy available (Phung, Gaber, & Röhm, 2007). Therefore energy efficiency and resource management are a very important part for data processing techniques in this network model. The cost efficiency of mining data stream of this model, which is to distribute data at high speed based on existing events and mining in data stream is the processing of data online and real time from certain desired data pattern (J. M. Parenreng & Kitagawa, 2018). Another method is by applying data mining mechanisms on-board process (Tanner, Alshayeb, & Criswell, 2002), each data captured by the sensor is directly processed on-board then the end result is sent to the server (Gaber & Yu, 2006). The on-board process of space astronomy is one example of its application because these onboard sensor devices generate large amounts of data captured streaming and with high data rates. This on-board process brings a tremendous impact because of its ability to minimize resource sensor utilization, especially energy saving on the side of communication media.
Other policies applied for energy saving, one of which is by applying dynamic power management (DMP) policy (Amit, Sinha., Anantha, 2001), the principle of this policy sets the node sensor mode from active to sleep or idle status. With this status change the value of energy consumption varies and much more saves the sensor node resource. Table 1.1. Shows the Mote IV Telos data sheet showing the different energy consumption in each operating status.
5 Table 1.1. Power consume Telos Mote-iv (Moteiv-Corporation, 2004)
Operation status Min Norm Max Units
Supply voltage 2.1 3.6 V
Supply voltage during flash memory programming 2.7 3.6 V
Operating free air temperature -40 85 oC
Current Consumption: MCU on, Radio on 20.2 23 mA Current Consumption: MCU on, Radio off 420 1400 µA
Current Consumption: MCU asleep 2.4 6 µA
Another interesting issue is network security and data on sensor nodes.
Traditionally security offers a model of system protection as strong as possible, but most data protection levels are always higher than the potential threats required.
When security policies are implemented very strongly, it will affect the overall performance of the system, excessive protection will reduce reliability and availability and will affect global security(Pour, 2016). Appropriate level of security can be estimated in terms of providing protection model with different security quality (Ksiezopolski, Szalachowski, & Kotulski, 2010).
Another threat when the system implements a very strong security policy, it can be a threat of device performance that has limited resources and will be a way for new threats such as exhaustion of resources, whose impact will reduce system efficiency, availability and introduce redundancy. Another effect of excessive estimation on security will increase the complexity of the system, which then affects implementation, but enforcing restrictions will reduce its function. As a solution by predicting the appropriate level of security on each output data (Ksiezopolski &
Kotulski, 2007), (J. M. Parenreng & Kitagawa, 2017), (J. M. Parenreng & Kitagawa, 2018).
Other study (Chui Sian Ong, 2003) discusses the quality of protection (QoP) that defines the security level based on security parameters. The parameters are like;
a key length, the length and contents of an encrypted block of data. Other study (Schwan, 1997) proposed a protocol adaptation whose concentration on authorization, capable of changing the version of authorization protocol and finally able to make changes to symmetric parameters and asymmetric cipher.
1.2. Research Objectives
This study attempts to maximize the sensor node function, by capturing data, processing data with available resource capabilities, and sending it to the server with data security based on existing resources on the sensor node. The ultimate goal is expected to increase the efficiency of resource use and lifetime system.
The availability of resource and data security on WSN devices is an absolute requirement, but the node sensor resource capacity is very limited. Limitations of Battery, CPU and Memory resources on WSN make it operate by utilizing resources as efficiently as possible. Security includes the largest use of resources when output
6 security data is desired with the highest security. Therefore, the resource and security adaptation of the device node sensor becomes very important.
In this topic proposes a model of security and resource adaptation in wireless sensor network (ARSy Framework). Adaptation of resources to maintain the availability of limited resources is always in a stable condition. Battery power will regularly decrease over time node operation, CPU busy will affect to the memory and this activity will spend battery power faster than normal conditions, so that the sensor activity will affect the lifetime sensor node. Basically the availability of resources on the sensor node can be maintained by setting the input data mechanism through time capture. So that the CPU and Memory activities able to operate normally and the battery resource will not decrease significantly. Security Adaptation is intended for data security, which does not require that node sensors encrypt with the highest security. The security adaptation to the sensor node resource is to encrypt data based on existing resources, so the most appropriate security level prediction mechanism for available resources on the sensor node is required.
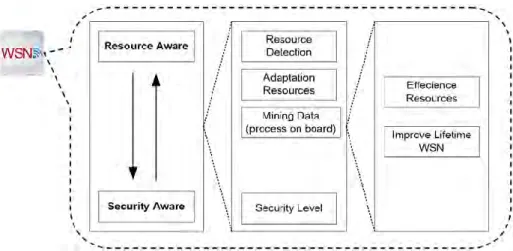
Figure 1.3 below shows the relationship between Resource Aware and Security Aware. One side of the sensor node resource must be maintained from time to time, while the security uses the resource to encrypt the data, if it is driven with a strong security quality then the limited sensor node resources will quickly run out, so the mechanism of security quality adjustment based on available resources.
Figure 1.3. Relationship Resource-Aware and Security-Aware
This study implements a proposed adaptation model, is expected to be a solution to the problem of limited resources and security on wireless sensor network.
Here are some of the purposes of this research:
- We want to operational sensor node adaptable to resource condition; this system is designed to find out the latest update of any resource at any time in order to adapt to the available resource conditions.
- How to efficiency resource usage of WSN; is intended to maximize the utilization of the limited resources available for data processing.
- How to improve the lifetime device WSN and operate under low resource;
expected with the efficiency of resources, the lifetime sensor node can be
7 increased, and able to operate under low resources because the adaptation applied.
- How to workload adapt, when the system in heavy workload or light workload;
this is intended to be an indicator if the resource is in critical condition which means heavy workload and not critical which means operate with normal workload.
- How to create a security system that can adapt to the conditions of limited resources; by default security must be strong, but in fact, in the case of WSN this condition is different, so the security design in this case is expected to adapt to existing resource conditions. Adaptation model through security level, each level based on resource conditions that change from time to time.
1.3. Contributions
Combining the issue of security adaptation and resource efficiency in this research is a challenge, because researchers in the field of security assume that with any conditions on security must be strong. But in fact, this is a different case, and specifically designed for implementation in areas that are not possible to reach even for routine maintenance such as replacing the battery. Claim contributions of researchers in this study are:
- A Framework of Security Adaptation for Limited Resources in Wireless Sensor Network.
- I think this is the first model adaptation that combining adaptable resources using mining data and adaptable security using security level, both of process are done on-board in sensor node.
1.4. Dissertation Organization
Generally speaking the discussion on this dissertation there are two main parts, the first is the deception of resource and security adaptation model ARSy Framework.
The second is the discussion on the implementation of the proposed adaptation model.
More detailed discussion of this my dissertation is organized as follow:
- Chapter 2; this section contains a review of previous research, which discusses the basic concepts of resources on sensor nodes, data streams, data mining, resource-aware, security-aware, and implementation of sensors for environmental extreme areas.
- Chapter 3; this section discusses the complete block diagram, basic logic and pseudocode for ARSy Framework.
- Chapter 4; this section discusses the requirements hardware system, hardware hookup, testing mechanisms, schemes and test scenarios, results and results analysis for ARSy Framework
- Chapter 5; is the final section, which contains conclusions and future work.
After this section contains some document attachments which are an important part of this research.
8
Chapter 2. Fundamental Literature Review
Hardware and software technology for WSN is growing rapidly, making it possible to process and distribute large amounts of data. For research related to environmental monitoring it will be associated with the capture and processing of large amounts of data streams, and this is a challenge for monitoring. Sensor nodes have limited memory, computational capabilities and battery energy (C. Aggarwal, 2006). For solutions, it is desirable to minimize memory utilization, processing and data communications on the nodes. This problem is very interesting, because in reality there are millions of sensor nodes that are used to provide information globally for analysis.
Generally a wireless node is a device that operates using a battery, so it has limited energy capacity, although in its implementation some devices allow for charging, battery replacement or allowing to implement energy harvesting in the location of placement. But the fact is, there is a sensor node device that placement in a very extreme area so it is impossible to reach and not possible to perform routine maintenance even to replace the battery. This is the reason for saving power consumption on WSN, and become the biggest challenge researchers today.
If you want to look more deeply from some of the main components of WSN, then the most consume energy is the processor and media communication, this is because the processor works simultaneously by checking the radio communications and encoding and decoding every data packet that arrives through communication media and this requires higher communication rate and required faster computation (Jason Lester Hill, 2003). The more busy the CPU, the greater the energy consumption (Potlapally, Ravi, Raghunathan, & Jha, 2006).
The 2020 prediction that half of the internet-connection sensors and devices will be run using the battery as an energy source, this being the main focus because battery replacement will cost a lot, while configuring it in sleep mode will make the device work with low performance (Pretz, 2017). The largest energy consumption in the node sensor is one of them on the radio communication side. In this case, one of the solutions to preserve available power is Wi-Fi radio setting in sleep mode, this power-saving setting is IEEE Wake-Up Radio will activate radio every few milliseconds to get the data signal. 100 milliWatt Wi-Fi radio can consume 3 volts and 130 milliaAmpere hour battery for operational about 4 hours. Most smart devices connect to IoT through three radio communication modes: short-range using Bluetooth, medium-range via WLAN or Wi-Fi, and longer-range via cellular radio.
Sensors are classified into two broad categories, namely passive and Active sensors; passive sensor is divided into two, the first Passive, the sensor is the type of Omni directional, for example, PIR sensor (passive infrared receive), this type of sensor is also widely applied to robots, such as line detection. This type of sensor performs data capture but does not manipulate data. The existing energy is only used to amplify analog signals, required for capture data transfer. The second is Passive, Narrow- beam sensor, an example of this type is the camera. The system performs sensing only in certain directions. The latter is an Active sensor, this type of sensor commonly
9 used for habitat or environmental monitoring and is usually applied for early warning detection in disaster-affected environments.
In node sensors, the processing unit is generally 8-16 bits, 1-24MHz microcontroller with memory capacity of 1KB-4MB onboard memory, this resource capacity varies due to the microcontroller family and the vendors that produce it. For power units, usually consisting of one or more batteries, capable of supplying 3V- 4.5V, which is generally the capacity between 1700mAh-2700mAh (Dinesh, Kumar, 2013).
The choice between lifetime or security on WSN becomes an interesting topic, this is because it needs to balance between resource availability and output security level predictions, and will sacrifice one of them. If the desired data with high security then sacrificing the efficiency of limited resources, the impact will reduce the lifetime device. But if the efficiency of the resource, then the security data output will be sacrificed, because each data output is based on the prediction of the most appropriate data security level based on the availability of WSN resources (J. M.
Parenreng & Kitagawa, 2018).
2. ..
2.1. Basic of Resources in WSN
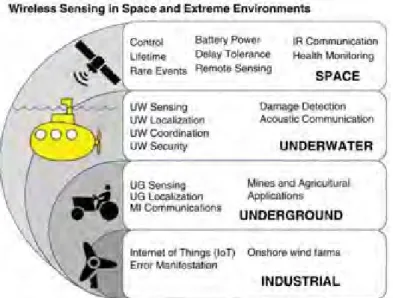
Although it seems small WSN successfully combine component sensing, computation and communication into a single tiny device. With the appropriate network topology it is possible to perform sensing in areas that are difficult to reach such as deep sea exploitation, highest mountains, magma detection, and even out of space. This concept is like in Figure 2.1 which is a collaboration between research, development and implementation that utilizes wireless sensor system device for Space, underwater, underground and industry (Habib F. Rashvand., 2017).
Figure 2.1 Illustration of WSN usage and implementation
When a single node sensor, its ability is very limited, but if combined with thousands and even millions of pieces of WSN, then this technology offers radical
10 new technological possibilities (Jason Lester Hill, 2003). With a large number and appropriate placement then node sensor technology is able to exploit each side and provide information with more complete data, fast and accurate. More details about sensor nodes that have the ability to do tracking in real-time, monitoring
environmental conditions, agriculture, Healthcare, public safety and military
system, Industry, transportation system and others. In addition, the system can be accessed remotely via wireless interconnection network with range of distances up to thousands of kilometers. Figure 2.2 below is WSN Node Mika Z whose system is already integrated with sensing system.
Figure 2.2. WSN Node Mica Z (Luca Mottola., 2007)
In general, each node sensor has five main components namely, sensing device, processor, memory, power supply, and transceiver (Archana,
Bharathidasan., Vijay, Anand, Sai, 2003). The system units are depicted as shown in Figure 2.3.
Figure 2.3. The Components of a Sensor Node (Sahitya, 2016) Each unit has unique characteristics and interconnected with the board system, more detailed function is described as follows:
Sensing Units; usually composed of two subunits: sensors and analog-to- digital Converters (ADCs). The analog signals are produced by the ADC, and fed into the processing unit.
Processing Unit; Associates with a small storage unit (tens of kilobytes order) and manages the procedures to collaborate with other nodes to carry out the assigned sensing task.
11
Memory unit; modern flash-based microcontrollers, comprising between 1 to 128 KB of on-chip memory storage program, it is sufficient to use as a
memory program and as a temporary data storage. In addition memory still has 128 and 32KB of RAM data that can be used for program execution, or storage with a much larger capacity(Jason Lester Hill, 2003).
Power Units; Supplies power to the system by small size batteries which makes the energy a scarce resource.
Transceiver Unit; Connects the node to the network via various possible transmission media such as infra, light, radio and so on.
2.1.1. Sensors
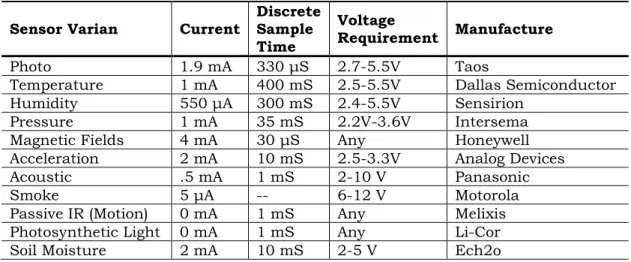
Sensors are devices for sensing physical systems or an environment. Generally, it produces an electrical or optical signal output as a measure of a certain quantity change. Some types of sensors based on electrical or electronic applications are classified as: chemical, pressure, temperature, humidity, position, thermal, optical, sound, speed, magnetic, heat sensors and many other types. As seen in table 2.1 below is a variant of the sensor that is applied to smart home, government offices or industry and many options available in the market (Jason Lester Hill, 2003).
Table 2.1. Variant and characteristic sensor
Sensor Varian Current
Discrete Sample Time
Voltage
Requirement Manufacture
Photo 1.9 mA 330 μS 2.7-5.5V Taos
Temperature 1 mA 400 mS 2.5-5.5V Dallas Semiconductor Humidity 550 μA 300 mS 2.4-5.5V Sensirion
Pressure 1 mA 35 mS 2.2V-3.6V Intersema Magnetic Fields 4 mA 30 μS Any Honeywell Acceleration 2 mA 10 mS 2.5-3.3V Analog Devices
Acoustic .5 mA 1 mS 2-10 V Panasonic
Smoke 5 μA -- 6-12 V Motorola
Passive IR (Motion) 0 mA 1 mS Any Melixis Photosynthetic Light 0 mA 1 mS Any Li-Cor
Soil Moisture 2 mA 10 mS 2-5 V Ech2o
In general, the sensor is divided into two types of interfaces that can be used on sensor networks, namely analog and digital. Analog Sensors generally produce continuous output signals and are associated with physical phenomena such as;
accelerometers, pressure sensors, light sensors, sound sensors, temperature sensors, and so on (Tarun, 2018). Digital Sensors are usually electronic sensor or electrochemical sensor, this sensor performs data conversion and digital data transmission. This digital sensor replaces the analog sensor because it can overcome the existing deficiencies in analog sensors. Generally digital sensors consist of three main components: sensors, cables, and transmitters. In digital sensors, the measured signal is directly converted to a digital-value measure within the digital sensor itself and then displayed in the form of easy-to-read digit values. The most common analog
12 and digital value readings are analog clocks and digital clocks, analog measuring instruments and digital measuring instruments and joysticks, as shown in Figure 2.4.
Figure 2.4. Analog to Digital value (Jimbo, 2018)
Generally in the market, analog sensor prices are slightly more expensive than digital sensors, so the selection and use of each type of sensor will be adjusted to the object to be detected, and input signal required. Analog quantities can’t be processed directly by programmed system controls such as PCs, Microcontrollers or PLCs because devices that have CPUs are only capable to processing digital data. Therefore, the use of analog sensors always coincides with the converter from analog to digital or ADC (Analog to Digital Converter)
2.1.2. CPU
The latest microcontroller is designed with integrated flash memory, RAM, ADC converter and I / O integrated in a module that costs between 1 $ to 5 $ (Jason Lester Hill, 2003). This integration is ideal for embedded systems such as WSN.
Implementation of node sensors is usually in a certain area with a large number of nodes, so some key requirements to consider when going to choose a microcontroller such as; energy consumption, voltage requirement, cost per unit, support peripherals and external components requirements required.
Processing unit on sensor node, generally 8-16 bit, 1-24MHz microcontroller with memory capacity 1KB-4MB onboard memory, this resource capacity varies because family microcontroller and vendor that produce it (Dinesh, Kumar, 2013).
For power consumption on microcontroller is also different, generation microcontroller with standard 8 bit or 16 bit power consumption between 0.250 mA to 2.5 mA per MHz. While operational node sensors are generally powered by a power unit that usually consists of one or more batteries, capable of supplying 3V-4.5V, which is generally the capacity between 1700mAh-2700mAh.
For implementations in areas requiring high-efficiency power consumption, some mode options such as sleep or idle are used. Extremely low power consumption on microcontroller during idle mode. At idle condition microcontroller will be in sleep
13 mode so that CPU stop executing. Sleep mode consumes currents between 1μA and 50μA across the controller families (Instruments, 2018).
Table 2.2 below describes some MCU platform variants and memory capacity commonly used for WSN nodes(Rodrigues, Montez, Budke, Vasques, & Portugal, 2017).
Table 2.2. MCU specifications
MCU Platform Clock
(MHz) Wait
State FPU Flash
(KB) SRAM
(KB) EEPROM (KB)
Typical Current
(mA)
ATmega328P 8-bit AVR 16 0 No 32 2 1 0.2
ATmega128RFA1 8-bit AVR 16 0 No 128 16 4 4.1
ATxmega256A3U 8/16-bit
AVR 32 0 No 256 16 4 9.5
SAMR21G18A 32-bit ARM
Cortex-M0+ 48 1 No 256 32 0 6.7
SAMG55 32-bit ARM
Cortex-M4 120 5 Yes 512 160 0 24.2
SAMV71Q21 32-bit ARM
Cortex-M7 300 6 Yes 2048 384 0 83.0
2.1.3. Memory
The initial design of the memory system on network sensor operations such as TinyOS is not designed to have memory management (Farooq & Kunz, 2011). The assumption is that WSN device is only used to execute single application on sensor node so that it does not need memory. But over time, as required by WSN systems and applications that are used to support multiple thread execution operations, the memory management system becomes a very important issue for OS on WSN.
Generally sensor nodes require only a small amount of storage and program memory because the stored data is temporary on the sensor node. Modern flash-based microcontroller consists of 1 to 128 KB of on-chip memory storage program, It is enough used for memory program and as temporary data storage. In addition memory still has 128 and 32KB of RAM data that can be used for program execution, or additional storage for storage media with a much larger capacity. As seen in table 2.2 above about some variants of MCU and memory capacity available.
Usually the memory on the sensor node already include on flash memory and RAM. Flash memory is used to store downloaded application code and RAM is used to store application programs, data sensors and intermediate results of computations.
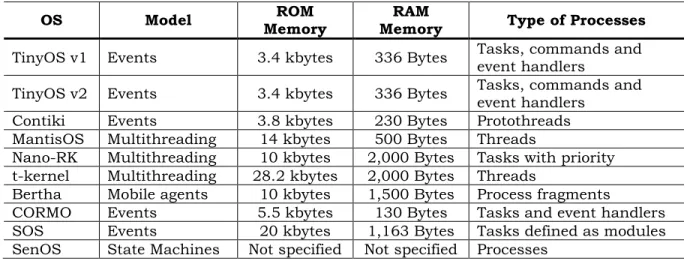
Table 2.3 shows some variants of OS WSN with available memory capacity (Lajara, Pelegrí-Sebastiá, & Perez Solano, 2010).
14 Table 2.3 Operating System for WSN
OS Model ROM
Memory RAM
Memory Type of Processes TinyOS v1 Events 3.4 kbytes 336 Bytes Tasks, commands and
event handlers
TinyOS v2 Events 3.4 kbytes 336 Bytes Tasks, commands and event handlers
Contiki Events 3.8 kbytes 230 Bytes Protothreads MantisOS Multithreading 14 kbytes 500 Bytes Threads
Nano-RK Multithreading 10 kbytes 2,000 Bytes Tasks with priority t-kernel Multithreading 28.2 kbytes 2,000 Bytes Threads
Bertha Mobile agents 10 kbytes 1,500 Bytes Process fragments
CORMO Events 5.5 kbytes 130 Bytes Tasks and event handlers SOS Events 20 kbytes 1,163 Bytes Tasks defined as modules SenOS State Machines Not specified Not specified Processes
2.1.4. Radio Communication
Radio communication is a very important resource on WSN, and includes the components that consume the greatest energy. The higher the activity of radio communications the greater the energy consumption. For the transmission and reception of short-range data packets energy consumption between 15 to 300 milliwatt and this energy consumption occurs when the radio is active (Jason Lester Hill, 2003). In radio communications, increased bit rate will have an impact on the decrease of transmission time. Unlike with high performance data networks, WSN does not require high bit rate. With a large bandwidth network 10-100 Kbps is enough to run many applications.
Table 2.4. Sleep status for sensor node (Amit, Sinha., Anantha, 2001) Sleep state StrongARM Memory Sensor, analog-
digital converter Radio
S0 Active Active On Tx, Rx
S1 Idle Sleep On Rx
S2 Sleep Sleep On Rx
S3 Sleep Sleep On Off
S4 Sleep Sleep Off Off
Tx=transmit, Rx=receive
Radio-communication activities have a significant impact on power consumption and lifetime sensor nodes, when compared to power consumption due to WSN applications being used. Table 2.4 describes the activity of radio communication, which affects the different energy consumption of each level and node sensor status. Each component in the node may have different power usage modes.
Some types of sensor nodes can have active, idle or sleep state, and on the radio can transmit, receive, standby or off mode. Each node with sleep status has a combination with different power consumption.
15 2.1.5. Power Resource Node
The design of WSN Node depends on the function, range, capacity and location of the placement. The impact of this design, affect to the market price of the WSN node. Some nodes are designed to use only disposable, because the placement in a location that is impossible to do maintenance. The average consumption of WSN power is measured by units of micro amps, the ultra-low-power operation is obtained only through a combination of low-power hardware components and low duty-cycle operation techniques (Jason Lester Hill, 2003). Power source on the node is the most important part to support lifetime operation longer. Batteries such as AA or AAA alkaline cells, lithium thionyl chloride, lithium coin cells, or a host of other chemistries with supply output power ranging from 3.3 volts to 5 volts are generally used.
Some nodes allow the supply of energy from main power because it may be placed adjacent to the building or building that has been integrated with the power source. But several it is impossible to obtain a source power from main power so that its operation depends on the power of the battery attached to it. In fact some of the nodes placement in areas that are unreached by humans (Habib F. Rashvand., 2017) and there is not possibility to perform maintenance such as replacement battery routinely. For the current scenario of implementation, for energy supply node sensors are very extreme placement of self-powered where the node has the ability to perform scavenging energy through the device within the sensor itself (Ozel, Tutuncuoglu, Yang, Ulukus, & Yener, 2011).
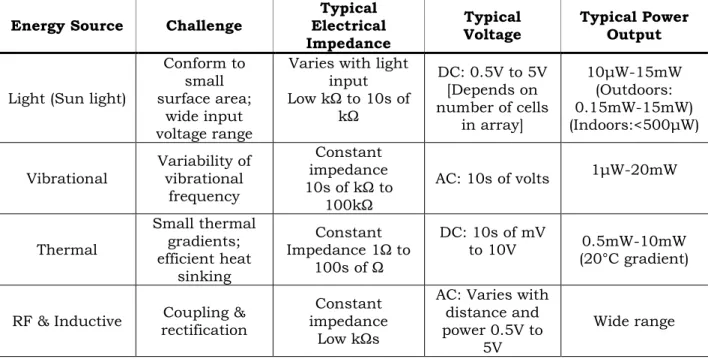
For placement locations that allow the application of renewable energy technology, some wireless nodes may extend the lifetime through energy scavenging (Tobergte & Curtis, 2010), (Roundy, Wright, & Rabaey, 2003), (Murata, 2018). For harvesting energy, the source is obtained by vibration, heat, wind, light or other sources. This energy conversion is better known as transducers. A transducer is a device that converts energy from one form to another. The most widely used transducer types for energy harvesting such as photovoltaics are also known as solar cells that convert light to electrical power, electrostatic or electromagnetic obtained from vibration, Thermoelectric converts differential to electrical power, Piezoelectric converts mechanical movement to electrical power, RF and Inductive performs the conversion of magnetic power to electrical power. Table 2.5 describes scavenging energy for some energy sources.
16 Table 2.5. Energy harvesting transducer comparisons (Cymbet Corporation, 2011)
Energy Source Challenge
Typical Electrical Impedance
Typical Voltage
Typical Power Output
Light (Sun light)
Conform to small surface area;
wide input voltage range
Varies with light input Low kΩ to 10s of
kΩ
DC: 0.5V to 5V [Depends on number of cells
in array]
10μW-15mW (Outdoors:
0.15mW-15mW) (Indoors:<500μW)
Vibrational
Variability of vibrational
frequency
Constant impedance 10s of kΩ to
100kΩ
AC: 10s of volts 1μW-20mW
Thermal
Small thermal gradients;
efficient heat sinking
Constant Impedance 1Ω to
100s of Ω
DC: 10s of mV
to 10V 0.5mW-10mW (20°C gradient)
RF & Inductive Coupling &
rectification
Constant impedance
Low kΩs
AC: Varies with distance and power 0.5V to
5V
Wide range
Table 2.6 below shows the comparison of advantages and disadvantages for source power sensors using wired, battery or energy harvesting.
Table 2.6. Power Source Trade-offs in Sensors (PSMA Energy Harvesting, 2012) Energy Source
Sensor Type Cost Implementation
Wired Sensors Highest initial cost Average operating cost
Simple Reliable
Very high installation cost Battery Powered
Wireless Sensors
Lowest initial cost Highest operating cost
Simple
Cheaper than wired Constant battery replacement Energy
Harvesting Wireless Sensors
High initial cost Lowest operating cost
More complex engineering Lowest lifetime costs
In node sensors the radio communication unit is known to consume the greatest energy, especially in systems operating online and real-time updates for streaming data. The solution to reduce power consumption on radio communications can be done by reducing data transmission cycles or by on-board-mechanism process (Tanner et al., 2002), (Kargupta et al., 2004), this concept does not send all data capture by sensors over time, but passes data processing on the sensor node when the data is captured and the results are sent at a specified time period. Figure 2.5 shows the power consumption saving solution through the node sensor activity and status settings (Freescale, 2015).
17 Figure 2.5. Achieving the Lowest Sensor Power Consumption
Generally there are three types of batteries used for WSN such as; Alkaline, lithium (Jason Lester Hill, 2003) and Nickel Metal Hydride (NiMH) (Energizer, 2010), (Onbowpower, 2014). Figure 2.6. AA alkaline battery with a voltage of 1.5V, but during its operation ranges from 1.65 to 8 V and it’s rated at 2850mAh, with a volume of just 8.5 cm3, it has an energy density of approx. 1500 Joules/cm3.
a. Lithium b. Alkaline
c. NiMH
Figure 2.6. Battery discharge Curve for WSN
Power consumption of single-node sensor resources, commonly used for data acquisition, data processing and data transmission. When the energy saving solution is applied to the node, it is most important to determine the energy consumption of each part of the sensor node, including the energy consumption of the analog circuit.
In the data transmission process, the communication module usually sends signals to the routing node and this is the highest energy consumption. In the sensor network, nodes interact with each other through the communication protocol and in the case