Molecular mechanisms of metabolic regulation of glioma stem cells by mTORC1 activationm
著者 モハメド ヒガージ モハメド アーメド
著者別表示 Mohamed Hegazy Mohamed Ahmed journal or
publication title
博士論文本文Full 学位授与番号 13301甲第4486号
学位名 博士(理学)
学位授与年月日 2016‑09‑26
URL http://hdl.handle.net/2297/46591
doi: 10.1074/jbc.M116.734756
Creative Commons : 表示 ‑ 非営利 ‑ 改変禁止 http://creativecommons.org/licenses/by‑nc‑nd/3.0/deed.ja
Dissertation
Molecular mechanisms of metabolic regulation of glioma stem cells by mTORC1 activation
Mohamed Hegazy Mohamed Ahmed
Student ID No. 1323032003
Division of Life Science
Graduate School of Natural Science and Technology Kanazawa University
JAPAN
2016
Table of Contents
Pages
Acknowledgment 1
List of Abbreviations 3
Abstract 8
Introduction 10
Aim of study 18
Materials and Methods 19
Results 32
Discussion 84
References 89
Conclusion 99
1
Acknowledgement
First of all, I would like to express my deep thanks to my supervisor Professor. Atsushi Hirao for his support and advice during my PhD study at Kanazawa University. Without his help and encouragement, it would not have been possible to complete this research. Joining his research group was one of my best decisions I have made.
I would like also to thank all former and current laboratory members in Division of Molecular Genetics, Cancer and stem cells research program, Cancer Research institute, Kanazawa University, for their assistance and cooperation. Specially, Dr. Daisuke Yamada, Dr. Masahiko Kobayashi, Dr. Masaya Ueno, Dr.
Mohamed A.E. Ali, Dr. Kumiko Ohta and Dr. Yuko Tadokoro.
Also, I would like to express my deep thanks for all
collaborators from different laboratories, Prof. Chiaki Takahashi
and Dr. Susumu Kohno form Division of Oncology and Molecular
Biology, Cancer Research Institute, Kanazawa University. Prof.
2
Tomoki Todo and Dr. Yasushi Ino, Laboratory of Innovative Cancer Therapy, Institute of Medical Science, University of Tokyo.
Prof. Tomoyoshi Soga, Institute for Advanced Biosciences, Keio University.
In addition, I would like to express my great thanks to Prof.
Katsuji Yoshioka Division of Molecular Cell signaling, Cancer Research Institute, Kanazawa University for his academic support.
I am gratefully acknowledging financial support from the Egyptian Ministry of Higher Education and Mission Sector, whom made it possible for me to travel and study in Japan.
I would like to extend my thanks and appreciation to all my Professors at the Zoology Department, Faculty of Science, Minia University, Egypt, for their understanding, allowing me to get this opportunity to study abroad and obtaining a doctoral degree.
Finally, I also have much gratefulness to all my family
members for getting me to this point.
3
List of Abbreviations
2-NBDG 2-N-7-nitrobenz-2-oxa-1,3-diazol-4-yl amino-2- deoxyglucose
3PGA glycerophosphate, 3-phosphoglycerate
4-OHT 4-hydroxytamoxifen
4E-BP 4E-binding protein
6PGL 6-phosphogluconolactone
7AAD 7-Aminoactinomycin D
Abs Antibodies
AKT Protein kinase B (PKB)
AMPK 5' AMP-activated protein kinase ATCC American Type Culture Collection
BrdU 5-bromo-2'-deoxyuridine
BSA Bovine serum albumin
CBP80 cap-binding protein 80
CDKN2A Cyclin-Dependent Kinase Inhibitor 2A
4
CE-TOFMS Capillary electrophoresis time-of-flight mass spectrometry
DAB 3,3 ′ -Diaminobenzidine
DMSO Dimethyl sulfoxide
eEF2K Eukaryotic translation elongation factor 2 kinase
EGF Epidermal growth factor
EGFR Epidermal growth factor receptor eIF Eukaryotic Initiation Factor
eIF4B Eukaryotic translation initiation factor 4B EMT Epithelial- mesenchymal transition
EtOH Ethanol
F1,6BP Fructose 1,6-bisphosphate
FBS Fetal bovine serum
FCCP Carbonyl cyanide 4-
(trifluoromethoxy)phenylhydrazone
FDA US Food and Drug Administration
FGF2 Fibroblast Growth Factor 2
5
G6P Glucose-6-phosphate
GAP GTPase-Activating Protein
GBM Glioblastoma
GFAP Glial fibrillary acidic protein GICs Glioma initiating cells
Glut1 Glucose transporter 1
Grb10 Growth factor receptor-bound protein 10
Hk2 hexokinase2
huKO humanized Kusabira-Orange
MDM2 Mouse double minute 2 homolog
mTORC1 Mammalian target of rapamycin complex 1
Nf1 Neurofibromin 1
NSPCs Primary neural stem/progenitor cells
OCR Oxygen consumption rate
p53 Tumor protein p53
p70S6K p70 ribosomal protein S6 kinases
6
PBS Phosphate-buffered saline
PDGFR Platelet-derived growth factor receptor
PEP Phosphoenol pyruvate
PGC1α PPAR-γ coactivator 1α PI3K Phosphoinositide-3-kinase
PKM2 Pyruvate kinase isoenzyme type M2 PTEN Phosphatase and tensin homolog PVDF Polyvinylidene difluoride
RB1 Retinoblastoma 1
ROS Reactive oxygen species
RTK Receptor tyrosine kinases
Ru5P Ribulose-5-phosphate
S6 Ribosomal protein S6
S7P Sedoheptulose 7-phosphate
SVZ Subventricular zone
TAM Tamoxifen
7
Tsc1 Tuberous Sclerosis 1
TuJ1 Neuron-specific class III beta-tubulin
Ulk1 Unc-51 Like Autophagy Activating Kinase 1
WHO World Health Organization
8
Abstract
Although abnormal metabolic regulation is a critical determinant of cancer cell behavior, it is still unclear how an altered balance between ATP production and consumption contributes to malignancy. Here the results show that disruption of this energy balance efficiently suppresses aggressive malignant gliomas driven by mTOR complex 1 (mTORC1) hyperactivation.
In a mouse glioma model, mTORC1 hyperactivation induced by conditional Tsc1 deletion increased numbers of glioma-initiating cells (GICs) in vitro and in vivo. Metabolic analysis revealed that mTORC1 hyperactivation enhanced mitochondrial biogenesis, as evidenced by elevations in oxygen consumption rate (OCR) and ATP production. Inhibition of mitochondrial ATP synthetase was more effective in repressing sphere formation by Tsc1- deficient glioma cells than that by Tsc1-competent glioma cells, indicating a crucial function for mitochondrial bioenergetic capacity in GIC expansion.
To translate this observation into the development of novel therapeutics
targeting malignant gliomas, I screened drug libraries for small molecule
compounds showing greater efficacy in inhibiting the proliferation/survival
9
of Tsc1-deficient cells compared to controls. Several compounds able to preferentially inhibit mitochondrial activity, dramatically reducing ATP levels and blocking glioma sphere formation were identified. In human patient-derived glioma cells, nigericin, which reportedly suppresses cancer stem cell properties, induced AMPK phosphorylation that was associated with mTORC1 inactivation and induction of autophagy, and led to a marked decrease in sphere formation with loss of GIC marker expression.
Furthermore, malignant characteristics of human glioma cells were markedly
suppressed by nigericin treatment in vivo. Thus, targeting mTORC1-driven
processes, particularly those involved in maintaining a cancer cell’s energy
balance, may be an effective therapeutic strategy for glioma patients.
10
Introduction
Metabolic regulation
Abnormal metabolic regulation is critical for malignant transformation leading to cancer(1,2). In particular, a tumor cell must maintain a proper energy balance between ATP production and its consumption to support the cell’s heightened proliferation, survival and undifferentiated status.
Historically, it has been believed that, even in the presence of oxygen, cancer cells generate energy mainly by glycolysis rather than through mitochondrial oxidative phosphorylation (OXYPHOS), a concept known as the Warburg effect(3). However, several previous studies using tumor cells lacking mitochondrial DNA challenged the Warburg hypothesis, because these data showed that tumors depend on mitochondrial respiration for the maintenance of fully transformed malignant phenotypes(4-7).
Metabolic regulation and Mitochondrial Activity
Recent studies demonstrated that mitochondrial activity is essential for
malignant properties such as metastasis and multidrug resistance(8-10).
11
Accordingly, several small molecule compounds targeting mitochondrial function have been investigated for their anti-cancer effects(11). For example, numerous clinical studies of metformin, which inhibits mitochondrial complex I, have established the efficacy of this agent for cancer treatment.
Other compounds that decrease mitochondrial bioenergetic capacity also have anti-tumor effects, therefore, targeting mitochondrial energetics is deemed to be a promising basis for new cancer therapies.
Mammalian target of rapamycin (mTOR)
The mammalian target of rapamycin (mTOR) is a serine/threonine protein kinase that belongs to the phosphoinositide-3-kinase (PI3K)-related protein kinase family. mTOR participates in two complexes, designated mTOR complex 1 (mTORC1) and 2 (mTORC2), both of which phosphorylate multiple substrates(12-14).
Both mTOR complexes are large; mTORC1 having six regulatory proteins,
mammalian lethal with sec-13 protein 8 (mLST8, also known as GbL) with
unknown role and even their loss doesn’t affect mTORC1 activity to known
substrates, (DEPTOR) or DEP domain containing mTOR-interacting protein
12
which is mTORC1 inhibitor, and the Tti1/Tel2 complex regulating the assembly and stability of mTORC1. Unlike mTORC2, mTORC1 have two specific regulatory proteins, regulatory-associated protein of mammalian target of rapamycin (raptor) which has an important role in the regulation of mTORC1 stability, localization and binding to substrates. Finally, proline- rich Akt substrate 40 kDa (PRAS40) a mTORC1 inhibitor (12).
However, mTORC2 have seven known regulatory protein components, three of them are unique to mTORC2, rapamycin-insensitive companion of mTOR (rictor) which is very important in regulation of the assembly and substrate binding to mTORC2, mammalian stress-activated map kinase-interacting protein 1 (mSin1) regulating the assembly and interaction of mTORC2 to SGK1 protein, and protein observed with rictor 1 and 2 (protor1/2) increases mTORC2 mediated activation of SGK1. The remaining regulatory components of mTORC2, like mTORC1 are mLST8, DEPTOR, Tti1 and Tel2 complex (12).
mTORC1 signaling
Activation of PI3K via receptor tyrosine kinases (RTKs) leads to activation
13
of AKT. AKT phosphorylates tuberous sclerosis complex (TSC) 2 and blocks the GAP activity of the TSC complex. The TSC complex exhibits GAP activity towards the small G protein Rheb and inhibits its ability, therefore, TSC complex is a negative regulator of mTORC1. Among mTORC1’s substrates are the p70 ribosomal protein S6 kinases (p70S6Ks), eukaryotic Initiation Factor (eIF), 4E-binding proteins (4E-BPs), Ulk1, Lipin1, and Growth factor receptor-bound protein 10 (Grb10).
Phosphorylation of 4E-BP1 by mTORC1 leads to its dissociation from eIF4E, allowing recruitment of eIF4G to the 5 ′ cap and translation initiation.
p70S6Ks phosphorylate ribosomal protein S6, eukaryotic translation elongation factor 2 kinase (eEF2K), cap-binding protein 80 (CBP80), and eukaryotic translation initiation factor 4B (eIF4B), all of which stimulate protein synthesis (15,16).
mTOR signaling and Mitochondrial activity
On one hand, mTORC1 activation induces aerobic glycolysis by up-
regulating pyruvate kinase isoenzyme type M2 (PKM2). On the other hand,
mTORC1 activation stimulates several pathways that contribute to
14
mitochondrial activation and OXYPHOS. For example, mTORC1 is crucial for the mitochondrial activation mediated by PPAR-g coactivator 1a (PGC1a) and the transcription factor Ying-Yang 1 (YY1)(15,16). Another study has demonstrated that mTORC1 stimulates the synthesis of nucleus- encoded mitochondrial proteins via 4E-BPs, resulting in increased mitochondrial ATP production(17). Since mRNA translation is the most energy-consuming process in the cell, mTORC1 coordinates both energy consumption and production, contributing to malignant progression.
Glioblastoma
Glioblastoma (GBM) is the most common high-grade malignant glioma in
humans. GBM is categorized as a WHO grade IV astrocytoma, a very
aggressive, invasive and destructive brain tumor (18). The major problem in
glioma therapy is due to the infiltrative behavior of glioma cells and its
ability to transfer into normal brain regions. Although the recent advances in
the treatment of glioma, the number of patients diagnosed with glioma
increase with a maximum survival of one year to one and half year. These
recent methods in glioma therapies, like genetic screening of glioma tissues
15
or identification of signaling and molecular pathways involved in the development of glioma continues to have several challenges (19).
Glioma stem cells
Stem cells can be defined as the cells have the ability to self- renewal and differentiation into mature cells of a particular tissue. Stem cells are rare in most tissues. As a result, isolation of stem cells is very difficult and to study the biology and characteristics of stem cells, they must be isolated, purified and identified very carefully (20).
It is clear that normal stem cells and cancer sharing the self-renewal ability.
There are many evidences show that cancer and normal stem cells sharing a lot of signaling pathways which is involved in regulation and development.
From these pathways, the Notch signaling pathway, Sonic hedgehog pathway and Wnt signaling which are involved in oncogenesis in cancer tissues, these pathways may be involved also in the regulation of self- renewal of normal tissue stem cells (21).
The presence of cancer stem cells was first identified in the acute myeloid
leukaemia (AML). In that study, the cell surface markers were used to
16
identify AML stem cells from the rest AML cells, which had a less proliferative capacity. More recent, the principle of cancer stem cells has been extended to different types of cancers such as, breast cancer and glioblastoma. The advances in research indicate that many types of tumor cells can be organized into hierarchies, containing malignant cancer stem cells, which have a high proliferative capacity, to more differentiated tumor cells, with a lower proliferative ability (22).
Numerous studies have identified a tumor cell population that can initiate glioma development. These cells are called glioma-initiating cells (GICs) and are conceptually recognized as “glioma stem cells”(23). It is the behavior of these GICs that determines the malignant phenotypes of GBM.
Genetic mutations in GBM
Alterations in several signaling cascades are known to affect gliomagenesis,
including the RTK/RAS/PI3K pathway (EGFR, PDGFR, Nf1 and PTEN),
the p53 pathway (TP53, CDKN2A/ARF and MDM2), and the RB pathway
(RB1, CDKN2A/p16INK4A, CDKN2B and CDKN2C)(24). Consistent with
the fact that activation of most of oncogenic signals triggers mTORC1
17
activation, the phosphorylation status of substrates of mTORC1 is a prognostic indicator for glioma patients(25-27).
mTORC1 signaling in GBM
Although the mTORC1 pathway is clearly a major player in gliomagenesis
and malignant progression, mTORC1 inhibitors such as rapamycin and its
analogs have failed to successfully treat GBM patients in the clinic. It is
speculated that a feedback loop may exist in which mTOR inhibition by the
allosteric inhibitors stimulates PI3K activation, supporting survival of tumor
cells. Moreover, although mTOR ATP-competitive inhibitors and
PI3K/mTOR inhibitors that fully inhibit substrate phosphorylation have been
developed(28), these compounds are likely to have unwanted side-effects
and may cause serious damage to normal tissues. Therefore, there is a
pressing need to devise novel approaches to providing effective GBM
therapy.
18
Aim of the present study
Previously, It has been reported that hyperactivation of mTORC1 in a murine inducible Tsc1 gene deletion resulted in early tumor onset in an EGFRvIII- driven mouse glioma model (p16
Ink4ap19
Arfdeficient background)(29). In that glioma model, Tsc1 deletion increased tumor mass and enhanced microvascular formation leading to intracranial hemorrhage, indicating that mTORC1 hyperactivation promotes malignant phenotypes of glioma in vivo.
In the present study, first aim is to investigate the molecular mechanism by
which mTORC1 hyperactivation causes the malignant phenotypes of glioma
cells. Second aim is to identify small molecule compounds that may be
effective for GBM therapy.
19
Materials and Methods
Mice
Rosa26-CreERT2 mice were the kind gift of Dr. Tyler Jacks (Massachusetts Institute of Technology). p16
Ink4a+/-p19
Arf+/-mice were obtained from the Mouse Models of Human Cancers Consortium of NCI-Frederick (30,31).
Tsc1
f/fmice were purchased from the Jackson Laboratory. For transplantation experiments using mouse and human glioma cells, BALB/c nu/nu mice (4-week-old females) were purchased from Sankyo Laboratory Service. All animal experiments were approved by the Committee on Animal Experimentation of Kanazawa University and performed following the University’s Guidelines for the Care and Use of Laboratory Animals.
Mouse glioma model
Glioma-bearing mice were established as previously described(29). Briefly,
primary neural stem/progenitor cells (NSPCs) were isolated from
subventricular zone (SVZ) regions of Tsc1
f/f; Rosa26-CreER
T2mice
(p16
Ink4a-/-p19
Arf-/-background) and cultured in Coaster Ultra-low attachment
20
plates (Corning) in serum-free NSPC medium, which contained DMEM/F12, B27 and 50 U/ml penicillin/ 0.5% streptomycin (all from Life Technologies), plus 20 ng/ml human FGF2 (Wako) and 20 ng/ml human EGF (Sigma). For preparation of retrovirus carrying EGFRvIII, Plat-E cells, provided by Dr.
Toshio Kitamura (Institute of Medical Science, University of Tokyo), were transfected with pGCDN-EGFRvIII-IRES- humanized Kusabira-Orange (huKO), provided by Dr. Masafumi Onodera, National Research Institute for Child Health and Development (32). Retrovirus-containing supernatants were concentrated by centrifugation at 6,000xg for 16 hr. Cultured primary NSPCs were infected with pGCDN-EGFRvIII-IRES-huKO-expressing retroviruses for 24 hr and maintained in culture until transplantation.
EGFRvIII-transduced NSPCs were dissociated into single cells, resuspended
in 5% FBS/PBS, and 1x10
4cells were inoculated into the brains of
anesthetized Balb/c nu/nu mice. For nigericin treatment in vivo, 1x10
6huKO
+cells (Tsc1
f/f; Rosa-CreER
T2) were subcutaneously transplanted into
female Balb/c nu/nu mice. To delete the Tsc1 gene in tumor cells in vivo,
recipient mice were injected intraperitoneally (ip) with 1 mg/day tamoxifen
(TAM, Sigma) or vehicle control (corn oil, Sigma) for 4 days. To isolate
21
glioma cells, tumor tissues were dissociated with the Brain Tumor Dissociation Kit (Miltenyi Biotec) and huKO
+cells were sorted using a BD FACSAria III instrument (BD). For transplantation of glioma cells, 100, 1,000 or 10,000 huKO
+cells were inoculated into the brains of recipient mice.
Cell culture
To delete the Tsc1 gene in mouse glioma cells in vitro, huKO
+cells (Tsc1
f/f; Rosa-CreER
T2) were cultured for 3 days in complete NSPC medium (containing EGF+FGF2) plus 0.1 µM 4-hydroxytamoxifen (4-OHT, Sigma).
Cultures were washed clean of 4-OHT and cultured for another 2 days in complete NSPC medium. For sphere formation assays, single-cell suspensions were prepared using Accutase (Innovative Cell Technologies, Inc.) and filtered through a 40-µm cell strainer (BD), followed by culture for 7 days in NSPC medium with or without EGF+FGF2 and containing 1%
methylcellulose (Wako). Human patient-derived GBM cells, termed TGS-
01 and TGS-04, were established as described previously(33). Use of these
human materials and protocols were approved by the Ethics Committees of
Kanazawa University and the University of Tokyo. To increase pyruvic acid
22
level in glioma cells, sodium pyruvate stock solution (100 mM, Thermo Fisher Scientific) was added to normal NSPC medium (final concentration was increased from 0.5 to 1.5 mM).
CD133 Expression
To determine CD133 expression in the human glioma TGS-01 human patient-derived cells, TGS-01 cells treated with 0.5µM nigericin in adherent cell culture condition for 4 days. Next, cells were collected, centrifuged and filtered. Filtered cells were stained with anti-CD133 antibody (Ab) (Miltenyi Biotec #130-098-129), incubated on ice for 30 min, and analyzed by flow cytometry.
Drug screening
Libraries used for drug screening were: FDA-approved drug library (ENZO;
CB-BML-2841J0100), ICCB known bioactives library (ENZO; CB-BML-
2840J0100), kinase inhibitor library (ENZO; CB-BML-2832J0100), fatty
acid library (ENZO; CB-BML-2803J0100) and phosphatase inhibitor library
(ENZO; CB-BML-2834J0100). To confirm the effects of individual
23
compounds, we assayed nigericin (Sigma Aldrich), amoxapine (Wako), A23187 (Sigma Aldrich), valinomycin (Sigma Alderich), rottlerin (Abcam), auranofin (Abcam), clodronic acid (Cayman), moxifloxacin (Sigma Aldrich), nifidipine (Sigma Aldrich), minocycline (Santa Cruz Biotechnology), clindamycin (Sigma Aldrich) and pentamidine (Sigma Aldrich). Briefly, control and Tsc1-deficient glioma cells were treated with a compound at three doses (1/500, 1/2,000, and 1/10,000 dilution of provided compounds in the library) in 384-well plates (Corning) for 48 hr, followed by analysis of cell viability as mentioned below. The "Index for drug sensitivity of Tsc1- deficient glioma cells" was calculated as the ratio of value2/value1 at a specific dose of a compound, where value1 was for the drug efficacy in Tsc1- deficient glioma cells (e.g., 0.2 means 80% reduction), and value2 was for the drug efficacy in control cells (e.g., 0.8 means 20% reduction). An Index
>1.0 means that Tsc1-deficient glioma cells were more sensitive than control
glioma cells to the drug. An Index <1.0 means that loss of Tsc1 induced drug
resistance.
24
Western blotting
Proteins were extracted with lysis buffer [0.1 M Tris (pH 6.7), 4% SDS, phosphatase inhibitor (Thermo Fisher Scientific), complete mini (Roche)]
and quantified using a bicinchoninic acid (BCA) protein assay kit (Thermo Fisher Scientific). Proteins (5 µg) were fractionated by SDS-PAGE and transferred onto 0.45 mm polyvinylidene difluoride (PVDF) membranes (Millipore). Membranes were blocked in 5% (w/v) BSA/0.02% (v/v) Tween 20/PBS and incubated with primary antibodies (Abs) overnight at 4°C, followed by incubation with HRP-conjugated secondary Abs (GE Healthcare) and detection with ECL Prime (GE Healthcare). Primary Abs recognizing the following proteins were used: Tsc1 (#4906), pp70S6K (T389) (#9234), p70S6K (#2708), pS6(S235/236) (#4858), S6 (#2217), p4E- BP1 (T37/46) (#2855), 4E-BP1 (#9644), pAMPK alpha (T172) (#2535), AMPK alpha (#2532) (all from Cell Signaling Technologies, 1:1000), actin (Sigma-Aldrich #A5441, 1:2000), Nestin (Millipore #AB5922, 1:500), Olig2 (IBL #18953, 1:500), GFAP (BD #556328, 1:1000) , TuJ1 (Covance
#MMS-435P,1:1000) and LC3 (NanoTools clone 5F10, #0231, 1:200).
25
PCR
Total RNA was extracted using the RNeasy Mini Kit (Qiagen). Total RNA was reverse-transcribed to cDNA using Super Script Reverse Transcriptase (Life technologies). Genomic and mitochondrial DNAs were extracted with 50 mM NaOH followed by neutralization with 1 M Tris-HCl. Real-time quantitative PCR was performed with Mx3000P (Stratagene). The following cycle parameters were used: denaturation at 95˚C for 30 sec, annealing for 30 sec at 58˚C, and elongation for 30 sec at 72˚C. Sequences of sense and antisense primers used were as follows:
Slc2a1 sense; 5`CAGTTCGGCTATAACACTGGTG3`, Slc2a1 antisense;
5`GCCCCCGACAGAGAAGATG3`, Hk2 sense;
5`TGATCGCCTGCTTATTCACGG3`, Hk2 antisense;
5`AACCGCCTAGAAATCTCCAGA3`, Pkm2 sense;
5`GCCGCCTGGACATTGACTC3` , Pkm2 antisense;
5`CCATGAGAGAAATTCAGCCGAG3`, Atp5g1 sense;
5`CCAGAGGCCCCATCTAAGC3`, Atp5g1 antisense;
5`CCCCAGAATGGCATAGGAGAAG3`, Cox5a1 sense;
26
5`GCCGCTGTCTGTTCCATTC3`, Cox5a1 antisense;
5`GCATCAATGTCTGGCTTGTTGAA3`, Cycs sense;
5`CCAAATCTCCACGGTCTGTTC3`, Cycs antisense;
5`ATCAGGGTATCCTCTCCCCAG3`, Actb sense;
5`GGCTGTATTCCCCTCCATCG3`, Actb antisense;
Intracellular ATP quantification
Intracellular ATP levels were quantified using the CellTiter-Glo Luminescent Cell Viability Assay (Promega) following the manufacturer’s instructions. Briefly, cells were cultured in 96- or 384-well Ultra low attachment plates (Corning), and the luminescence representing the ATP level was measured by Infinite Pro 200 (Tecan).
Cell viability assay
Cell viability was assessed using the Cell Counting Kit-8 (Dojindo)
following the manufacturer’s instructions. Briefly, cells were incubated with
WST-8 reagent for 3 hrs and absorbance at 450 nm was compared using
Infinite Pro 200 (Tecan).
27
Quantification of metabolites
For capillary electrophoresis time-of-flight mass spectrometry (CE-TOFMS) analysis, three independent samples of control or Tsc1-deficient mouse glioma cells (3×10
6) that had been cultured in NSPC medium without EGF+FGF2 were lysed with methanol (1 ml) containing 25 µM internal standards (L- methionine sulfone, MES and CSA)(Wako), and homogenized to inactivate enzymes. The sample (400 µl) was transferred to a fresh tube, and 200 µl of chloroform was added. The mixture was centrifuged at 10,000
× g for 3 min at 4°C, and 400 µl of the upper aqueous layer was centrifugally
filtered through a Millipore 5-kDa cutoff filter to remove proteins. The filtrate samples (320µl) were lyophilized and dissolved in 25 µl Milli-Q water containing 200 µM reference compounds (3-aminopyrrolidine, Adlrich, and trimesate, Wako) prior to CE-TOFMS analysis (34,35).
Mitochondrial membrane potential
To determine mitochondrial membrane potential, cells were treated for 30
min with small molecule compounds at the concentrations indicated in the
Figure legends, followed by incubation with JC-10 dye buffer (Abcam) for
28
30 min at 37°C in 5% CO
2.Measurements of membrane potential were performed by flow cytometry.
Apoptosis
For Annexin V staining, TGS-01 human patient-derived glioma cells were treated with 1 µM nigericin for 6 hr, Then, cells incubated with PE- conjugated Annexin- V and 7AAD in Annexin V binding buffer (BD Biosciences) in accordance with the manufacturer’s protocol. Measurements of Apoptosis were performed by flow cytometry.
Reactive oxygen species (ROS) generation
For analysis of mitochondria-derived ROS, cells were treated with 1 µM
nigericin for 6 hr, incubated with 5 µM Mitosox Red (Life Technologies) for
30 min, washed twice with 5% FBS/PBS, and stained with 7AAD (BD
Biosciences) to exclude dead cells. Measurements of ROS were performed
by flow cytometry.
29
Oxygen consumption assay
The OCR was measured using an XF24 Extracellular Flux Analyzer (Seahorse Bioscience) according to manufacturer's protocol. For analysis of the effects of small molecule compounds on OCR, AGS cells (a human gastric cancer cell line, from ATCC) were seeded at 4x10
4cells/well in 500 µl supplemented culture medium (DMEM, Seahorse Bioscience
#102365). OCR was measured at preset time intervals while the instrument automatically carried out preprogrammed additions of oligomycin (1 µM, Cell Signaling Technology #9996), FCCP (400 nM, Sigma #C2920) and antimycin A (1 µM, Sigma #A8674).
Cell cycle analysis
Cell cycle analysis was performed as previously described(36). Briefly,
BrdU (10 µM) was added to the cultures and incubation continued at 37ºC
for 30 min. Cells were collected and washed with PBS, followed by the
addition of 70% EtOH (-30ºC) for 16 hr. Cells were then incubated with 2N
HCl/0.5% Triton X-100 for 30 min at room temperature (RT), followed by
treatment with 0.1 M borax buffer (10 mM borax, 50 mM boric acid) for 2
30
min at RT. Cells were stained with anti-BrdU-FITC Ab (BD Biosciences) for 1 hr at RT while avoiding light. Labeled cells were resuspended in PBS containing 1% bovine serum albumin and 7AAD (BD Biosciences), followed by cell cycle analysis by flow cytometry.
Tumor xenografts
Cells (1x10
6/100µl/inoculation site) were mixed with Matrigel Matrix (Fisher Scientific, Corning, NY, USA, no. 356234) (1:1.4 ratio) and subcutaneously transplanted into each of the two flanks of anesthetized female Balb/c nu/nu mice. Nigericin (4 mg/ml) or auranofin (12 mg/ml) dissolved in DMSO was mixed with corn oil (1:4 ratio). Nigericin (4 mg/kg/day, ip injection, every 2 days) or auranofin (12 mg/kg/day for 2 days, ip injection) was administered on day 1 after inoculation of TGS-01 cells.
Tumor volume was measured using a conventional formula: volume (V) = (W
2× L)/2 where W=width and L=Length.
Immunohistochemistry
Tumors derived from xenografted patient-derived GBM cells were fixed
with 4% paraformaldehyde at 4
oC overnight and embedded in paraffin.
31
Sections were stained with hematoxylin and eosin (HE). For immunostaining, sections were treated with Target Retrieval Solution (Dako), and stained with anti-Ki67 (BD#550609, 1:100), followed by visualization with a HRP- conjugated secondary Ab (GE Healthcare) and the DAB Peroxidase Substrate Kit (VECTOR). Stained sections were counterstained with hematoxylin and viewed using a microscope (Axio ImagerA1, Carl Zeiss).
Statistical analyses
Student’s t test was used when comparing two groups, one-way (ANOVA)
followed by Bonferroni’s post hoc test when comparing more than two
groups. For survival analysis in Fig.1C, differences in survival rate were
analyzed by log-rank test. Calculations of significance were performed using
Prism6 software: *P < 0.05, **P < 0.01, ***P < 0.001, ****P < 0.0001.
32
Results
mTORC1 hyperactivation expands mouse GICs in vitro and in vivo To investigate the role of mTORC1 in GIC expansion, the previously described mouse glioma model in which mTORC1 is activated by a TAM- inducible system(29) was used. Briefly, NSPCs of Tsc1
f/f; Rosa26-CreER
T2mice (p16
Ink4a-/-;p19
Arf-/-background) were infected with retrovirus carrying EGFRvIII gene plus the huKO gene as a marker and injected these infected cells into the basal ganglia of immunocompromised mice. To activate mTORC1 in glioma tissue in vivo, TAM was administrated to NSPC-bearing recipient mice on day 5 post-transplantation. After gliomas had developed (at about 3 weeks post-transplantation), huKO
+cells were collected from digested brain tissues of recipient mice and isolated glioma cells by flow cytometry. Efficient deletion of the Tsc1 gene in this system has been previously confirmed by genomic DNA analysis(29).
To determine whether Tsc1 deficiency affected sphere formation,
huKO
+cells were cultured in ultra-low attachment dishes under standard
NSPC culture conditions; that is, in the absence of serum but presence of the
33
growth factors, EGF and FGF2. Tsc1 deficiency significantly increased the number of spheres formed (Fig.1), indicating that the sphere-forming cells had expanded upon mTORC1 activation.
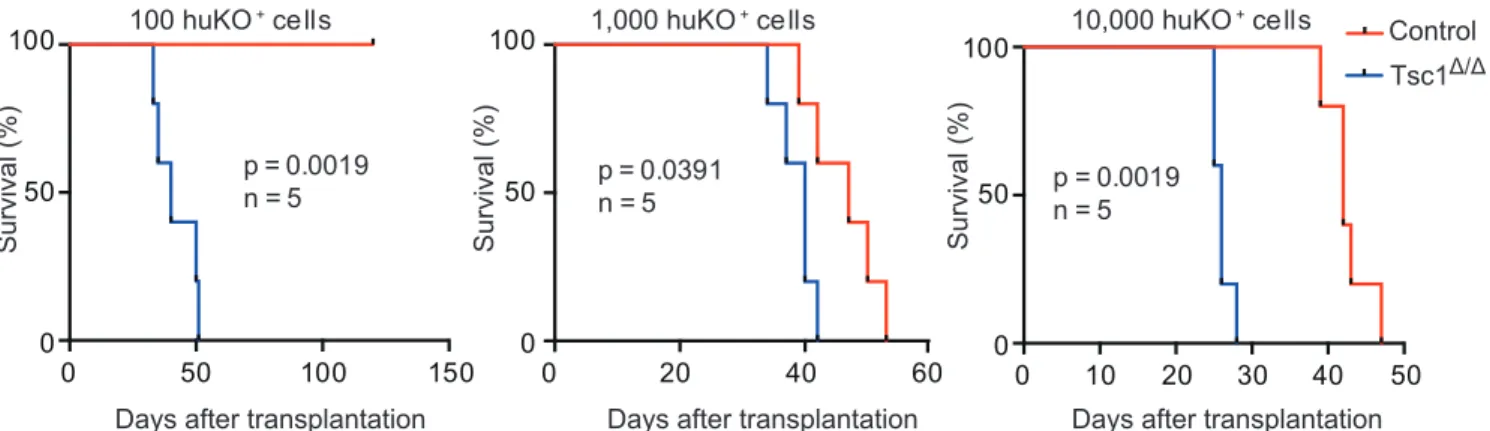
To evaluate the tumor-initiating capacity of glioma cells in vivo, recipient mice were inoculated with 100, 1,000 or 10,000 freshly isolated huKO
+glioma cells. It has been found that Tsc1 deficiency promoted tumor development and accelerated the death of recipients compared to Tsc1- competent glioma cells (Fig.2). When as few as 10 huKO
+cells were transplanted, only Tsc1-deficient glioma cells were capable of producing gliomas, but not control cells. Thus, GIC frequency is increased in vivo by mTORC1 activation.
mTORC1 activation causes growth factor-independent proliferation of mouse GICs
To investigate how mTORC1 activation affects the proliferation and survival
of murine GICs, the effect of Tsc1 deletion on sphere formation in vitro was
analyzed. Tsc1
f/f; Rosa26-CreER
T2glioma cells were allowed to form
spheres in culture and then 4-OHT was added to delete the Tsc1 gene. First,
34
4-OHT efficiently induced Tsc1 deletion in these sphere cells was confirmed, as evidenced by the disappearance of Tsc1 protein from lysates of sphere cells that had been cultured with 4-OHT (Fig.3). However, unexpectedly, there was no difference in the number of spheres formed by control and Tsc1- deficient cells cultured in the presence of EGF+FGF2 (Fig.4). This discrepancy may be due to differences between culture conditions in vitro and microenvironmental conditions in vivo. Although level of phosphorylation in 4E-BP1 was slightly up-regulated, those of S6 and p70S6K were almost normal in Tsc1-deficient glioma cells cultured under these conditions (Fig.3). It is speculated that, mTORC1 is fully activated when cytokines are abundant, and that levels of these factors are much higher in vitro than in vivo, therefore, Tsc1 deletion might not be able to further
enhance such signaling in this culture condition. When control and Tsc1-
deficient glioma cells were cultured in the absence of EGF+FGF2, the size
and number of spheres formed in these control glioma cell cultures was
decreased compared to those in control cultures containing growth factors,
however, Tsc1-deficient glioma cells showed comparable sphere forming
capacity in presence and absence of these growth factors (Fig4). Thus,
35
mTORC1 hyperactivation maintains sphere-forming capacity even when growth factors are withdrawn. Consistent with this observation, although levels of S6 and 4E-BP phosphorylation in control glioma cells cultured without growth factors were lower than those with growth factors, such down-regulation of phosphorylation due to growth factor depletion was not observed in Tsc1-deficient cells (Fig.3). Since the results did not show a remarkable change in the expression of Olig2, a glioma stem cell marker, in Tsc1-deficient glioma cells (Fig.5), which assume that Tsc1 deficiency promotes the proliferation and/or survival of GICs. Thus, mTORC1 hyperactivation induces GIC expansion that is independent of growth factors.
Increased sensitivity of Tsc1-deficient glioma cells to glucose depletion
Next the mechanism by which mTORC1 activation affects GIC growth in
mouse glioma model was dissected. Although the metabolic status of whole
glioma cells might not necessarily be identical to that of GICs due to tumor
heterogeneity, metabolite levels were assessed in control and Tsc1-deficient
glioma cells in culture in vitro using CE-TOFMS (34,35). Several
metabolites in the glycolytic pathway, including glucose-6-phosphate (G6P),
36
fructose 1,6-bisphosphate (F1,6BP), glycerophosphate, 3-phosphoglycerate (3PGA), and phosphoenol pyruvate (PEP), were significantly up-regulated (Fig.6). The same was true for components of the pentose phosphate pathway, including 6-phosphogluconolactone (6PGL), ribulose-5-phosphate (Ru5P), and sedoheptulose 7-phosphate (S7P) (Fig.6). These findings suggested that glucose metabolism might be stimulated in Tsc1-deficient cells.
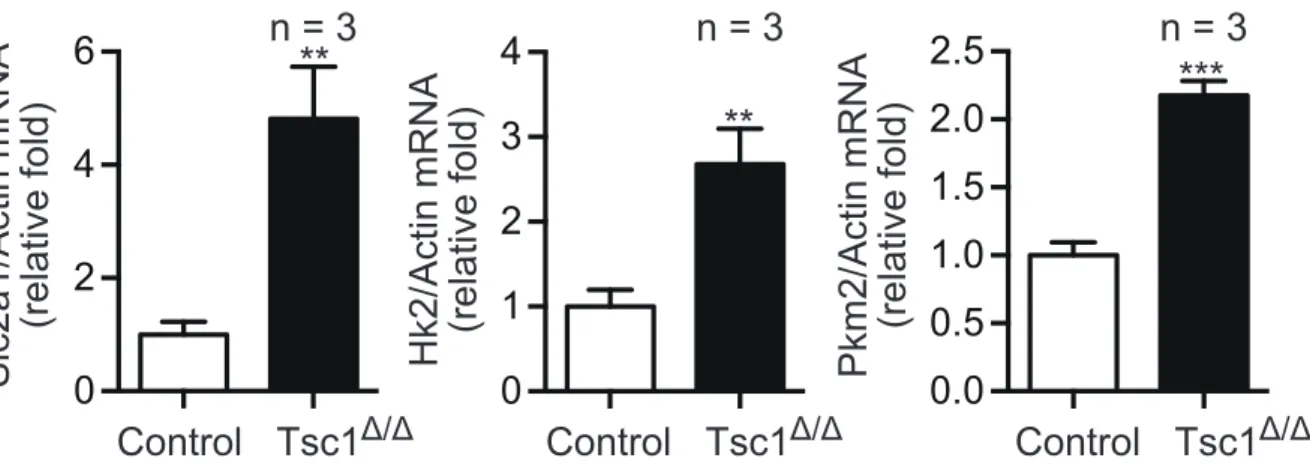
When gene expression levels were analyzed, Results showed that mRNAs encoding glycolytic enzymes such as glucose transporter 1 (Glut1), hexokinase2 (Hk2), and pyruvate kinase M2 (PKM2) were all elevated by mTORC1 activation (Fig.7). These data indicate that mouse glioma cells experiencing mTORC1 hyperactivation show increased dependence on glucose.
Enhanced mitochondrial ATP production supports mTORC1-driven GIC expansion
Metabolomics analysis showed that lactate levels in glioma cells were not
significantly affected by Tsc1 deletion (Fig.6). These data suggested that the
increased glucose uptake exhibited by Tsc1-deficient cells might contribute
37
to enhanced mitochondrial OXPHOS rather than to the production of lactate via typical glycolysis. To determine OXPHOS in these cells, OCR was evaluated and found that it was significantly increased in Tsc1-deficient glioma cells (Fig.8). In addition, the expression levels of mitochondria- associated genes were up-regulated by Tsc1 deletion (Fig.9). Consistent with this enhanced mitochondrial activity, ATP levels were increased in Tsc1- deficient cells compared to controls (Fig.10, left). To assess whether this increase in ATP in Tsc1-deficient cells was in fact due to enhanced OXPHOS, the cells were treated with oligomycin, an ATP synthetase inhibitor.
Interestingly, while oligomycin had only a modest effect on ATP levels in control cells, it dramatically reduced ATP levels in Tsc1-deficient cells (Fig.10, right).
Consistent with the marked ATP reduction in oligomycin-treated
Tsc1-deficient glioma cells, oligomycin also profoundly suppressed sphere
formation by Tsc1-deficient cells compared to controls (Fig.11). These
results indicate that mTORC1 hyperactivation stimulates mitochondrial ATP
production that is vital for the vigorous expansion of GICs.
38
Drug screening to identify small molecule compounds that can suppress sphere formation by Tsc1-deficient mouse glioma cells
The new application of a known drug, called drug repositioning or drug repurposing, has been a beneficial approach for developing novel therapies for human diseases. With this in mind, I assessed whether this mouse glioma model would be useful for drug screening to identify known compounds able to specifically inhibit the aggressive phenotypes of glioma cells. To this end, I evaluated the effects of numerous small molecule compounds from commercially available existing drug libraries (a total of 1,301 compounds) on the proliferation/survival of control and Tsc1-deficient mouse glioma cells. To compare the efficacy of an individual compound on control vs.
Tsc1-deficient cells, First the inhibitory effect was estimated for each compound on both types of cells, and then the ratio of the inhibitory effect on Tsc1-deficient cells compared to its effect on control cells was calculated;
this ratio was termed the "Index for drug sensitivity of Tsc1-deficient cells"
(see Experimental Procedures).
Most compounds screened exhibited an Index of about 1.0 ± 0.5
(Fig.12), indicating that they had equal effects on control and Tsc1-deficient
39
cells. Several compounds showed low Index values, suggesting that these drugs were less effective in inhibiting the growth of Tsc1-deficient cells than that of control cells. For example, I found that the EGFR inhibitors gefitinib and erlotinib showed less efficacy in Tsc1-deficient cells than in control cells (Fig.13). Several genotoxic reagents, including mitoxantrone and topotecan, were also less efficacious in Tsc1-deficient cells (Fig.14), suggesting that mTORC1 hyperactivation allows glioma cells to resist conventional chemotherapy. In contrast to the above, several compounds were identified that were highly effective in inhibiting the growth of Tsc1-deficient glioma cells compared to that of control cells (Fig.15).
From the first screening, 13 drugs were selected (nigericin, amoxapine, A23187, auranofin, rottlerin, valinomycin, minocycline, nifedipine, pentamidine, cyclosporine, clodronic acid, clindamycin and moxifloxacin) that showed reproducible increased efficacy in Tsc1-deficient cells compared to controls. The concentrations of these compounds used in this screening was approximately 0.5-30 µM.
Next, I screened the selected compounds for those that caused a
greater reduction in intracellular ATP levels in Tsc1-deficient cells, based on
40
the previous observation that oligomycin treatment triggered a significant reduction in ATP in the former. I found that 5 drugs (nigericin, A23187, auranofin, rottlerin and valinomycin) clearly reduced intracellular ATP levels when used at less than 20 µM (Fig.16). Most of these drugs showed greater inhibitory effects on Tsc1-deficient cells than on control cells, although there were differences in efficacy among these compounds. I confirmed that these 5 compounds also had a greater suppressive effect on sphere formation by Tsc1-dificent glioma cells than on that by control cells (Fig.17), suggesting that the screening system could efficiently identify drug candidates in therapeutic approach for mTORC1-driven glioma.
To investigate whether the selected compounds could affect the
behavior of human GBM cells as well as mouse Tsc1-deficient glioma cells,
I applied each agent to human patient-derived GBM cell lines (TGS-01 and
TSG-04 cells). Although it is unclear exactly which GBM sub-type these
cells represent, they appear to have characteristics similar to the proneural
type (rather than to the mesenchymal type) because they express relatively
high levels of CD133, which is a proneural sub-type marker(37). A recent
proteomics analysis has demonstrated that, compared to mesenchymal
41
GBMs, proneural GBMs show elevated expression and activation of elements of the PI3K-AKT-mTORC1 pathway(24). Therefore, like the Tsc1- deficient mouse glioma cells used in this study, human TGS-01 and TSG-04 GBM cells may exhibit relatively high levels of mTORC1. I found that all the 5 drug compounds reduced ATP in TGS-01 cells compared to untreated GBM cells (Fig.18).
All compounds also induced abnormality in mitochondrial
membrane potential (Fig.19). Nigericin (a K
+/H
+ion exchanger) induced
mitochondrial membrane hyperpolarization, as previously reported(38),
whereas A23187 (Ca
2+ionophore), rottlerin (K
+ionophore) and valinomycin
(K
+ionophore) triggered depolarization (Fig.19), indicating that an
abnormality of ion channels causes mitochondrial dysfunction. Cells
exposed to auranofin, a gold (I)-phosphine derivative used to treat
rheumatoid arthritis, also showed depolarization, because this agent
reportedly induces the mitochondrial membrane permeability transition,
which is manifested as mitochondrial swelling and loss of membrane
potential(39). This means that treatment with most of these selected
compounds might drive down intracellular ATP levels by interfering with
42
mitochondrial ATP production.
Since it was previously reported that nigericin and valinomycin affect mitochondrial respiratory chain (40), Conferment of their effects was performed. After downregulation of OCR by ATP synthase inhibition (oligomycin treatment), it was recovered by valinomycin (as expected), because valinomycin is an uncoupler (Fig.20). In contrast, nigericin treatment blocked the respiratory chain and maintained its suppression even after addition of FCCP (an uncoupler), indicating that nigericin is an efficient inhibitor of mitochondrial bioenergetics. Thus, compounds selected by a combination of the “Index for drug sensitivity in Tsc1-deficient mouse glioma cells” and their effects on ATP levels induce mitochondrial dysfunction. These data demonstrate that the drug screening system used in this study can efficiently select small molecule compounds capable of disrupting a glioma cell’s energy balance.
Nigericin suppresses malignant phenotypes of human patient-derived GBM cells
Next I investigated whether the selected compounds might have therapeutic
43
potential for human GBM. Among the candidates, nigericin has previously
been selected by a drug screening program as being capable of targeting
cancer stem cell properties, which are induced by the epithelial-
mesenchymal transition (EMT). Therefore, I focused on nigericin to
determine if this compound could have advantage in suppression of
malignant phenotypes of human GBM cells in vitro and in vivo. I found that
nigericin could indeed effectively reduce sphere formation by human GBM
cells in culture (Fig.21). While nigericin treatment blocked the cell cycle,
specifically S-phase entry as determined by BrdU incorporation (Fig.22), it
did not induce significant apoptosis (Fig.23). Mitochondrial ROS were up-
regulated in glioma cells as detected by MitoSOX (Fig.24), indicating that
nigericin induces mitochondrial dysfunction. Moreover, expression levels of
the glioma stem cell markers, Olig2 and CD133, were dramatically
downregulated during culture with nigericin (Fig.25, 26). These data
indicate that nigericin suppresses proliferation of GBM cells, associated with
the loss of stem cell properties. Interestingly, nigericin clearly triggered
AMPK phosphorylation that was associated with marked inhibition of
phosphorylated S6K and 4EBP1 (Fig.27), suggesting that downregulation of
44
ATP levels stimulates an anti-tumor signaling cascade that includes AMPK activation and mTORC1 inactivation. mTOR inhibition and AMPK activation are both known to induce autophagy(12), and, as expected, nigericin dramatically induced autophagy in glioma cells as determined by an observed increase in the LC3-II/LC3-I ratio (Fig.27).
To investigate whether nigericin inhibits sphere formation due to abnormality in energy control, concentration of sodium pyruvate was increased in culture media, because pyruvic acid supplies energy to cells through the OXYPHOS in the presence of oxygen. As a result, addition of sodium pyruvate mitigated the inhibitory effect of low concentration, but not higher concentration (>0.1 µM), of nigericin on sphere formation (Fig.28).
These data suggest that low dose of nigericin inhibits sphere formation due to partial, but not complete, impairment of mitochondrial energy production.
Although remarkable changes of energy signals were not observed with such low dose of nigericin, presumably due to subtle changes below detectable limits, these data support an idea that energy imbalance causes dysfunction of GICs.
Lastly, I determined whether nigericin administration could inhibit
45
glioma growth in vivo. Immunocompromised mice were injected with human GBM cells and tumor development was monitored. Indeed, tumor volume (Fig.29) was greatly reduced in nigericin-treated recipient mice.
Histological analyses showed that important histological hallmarks for GBM malignancy, such as remarkable vasculature formation and pseudopalisading necrosis, were observed in control tumor tissues. In contrast, these malignant characteristics dramatically disappeared by nigericin treatment in vivo (Fig.30). Also, results showed down-regulation of Ki67 staining, by nigericin treatment in vivo (Fig.31). When the effect of nigericin on tumor cell growth in recipient mice bearing Tsc1
Δ/Δor control mouse glioma cells were evaluated, I found that nigericin profoundly suppressed the growth of Tsc1-deficient tumors in vivo, consistent with in vitro results (Fig.32).
In addition, when I evaluated the effects of other candidate agents
auranofin, A23187, Rottlerin and valinomycin on human GBM cells, I found
that all of these compounds suppressed sphere formation on both human
patient derived glioma cell lines TGS-01 and TGS-04 (Fig.33,34). Then,
auranofin was selected to perform an in vivo experiment because this agent
has been clinically approved for treatment of rheumatoid disease as
46
mentioned above. auranofin treatment of glioma-bearing mice resulted in a significant reduction in GBM growth in vivo (Fig.35). Like nigericin, Histological analyses after auranofin treatment showed a remarkable reduction in vasculature formation and pseudopalisading necrosis which observed in control tumor tissues, but not in auranofin treated tissues (Fig.
36). Immunohistochemical analysis showed a clear reduction in the proliferation as evidenced by the proliferation marker ki67 after auranofin treatment in vivo (Fig.37).
These data clearly indicate that this screening system based on an
mTORC1-driven glioma model is useful for selecting compounds able to
target aggressive malignant gliomas.
47
0 20 40
60 n = 5 **
Sphere number/300 cells
Control Tsc1
Δ/ΔFigure 1. Sphere formation assay in control and Tsc1 deficient cells.
Quantitation of sphere formation by huKO
+cells isolated from recipient
mice that had been treated with (Tsc1
Δ/Δ) or without (control) TAM to delete
Tsc1. Data are the mean sphere number ± SD.
48 100 huKO+cells
0 50 100 150
0 50 100
Days after transplantation
Survival (%)
p = 0.0019 n = 5
0 20 40 60
0 50 100
p = 0.0391 n = 5
0 10 20 30 40 50
0 50 100
p = 0.0019 n = 5
1,000 huKO+cells 10,000 huKO+cells
Days after transplantation Days after transplantation
Survival (%) Survival (%)
Control Tsc1Δ/Δ
Figure 2. Tsc1 deletion leads to GIC expansion in vivo. Kaplan-Meier
analysis of survival of recipient mice inoculated with 100, 1,000 or 10,000
huKO
+cells that had been treated with (Tsc1
Δ/Δ) or without (control) TAM.
49
Figure 3. Tsc1 deletion and mTORC1 pathway. Western blot to detect the indicated proteins in control and Tsc1
Δ/Δcells. Deletion of Tsc1 gene in vitro was induced with 4-OHT treatment to prepare Tsc1
Δ/Δcells (see Experimental Procedures). Lysates were prepared from control and Tsc1
Δ/Δcells treated with/without EGF+FGF2 for 24 hr. Actin, loading control.
actin Tsc1
pp70S6K (T389) p70S6K S6 pS6 (S235/236)
p4E-BP1 (T37/46)
4E-BP1
EGF/FGF2 + + - -
Control Tsc1
Δ/Δ
Control Tsc1
Δ/Δ
kDa
150
37
37
70
70
20
15
20
15
37
50
0 50 100 150 200
S ph er e si ze (µ m )
0 50 100
*** 150 ***
Control
n = 3 n = 10
Sphere number/500 cells
Tsc1 Δ/Δ
EGF/FGF2 + - EGF/FGF2 + -
Figure 4. Expansion of GICs induced by Tsc1 deletion is independent of
growth factors. Quantitation of sphere formation of control and Tsc1
Δ/Δcells
cultured with/without EGF+FGF2. Data are the mean sphere number (left
panel) and size (right panel) ± SD.
51
Figure 5. Olig2 expression in control and Tsc1 deleted mouse glioma cells.
Western blot to detect Olig2 in control and Tsc1
Δ/Δcells cultured without EGF+FGF2 for 5 days.
actin 37 Olig2 37
Control Tsc1 Δ/Δ
52 Glc
G-6-P
F-6-P F-1,6-BP
G-3-P DHAP
G-1,3-BP 3-PGA 2-PGA
PEP Pyr
G-1-P
Glycolysis
6-PGL 6-PG
Ru-5-P X-5-P
Ri-5-P
S-7-P E-4-P
G-3-P 0
1 2 3 4 5
**
0.0 0.2 0.4 0.6 0.8
Lactate
0.0 0.1 0.2 0.3 0.4
0.5
***
0.0 0.2 0.4 0.6
0.8
**
0.00 0.05 0.10 0.15 0.20
0.0 0.2 0.4 0.6
0.8
***
Pentose Phosphate Pathway
Glycogen
0.0 0.1 0.2 0.3 0.4
0.5
***
UDP-Glc
0 1 2
3
*
Control
SerTsc1
Δ/Δnd: not detected
n = 3
nd
nd
nd
nd
nd
nd
nd
nd
nd
0 2 4 6
0.0 0.5 1.0
1.5
*
0.00 0.05 0.10 0.15
0.20
**
0.00 0.02 0.04 0.06
0.08
**
0.0 0.2 0.4
0.6
**
Figure 6. Metabolomics Analysis. Scheme showing quantitation of changes
to metabolites in the pentose phosphate and glycolysis pathways that were
associated with Tsc1 deletion in huKO
+cells. Control and Tsc1-deficient
cells were cultured without EGF+FGF2 and subjected to quantification of
metabolites. Data for each metabolite are the mean ratio ± SD relative to the
value in control cells.
53
0 2 4
6 **
0 1 2 3 4
**
0.0 0.5 1.0 1.5 2.0
2.5 ***
n = 3 n = 3 n = 3
Slc2a1/Actin mRNA (relative fold) Hk2/Actin mRNA (relative fold) Pkm2/Actin mRNA (relative fold)
Control Tsc1
Δ/ΔControl Tsc1
Δ/ΔControl Tsc1
Δ/ΔFigure 7. Gene expression analysis of Glycolysis associated genes. qRT-
PCR analysis of Glut1, Hk2, and Pkm2 mRNA levels in the control and Tsc1-
deficient cells. Data were normalized to b-actin and are presented as the
mean fold change ± SD relative to control cells.
54
0 50 100
150 n = 5
***
OCR (pmoles/min/10 4 cells)
Control Tsc1 Δ/Δ
Figure 8. Effects of Tsc1 deficiency on oxygen consumption in mouse
glioma cells. Quantitation of OCR by control and Tsc1-deficient cells
cultured without EGF+FGF2. Data are the mean ± SD.
55
Figure 9. Mitochondrial associated genes levels in control and Tsc1 deficient mouse glioma cells. qRT-PCR analysis of Atp5g1, Cox5a1, and cytochrome c mRNA levels. Data are the mean fold change ± SD relative to control cells.
0.0 0.5 1.0 1.5 2.0
***
0.0 0.5 1.0 1.5
2.0 **
0.0 0.5 1.0
1.5 **
n = 3 n = 3 n = 3
Atp5g1/Actin mRNA (relative fold) Cox5a1/Actin mRNA (relative fold) Cycs/Actin mRNA (relative fold)
Control Tsc1Δ/Δ Control Tsc1Δ/Δ Control Tsc1Δ/Δ
56
Figure 10. Effects of Oligomycin treatment ATP levels in control and Tsc1 deficient mouse glioma cells. Quantitation of intracellular ATP levels in control and Tsc1-deficient cells that were cultured without EGF+FGF2 and treated with the ATP synthetase inhibitor oligomycin for 12 hr. Data are the mean fold change ± SD relative to control cells.
0.0 0.5 1.0
1.5 ***
***
n = 3
Intracellular ATP level (relative fold)
0
Oligomycin (µM)
20
57
0 50 100 150
200 **
***
n = 3
F
Oligomycin (µM)
Sphere number/300 cells no spheres no spheres
0 0.1 0.5 1.0
Control Tsc1 Δ/Δ
Figure 11. Effects of Tsc1 deficiency and Oligomycin treatment on
sphere formation in mouse glioma cells. Quantitation of sphere formation
by control and Tsc1-deficient cells that were cultured without EGF+FGF2
and treated with the indicated concentrations of oligomycin. Data are the
mean ± SD.
58
Figure 12. Drug screening for small molecule compounds that have a greater growth inhibitory effect on Tsc1-deficient glioma cells than on control cells. The "Index for drug sensitivity of Tsc1-deficient glioma cells"
(see Experimental Procedures) for 1,301 compounds is shown. Control and Tsc1-deficient cells were treated with the indicated small molecule compounds, followed by analysis of cell viability 48 hr later ( ;1/500, ;1/2,000 or ;1/10,000 dilution).
Index for drug sensitivity of Tsc1Δ/Δ
0.5 1.0 1.5 2.0 2.5 3.0 10 12 14 16 18 20
Rottlerin
Pentamidine A23187
Nigericin
Valinomycin
Nifidipine Auranofin Moxifloxacin
Clodronic acid
Cyclosporin Amoxapine
Minocycline Clindamycin
59
Control Tsc1
Δ/ΔFigure 13. Examples of EGFR "drug-resistant" profiles. Quantitation of
relative viability of control or Tsc1-deficient cells that were cultured without
EGF+FGF2 and treated with the indicated concentrations of the indicated
drugs. Data are expressed as the mean % cell viability relative to untreated
controls.
60