Molecular mechanisms of metabolic regulation of glioma stem cells by mTORC1 activation
著者 モハメド ヒガージ モハメド アーメド
著者別表示 Mohamed Hegazy Mohamed Ahmed journal or
publication title
博士論文要旨Abstract 学位授与番号 13301甲第4486号
学位名 博士(理学)
学位授与年月日 2016‑09‑26
URL http://hdl.handle.net/2297/46590
doi: 10.1074/jbc.M116.734756
Creative Commons : 表示 ‑ 非営利 ‑ 改変禁止 http://creativecommons.org/licenses/by‑nc‑nd/3.0/deed.ja
Molecular mechanisms of metabolic regulation of glioma stem cells by mTORC1 activation
Mohamed Hegazy Mohamed Ahmed
Student ID No. 1323032003
Division of Life Science
Graduate School of Natural Science and Technology Kanazawa University
JAPAN
2016
Although abnormal metabolic regulation is a critical determinant of cancer cell behavior, it is still unclear how an altered balance between ATP production and consumption contributes to malignancy. Here the results show that disruption of this energy balance efficiently suppresses aggressive malignant gliomas driven by mTOR complex 1 (mTORC1) hyperactivation. In a mouse glioma model, mTORC1 hyperactivation induced by conditional Tsc1 deletion increased numbers of glioma-initiating cells (GICs) in vitro and in vivo. Metabolic analysis revealed that mTORC1 hyperactivation enhanced mitochondrial biogenesis, as evidenced by elevations in oxygen consumption rate (OCR) and ATP production.
Inhibition of mitochondrial ATP synthetase was more effective in repressing sphere formation by Tsc1-deficient glioma cells than that by Tsc1-competent glioma cells, indicating a crucial function for mitochondrial bioenergetic capacity in GIC expansion.
To translate this observation into the development of novel therapeutics targeting malignant gliomas, I screened drug libraries for small molecule compounds showing greater efficacy in inhibiting the proliferation/survival of Tsc1-deficient cells compared to controls. Several compounds able to preferentially inhibit mitochondrial activity, dramatically reducing ATP levels and blocking glioma sphere formation were identified. In human patient-derived glioma cells, nigericin, which reportedly suppresses cancer stem cell properties, induced AMPK phosphorylation that was associated with mTORC1 inactivation and induction of autophagy, and led to a marked decrease in sphere formation with loss of GIC marker expression. Furthermore, malignant characteristics of human glioma cells were markedly suppressed by nigericin treatment in vivo.
Thus, targeting mTORC1-driven processes, particularly those involved in maintaining a cancer cell’s energy balance, may be an effective therapeutic strategy for glioma patients.
mTORC1 hyperactivation expands mouse GICs in vitro and in vivo
To investigate the role of mTORC1 in GIC expansion, the previously described mouse glioma model in which mTORC1 is activated by a TAM-inducible system was used. After gliomas had developed, huKO+ cells were collected and glioma cells isolated by flow cytometry. huKO+ cells were cultured under standard NSPC culture conditions, Tsc1 deficiency significantly increased the number of spheres formed (Fig.1), indicating that the sphere-forming cells had expanded upon mTORC1 activation. To evaluate the tumor-initiating capacity of glioma cells in vivo, recipient mice were inoculated with 100, 1,000 or 10,000 freshly isolated huKO+ glioma cells. Tsc1 deficiency promoted tumor development and accelerated the death of recipients compared to Tsc1-competent glioma cells (Fig.2). When as few as 10 huKO+ cells were transplanted, only Tsc1-deficient glioma cells were capable of producing gliomas, but not control cells. Thus, GIC frequency is increased in vivo by mTORC1 activation.
mTORC1 activation causes growth factor-independent proliferation of mouse GICs
First, 4-OHT efficiently induced Tsc1 deletion in these sphere cells was confirmed by western blotting(Fig.3). However, unexpectedly, there was no difference in the number of spheres formed by control and Tsc1-deficient cells cultured in the presence of EGF+FGF2 (Fig.4). This may be due to differences between conditions in vitro and in vivo. Although level of phosphorylation in 4E- BP1 was slightly up-regulated, those of S6 and p70S6K were almost normal in Tsc1-deficient glioma cells (Fig.3). It is speculated that, mTORC1 is fully activated when cytokines are abundant, and that levels of these factors are much higher in vitro than in vivo, therefore, Tsc1 deletion might not be able to further enhance such signaling in this culture condition. When control and Tsc1-deficient glioma cells were cultured in the absence of EGF+FGF2, the size and number of spheres formed in these control glioma cell cultures was decreased compared to those in control cultures containing growth factors, however, Tsc1-deficient glioma cells showed comparable sphere forming capacity in presence and absence of these growth factors (Fig.4). Thus, mTORC1 hyperactivation maintains sphere-forming capacity even when growth factors are withdrawn. In addition, although levels of S6 and 4E-BP phosphorylation in control glioma cells cultured without growth factors were lower than those with growth factors, such down-regulation of phosphorylation due to growth factor depletion was not observed in Tsc1-deficient cells (Fig.3). Results did not show a remarkable change in the expression of Olig2, a glioma stem cell marker, in Tsc1-deficient glioma cells (Fig.5), which assume that Tsc1 deficiency promotes the proliferation and/or survival of GICs.
Increased sensitivity of Tsc1-deficient glioma cells to glucose depletion metabolite levels were assessed in control and Tsc1-deficient glioma cells in
culture in vitro using CE-TOFMS. Several metabolites in the glycolytic pathway, including (G6P), (F1,6BP), (3PGA), and (PEP), were significantly up-regulated (Fig.6). The same was true for components of the pentose phosphate pathway, including (6PGL), (Ru5P), (S7P) (Fig.6). These findings suggested that glucose metabolism might be stimulated in Tsc1-deficient cells. Gene expression levels showed that mRNAs encoding glycolytic enzymes such as glucose transporter 1, hexokinase2, and pyruvate kinase M2 were all elevated by mTORC1 activation (Fig.7). These data indicate that mouse glioma cells experiencing mTORC1 hyperactivation show increased dependence on glucose.
Enhanced mitochondrial ATP production supports mTORC1-driven GIC expansion
Metabolomics analysis showed that lactate levels in glioma cells were not significantly affected by Tsc1 deletion (Fig.6). These data suggested that the increased glucose uptake exhibited by Tsc1-deficient cells might contribute to enhanced mitochondrial OXPHOS rather than to the production of lactate via typical glycolysis. To determine OXPHOS in these cells, OCR was evaluated and it was significantly increased in Tsc1-deficient glioma cells (Fig.8). In addition, the expression levels of mitochondria-associated genes were up-regulated by Tsc1 deletion (Fig.9). ATP levels were increased in Tsc1-deficient cells compared to controls (Fig.10, left). To assess whether this increase in ATP in Tsc1-deficient cells was in fact due to enhanced OXPHOS, the cells were treated with oligomycin, an ATP synthetase inhibitor. Although, oligomycin had only a modest effect on ATP levels in control cells, it dramatically reduced ATP levels in Tsc1-deficient cells (Fig.10, right). oligomycin also profoundly suppressed sphere formation by Tsc1-deficient cells compared to controls (Fig.11).
Drug screening to identify small molecule compounds that can suppress sphere formation by Tsc1-deficient mouse glioma cells
The new application of a known drug, called drug repositioning or drug repurposing, has been a beneficial approach for developing novel therapies for human diseases. I assessed whether this mouse glioma model would be useful for drug screening to identify known compounds able to specifically inhibit the aggressive phenotypes of glioma cells. To this end, I evaluated the effects of numerous small molecule compounds from commercially available existing drug libraries (a total of 1,301 compounds) on the proliferation/survival of control and Tsc1-deficient mouse glioma cells. First the inhibitory effect was estimated for each compound on both types of cells, and then the ratio of the inhibitory effect on Tsc1-deficient cells compared to its effect on control cells was calculated; this ratio was termed the "Index for drug sensitivity of Tsc1-deficient cells". Most compounds screened exhibited an Index of about 1.0 ± 0.5 (Fig.12), indicating that they had equal effects on control and Tsc1-deficient cells. Several compounds showed low Index values, suggesting that these drugs were less effective in
inhibiting the growth of Tsc1-deficient cells than that of control cells. For example, EGFR inhibitors gefitinib and erlotinib showed less efficacy in Tsc1- deficient cells than in control cells. Several genotoxic reagents, including mitoxantrone and topotecan, were also less efficacious in Tsc1-deficient cells. In contrast to the above, several compounds were identified that were highly effective in inhibiting the growth of Tsc1-deficient glioma cells compared to that of control cells. From the first screening, 13 drugs were selected that showed reproducible increased efficacy in Tsc1-deficient cells compared to controls.
Next, I screened the selected compounds for those that caused a greater reduction in intracellular ATP levels in Tsc1-deficient cells, based on the previous observation that oligomycin treatment or glucose starvation triggered a significant reduction in ATP in the former. I found that 5 drugs (nigericin, A23187, auranofin, rottlerin and valinomycin) clearly reduced intracellular ATP levels when used at less than 20 µM (Fig.13). I confirmed that these 5 compounds also had a greater suppressive effect on sphere formation by Tsc1-dificent glioma cells than on that by control cells (Fig.14), suggesting that the screening system could efficiently identify drug candidates in therapeutic approach for mTORC1-driven glioma.
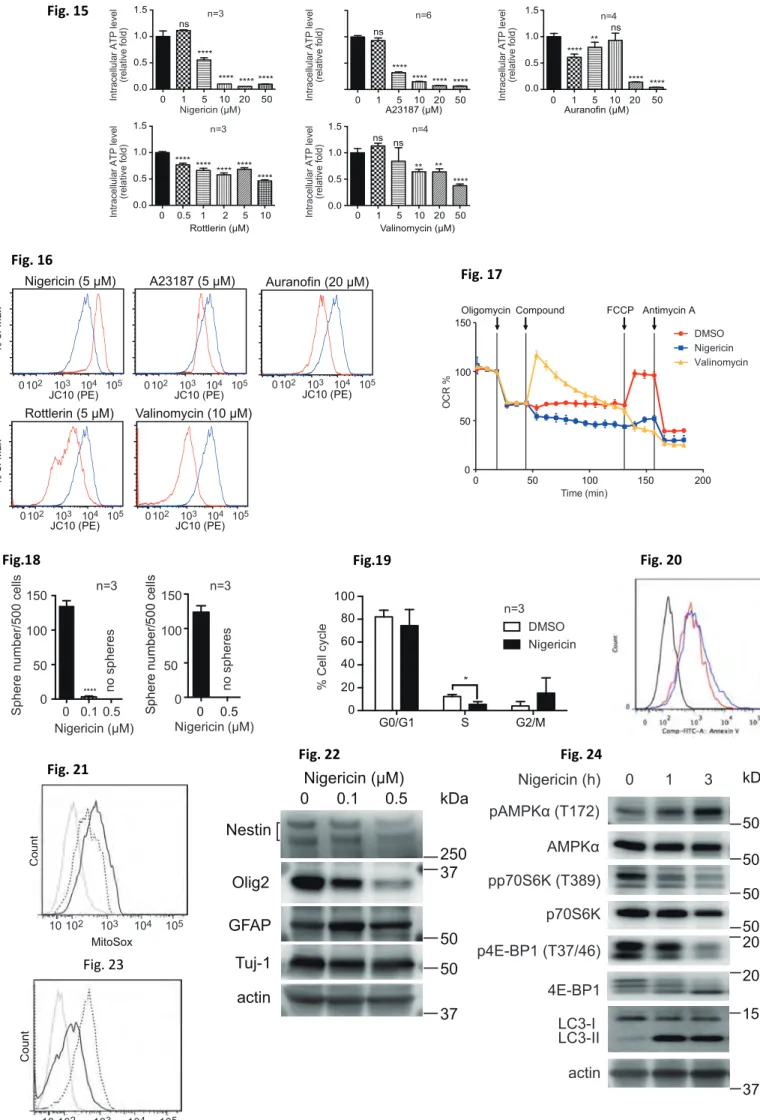
To investigate the selected compounds effect on human GBM cells, I applied each agent to human patient-derived GBM cell lines (TGS-01 and TSG- 04 cells). I found that all the 5 drug compounds reduced ATP in TGS-01 cells compared to untreated GBM cells (Fig.15). All compounds also induced abnormality in mitochondrial membrane potential (Fig.16). This means that treatment with most of these selected compounds might drive down intracellular ATP levels by interfering with mitochondrial ATP production.
Since it was previously reported that nigericin and valinomycin affect mitochondrial respiratory chain, Conferment of their effects was performed. After downregulation of OCR by ATP synthase inhibition (oligomycin treatment), it was recovered by valinomycin (as expected) (Fig.17). In contrast, nigericin treatment blocked the respiratory chain and maintained its suppression even after addition of FCCP (an uncoupler), indicating that nigericin is an efficient inhibitor of mitochondrial bioenergetics.
Nigericin suppresses malignant phenotypes of human patient-derived GBM cells
Next I investigated whether the selected compounds might have therapeutic potential for human GBM. Among the candidates, nigericin has previously been selected by a drug screening program as being capable of targeting cancer stem cell properties. Therefore, I focused on nigericin to determine if this compound could have advantage in suppression of malignant phenotypes of human GBM cells in vitro and in vivo. I found that nigericin could indeed effectively reduce sphere formation by human GBM cells in culture (Fig.18). While nigericin treatment blocked the cell cycle, (Fig.19), it did not induce significant apoptosis
(Fig.20). Mitochondrial ROS were up-regulated in glioma cells (Fig.21), indicating that nigericin induces mitochondrial dysfunction. Moreover, expression levels of the glioma stem cell markers, Olig2 and CD133, were dramatically downregulated during culture with nigericin (Fig.22, 23). These data indicate that nigericin suppresses proliferation of GBM cells, associated with the loss of stem cell properties. nigericin clearly triggered AMPK phosphorylation that was associated with marked inhibition of phosphorylated S6K and 4EBP1 (Fig.24), suggesting that downregulation of ATP levels stimulates an anti-tumor signaling cascade that includes AMPK activation and mTORC1 inactivation.
mTOR inhibition and AMPK activation are both known to induce autophagy, as determined by an observed increase in the LC3-II/LC3-I ratio (Fig.24). To investigate whether nigericin inhibits sphere formation due to abnormality in energy control, concentration of sodium pyruvate was increased in culture media, because pyruvic acid supplies energy to cells through the OXYPHOS in the presence of oxygen. As a result, addition of sodium pyruvate mitigated the inhibitory effect of low concentration, but not higher concentration (>0.1 µM), of nigericin on sphere formation (Fig.25). These data suggest that low dose of nigericin inhibits sphere formation due to partial, but not complete, impairment of mitochondrial energy production.
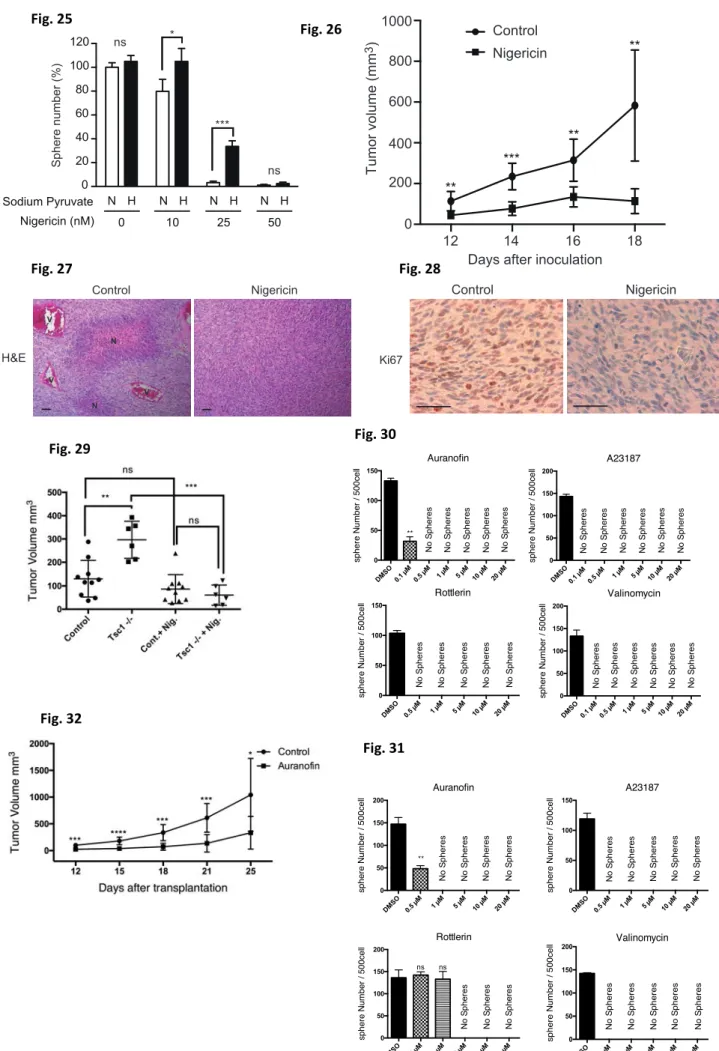
Lastly, I determined whether nigericin administration could inhibit glioma growth in vivo. Immunocompromised mice were injected with human GBM cells and tumor development was monitored. Indeed, tumor volume was greatly reduced in nigericin-treated recipient mice (Fig.26). Histological analyses showed that important histological hallmarks for GBM malignancy were observed in control tumor tissues. In contrast, these malignant characteristics dramatically disappeared by nigericin treatment in vivo (Fig.27). Also, down- regulation of Ki67 staining, by nigericin treatment in vivo (Fig.28). When the effect of nigericin on tumor cell growth in recipient mice bearing Tsc1Δ/Δ or control mouse glioma cells were evaluated, I found that nigericin profoundly suppressed the growth of Tsc1-deficient tumors in vivo, consistent with in vitro results (Fig.29). In addition, when I evaluated the effects of other candidate agents on human GBM cells, I found that all of these compounds suppressed sphere formation (Fig.30,31). Then, auranofin was selected to perform an in vivo experiment. auranofin treatment of glioma-bearing mice resulted in a significant reduction in GBM growth in vivo (Fig.32). These data clearly indicate that this screening system based on an mTORC1-driven glioma model is useful for selecting compounds able to target aggressive malignant gliomas.
0 20 40
60 n = 5**
Sphere number/300 cells
Control Tsc1Δ/Δ
100 huKO+cells
0 50 100 150
0 50 100
Days after transplantation
Survival (%)
p = 0.0019 n = 5
0 20 40 60
0 50 100
p = 0.0391 n = 5
0 10 20 30 40 50
0 50 100
p = 0.0019 n = 5
1,000 huKO+cells 10,000 huKO+cells
Days after transplantation Days after transplantation
Survival (%) Survival (%)
Control Tsc1Δ/Δ
0 50 100 150 200
Spheresize(µm)
0 50 100
*** 150 ***
Control
n = 3 n = 10
Sphere number/500 cells
Tsc1Δ/Δ
EGF/FGF2 + - EGF/FGF2 + -
Glc G-6-P
F-6-P F-1,6-BP
G-3-P DHAP
G-1,3-BP
3-PGA 2-PGA
PEP Pyr
G-1-P
Glycolysis
6-PGL 6-PG
Ru-5-P X-5-P
Ri-5-P
S-7-P E-4-P
G-3-P 0
1 2 3 4 5
**
0.0 0.2 0.4 0.6 0.8
Lactate
0.0 0.1 0.2 0.3 0.4
0.5 ***
0.0 0.2 0.4 0.6
0.8 **
0.00 0.05 0.10 0.15 0.20
0.0 0.2 0.4 0.6
0.8 ***
Pentose Phosphate Pathway
Glycogen
0.0 0.1 0.2 0.3 0.4
0.5 ***
UDP-Glc
0 1 2
3 *
Control Ser
Tsc1Δ/Δ nd: not detected
n = 3
nd
nd
nd
nd
nd
nd
nd
nd
nd
0 2 4 6
0.0 0.5 1.0
1.5 *
0.00 0.05 0.10 0.15
0.20 **
0.00 0.02 0.04 0.06
0.08 **
0.0 0.2 0.4
0.6 **
0 2 4
6 **
0 1 2 3 4
**
0.0 0.5 1.0 1.5 2.0
2.5 ***
n = 3 n = 3 n = 3
Slc2a1/Actin mRNA (relative fold) Hk2/Actin mRNA (relative fold) Pkm2/Actin mRNA (relative fold)
Control Tsc1Δ/Δ Control Tsc1Δ/Δ Control Tsc1Δ/Δ 0 50 100 150 n = 5
***
OCR (pmoles/min/104 cells)
Control Tsc1Δ/Δ
0.0 0.5 1.0 1.5 2.0
***
0.0 0.5 1.0 1.5
2.0 **
0.0 0.5 1.0
1.5 **
n = 3 n = 3 n = 3
Atp5g1/Actin mRNA (relative fold) Cox5a1/Actin mRNA (relative fold) Cycs/Actin mRNA (relative fold)
Control Tsc1Δ/Δ Control Tsc1Δ/Δ Control Tsc1Δ/Δ actin
Tsc1
pp70S6K (T389) p70S6K S6 pS6 (S235/236)
p4E-BP1 (T37/46)
4E-BP1
EGF/FGF2 + + - -
Control Tsc1
Δ/Δ Control Tsc1
Δ/Δ
kDa 150 37 37 70 70 20 15 20 15 37
actin 37 Olig2 37
Control Tsc1Δ/Δ
Fig.6
Fig.8 Fig.9
Fig. 1
Fig. 2
Fig. 3
Fig. 5
Fig. 7
Fig. 4
0.0 0.5 1.0 1.5 ***
***
n = 3
Intracellular ATP level (relative fold)
0
Oligomycin (µM) 20
Index for drug sensitivity of Tsc1Δ/Δ
0.5 1.0 1.5 2.0 2.5 3.0 10 12 14 16 18 20
Rottlerin
Pentamidine A23187
Nigericin
Valinomycin
Nifidipine Auranofin Moxifloxacin
Clodronic acid Cyclosporin
Amoxapine
Minocycline Clindamycin
A23187 (µM)
Auranofin (µM) Rottlerin (µM)
Valinomycin (µM) Nigericin (µM)
Sphere number/500 cells
n=4
0 50 100 150
0 0.01 0.050.1 0.5
n=4
Sphere number/500 cells 0 50 100 150
0 0.01 0.050.1 0.5 1
n=3
Sphere number/500 cells 0 50 100 150
0 0.01 0.050.1 0.5 1
n=4
Sphere number/500 cells 0 50 100 150
0 0.01 0.050.1 0.5 1
n=4
Sphere number/500 cells 0 50 100 150
0 0.01 0.05 0.1
Control Tsc1Δ/Δ
****
****
**** no spheres**** no spheres no spheres no spheres
****
nsns nsns ns
ns nsns
ns
****
****
****
** ***
ns ns
ns
no spheres no spheres
ns nsns
*** ns
****
**** no spheres no spheres no spheres
**** no spheres **** no spheres no spheres no spheres
Fig.10 Fig.11
Fig.12
Fig.13
Fig.14
0 50 100 150 200 **
***
n = 3
F
Oligomycin (µM)
Sphere number/300 cells no spheresno spheres
0 0.1 0.5 1.0
Control Tsc1Δ/Δ
Intracellular ATP level (relative fold) Intracellular ATP level (relative fold)
Intracellular ATP level (relative fold) Intracellular ATP level (relative fold)Intracellular ATP level (relative fold)
A23187 (µM) Auranofin (µM)
Rottlerin (µM) Valinomycin (µM)
Nigericin (µM)
0 1 5 10 20 50
0.0 0.5 1.0
1.5 n=3
0 0.5 1 2 5 10
n=3
0.0 0.5 1.0 1.5
n=4
0.0 0.5 1.0 1.5
0 1 5 10 20 50
n=4
0.0 0.5 1.0 1.5
0 1 5 10 20 50
n=6
0 1 5 10 20 50
****
ns
**** **** ****
ns
****
**** **** ****
****
**** ****
**
ns
**** ******** ****
****
ns ns
****
** **
Nigericin (5 µM) A23187 (5 µM) Auranofin (20 µM)
Rottlerin (5 µM) Valinomycin (10 µM) 0 102 103 104 105
JC10 (PE)
% of Max% of Max
0 102 103 104 105
JC10 (PE) 0 102 103 104 105 JC10 (PE)
0 102 103 104 105
JC10 (PE) 0 102 103 104 105 JC10 (PE)
0 50 100 150 200
0 50 100 150
Time (min)
OCR %
Oligomycin Compound FCCP Antimycin A DMSO Nigericin Valinomycin
Sphere number/500 cells
150
50 100
0 0 0.1 0.5 Nigericin (µM)
0 0.5 Nigericin (µM)
Sphere number/500 cells
n=3
no spheres
n=3 150
50 100
no spheres 0
****
G0/G1 S G2/M
0 20 40 60 80 100
% Cell cycle *
DMSO Nigericin n=3
Fig. 15
Count
10 102 103 104 105 MitoSox
Nestin Olig2
Tuj-1 actin
0 0.1 0.5
GFAP
Nigericin (µM)
250 kDa
37
50 50 37
Count
10 102 103 104 105 CD133
Nigericin (h) 0 1 3 pAMPKα (T172)
actin AMPKα pp70S6K (T389) p70S6K p4E-BP1 (T37/46) 4E-BP1
50 kDa
50 50 50
20 20
37 LC3-I
LC3-II
15
Fig. 21 Fig. 22 Fig. 24
Fig. 20
Fig. 23 Fig. 16
Fig. 17
Fig.18 Fig.19
Sphere number (%)
H Sodium Pyruvate N
Nigericin (nM) 0 10 25 50
0 20 40 60 80 100
120 ns *
***
ns H
N N H N H
Tumor volume (mm3) Control
Nigericin 1000
800 600 400 200 0
Days after inoculation
12 14 16 18
***
**
**
**
Control Nigericin
H&E
Ki67
N
N V
V
V
Control Nigericin
H&E
Ki67
N
N V
V
V
Control Nigericin
H&E
Ki67
N
N V
V
V
DMSO 0.1 µM 0.5 µM
1 µM 5 µM
10 µM 20 µM 0
50 100 150
Auranofin
Concentration
sphere Number / 500cell No Spheres No Spheres
No Spheres No Spheres No Spheres
**
DMSO 0.5 µM 1 µM
5 µM 10 µM
20 µM 0
50 100 150
Rottlerin
sphere Number / 500cell No Spheres No Spheres
No Spheres No Spheres No Spheres
DMSO 0.1 µM 0.5 µM
1 µM 5 µM
10 µM 20 µM 0
50 100 150 200
A23187
sphere Number / 500cell No Spheres No Spheres No Spheres No Spheres No Spheres No Spheres
DMSO 0.5 µM 1 µM
5 µM 10 µM
20 µM 0
50 100 150
A23187
sphere Number / 500cell No Spheres No Spheres No Spheres No Spheres No Spheres
DMSO 0.5 µM 1 µM
5 µM 10 µM
20 µM 0
50 100 150 200
Auranofin
sphere Number / 500cell No Spheres No Spheres
No Spheres No Spheres
**
DMSO 0.5 µM
1 µM 5 µM
10 µM 20 µM 0
50 100 150
200 Valinomycin
sphere Number / 500cell No Spheres
No Spheres No Spheres No Spheres No Spheres
DMSO 0.05 µM 0.1 µM
0.5 µM 1 µM
2 µM 0
50 100 150 200
Rottlerin
sphere Number / 500cell No Spheres No Spheres No Spheres
ns ns
DMSO 0.1 µM 0.5 µM
1 µM 5 µM
10 µM 20 µM 0
50 100 150 200
Valinomycin
sphere Number / 500cell No Spheres
No Spheres
No Spheres No Spheres No Spheres No Spheres
Fig. 25 Fig. 26
Fig. 27 Fig. 28
Fig. 29 Fig. 30
Fig. 31 Fig. 32