• 検索結果がありません。

ライティング力向上のための予備調査研究

N/A
N/A
Protected

Academic year: 2021

シェア "ライティング力向上のための予備調査研究"

Copied!
8
0
0

読み込み中.... (全文を見る)

全文

(1)

ライティング力向上のための予備調査研究

-授業で行ったリーディングとライティングの効果測定-

ラング クリス  キッド ダスティン

(総合文化学科)

A Preliminary Study on Writing Development:

Measuring the Effects of In-Class Reading and Writing Kriss LANGE, Dustin KIDD

キーワード:ライティング流暢さ writing fluency, 速読 reading rate, 語彙サイズ vocabulary size, 作文速度 composition rate

Abstract

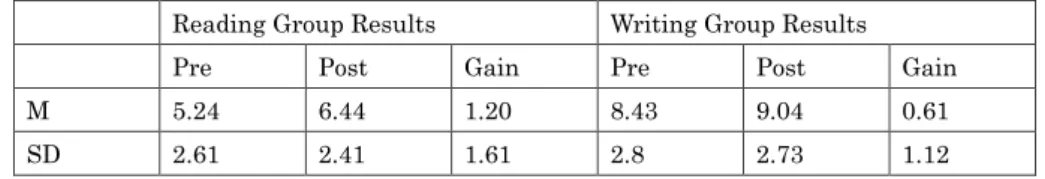
This preliminary study was conducted by the authors to compare how two styles of instruction, writing practice and reading practice, would affect the composition rate of students’ writing. Twenty-one students enrolled in the English Newsletter Production course at the University of Shimane Junior College, Matsue Campus, were divided into two focus groups for the purpose of this study. One group did thirty minutes of reading practice over nine classes, while the other group did thirty minutes of writing practice over the same nine classes. While both groups showed improvement in composition rate over the course of the semester, the study did not find a statistically significant difference in gains between the groups. However, the data collected will be used by the authors to refine future studies focused on writing development.

Introduction

Fluency is an essential but often elusive skill for second language learners to develop. Generally, it refers to the rate at which the foreign language can be comprehended, as in listening and reading, or produced, as in speaking and writing, and is an indicator of the level of language proficiency a learner has obtained.

Fluency is often explained in terms of cognitive capacity. Receptive and productive language skills rely on subskills which gradually operate faster as they become more automatic through practice. These subskills increasingly require less cognitive capacity, and attentional resources may be directed to more complicated

(2)

processes of comprehension, interpretation and analysis. For example, reading requires subskills such as word recognition, syntactic knowledge and phonological representation. The degree to which these and other subskills are automatized will determine fluency and proficiency in reading.

This automaticity results in a faster rate of language processing and production. Fluency “concerns the learner’s capacity to produce language in real time without undue pausing or hesitation. It is likely to rely upon more lexicalized modes of communication as the pressures of real time speech production are met only by avoiding excessive rule-based computation.” (Skehan, 1996, p. 22).

Likewise, in second language (L2) writing there are a similar set of subskills that would result in improved fluency and proficiency if automated. So, how should we go about automating these subskills and thereby increasing fluency? Nation (2009) proposes three approaches to fluency development. The first is repeated practice of the same language item until fluency is achieved. The second is to practice through

“making many connections and associations with a known item.” Fluency is developed by using the item in various contexts and situations. The third approach is simply a combination of the previous two approaches. Fluency develops through both intensive and extensive practice, which automatizes the necessary subskills.

When the subskills for writing require less attention, then more focus can be given to other skills such as self-editing, expression or composition rate. Composition rate has been used as a measure of writing fluency in several other research studies (Chenoweth & Hayes, 2001, Lee & Hsu 2009, Hafiz and Tudor (1989, 1990), and Lai 1993 ). Composition rate provides a simple but accurate picture of writing fluency by measuring how quickly the writer’s message can be conveyed. The number of words written is divided by the time allowed for writing to give us the number of words written per minute.

Composition rate, however, gives us no indication of the quality of the writing produced. Other researchers have argued that an indication of writing complexity should also factor into the assessment of writing fluency. For example, in Storch and Tapper (2009), writing fluency was measured in terms of the total number of words in the writing sample and words per T-unit. According to Hunt (1965), a T-unit is “one main clause with all subordinate clauses attached to it.” A T-unit often corresponds to one sentence, so this method of measuring writing fluency uses the average number of words per sentence to give some idea of sentence complexity.

We can assume that T-units with more words indicate greater complexity. The type/

token ratio, another measure of lexical complexity which compares the number of different words to the total number of words written, is also used to quantify writing fluency (Coyle, et al, 2010). However, for the purposes of this study, the authors are limiting their assessment of writing fluency to composition rate only; as more data are collected for future studies, the authors will reassess and refine this definition as necessary.

So, what is the most effective way to increase composition rates of English language learners? The natural assumption one would make here is that with more writing practice, students’ composition rates should naturally increase over time. As mentioned earlier, intensive practice and repetition to automatize subskills is thought to be an effective method of building fluency. Nation also notes that the process of making many connections and association with language items, as in extensive reading (ER), is also effective. Applying these concepts to pedagogy, how do intensive and extensive fluency practice compare as effective means of improving fluency?

Several studies have reported significant increases in writing fluency as a

(3)

result of ER. The following studies measure writing fluency by composition rate. In Lee and Hsu (2009) the experimental group which did ER wrote an average of forty words more than the control group on the post-test writing sample after one year.

Both groups received the same instruction except for fifty minutes per week in which the comparison group practiced writing and the ER group read.

Studies by Hafiz and Tudor (1989, 1990), reported higher gains in composition rate for ER groups as well. In both studies students completed a thrity minute writing sample as their pre- and post- tests. Although gains were smaller than that of Lee (2009), with an average gain of 0.7 words in the 1989 study and 5.1 words in the 1990 study, they were determined to be statistically significant. The shorter duration of these studies may account for their smaller gains.

In Lai (1993), fifty-two Chinese junior high school students who participated in a summer reading course also made significant gains in composition rate. Students were able to make an average gain of 13.2 words from the pre-to post-test in only four weeks. Like Hafiz and Tudor’s study, the students were given thirty minutes to write on an assigned topic for the pre- and post-tests.

These studies lend support to the idea that writing fluency, as measured by composition rate, can be developed through ER. In the case of Lee & Hsu, the ER group’s gains were significantly greater than students who received writing practice.

This suggests that ER combined with writing practice is more effective for developing writing fluency than writing instruction alone. Influenced by the results of these studies, the authors decided to conduct a preliminary study to examine the effects of writing practice and those of reading practice on composition rate over the course of a single semester.

Purpose and Hypotheses

The current study is intended to investigate the relationship of reading and writing practice on writing fluency. In the current study, timed reading and reading as a class was compared with writing practice to measure the relative contribution of each of these approaches to writing fluency. We attempted to compare the effect that timed writing practice and timed reading practice have on writing fluency development. Our research hypotheses were as follows:

1. Writing fluency rates will be significantly greater for the group of students who did more timed writing practice.

2. The vocabulary size for the group of students who did more reading will significantly increase.

Method Participants

The participants in this study were all first-year students majoring in the Arts & Sciences Department, English Course at the University of Shimane Junior College, Matsue Campus. The study was carried out in the second semester of the 2013 academic year. A total of twenty-one students who were enrolled in the English Newsletter Production course participated in this study.

Study Design

This study was conducted as a supplementary activity for students in an intact writing course, so the design is quasi-experimental. However, students were not placed into the course by ability, and the groups used for the study were divided randomly into two groups, a reading practice group and a writing practice group.

Lange conducted the reading practice classes, and Kidd conducted the writing

(4)

practice classes. The study was conducted over one semester using nine of the course’s fifteen classes for data collection. All students completed a thirty-minute writing sample test and an online version of the Vocabulary Size Test (Nation &

Beglar, 2007) at the beginning and end of the semester.

We measured writing fluency by composition rate because it provides an accurate and readily understandable representation of fluency and it is used in other studies, facilitating comparison. Composition rate is calculated by dividing the number of words written by the number of minutes allowed for writing.

Reading Practice Group

The ten students in the Reading Practice group were asked to complete two reading passage handouts with comprehension questions copied from the book Reading Power (Mikulecky & Jeffries, 2005). Each reading passage contained about two hundred words written at a level the authors considered very comprehensible for our students. Students were timed as they read the passage and they recorded how many minutes it took to finish reading on each handout. Then, they were asked to complete eight comprehension questions on the back of the handout without referring to the passage. This took about ten minutes to complete.

The remaining ten minutes used for the study were spent reading from the non-fiction graded reader Climate Change (Newbolt, 2009). This book is from the Stage 3 level of the Oxford Graded Readers Factfile series and contains 7,151 words.

The instructor read aloud from the book to the class while displaying the text on an OHP for the students to read. At some points, difficult sections of the text were explained and discussed with the class.

Writing Practice Group

The eleven students in the Writing Practice group were assigned a topic to write about for thirty minutes at the end of each class. These topics were chosen at random from Curriculum Concepts (Beals, 1999), a book designed to assist writers with journal writing by providing specific topics. Students were not informed of the topic before class, and writing began as soon as the topic was introduced. Students who were absent were given the option of doing the writing assignment in their own free time, but no student ever availed themselves of this opportunity. Dictionaries, electronic or physical, were not allowed; students had to rely on their own knowledge only. If they ran out of something to write about in regards to the specified topic, the students were instructed to continue writing for the full thirty minutes, choosing a topic of their own. Their writing was done in Microsoft Word and the files were e-mailed to a specific e-mail account set up for the purposes of this course. Once the files were received, the instructor (Kidd) corrected any mistakes and returned the writing to the students. This writing practice was carried out a total of seven times over the period of the course (October 2013 ~ February 2014).

Instruments

Writing Sample. Students were instructed to write for thirty minutes about themselves for the pre- and post-tests conducted during the second and last class of the course. They were encouraged to write anything about themselves that came to mind. We explained that we wanted to measure the volume of writing they could produce in the time allowed as part of a study we were conducting in the class.

Students wrote by hand, using pencils. They were not allowed to use dictionaries or

computers for the writing sample tests.

(5)

Vocabulary Size Test. A thirty-item version of the Vocabulary Size Test (Nation & Beglar, 2007) was administered to both groups following their pre- and post-tests. We limited our focus on only the 1st through the 3rd 1,000 word families for the purposes of this study. Students took an online version of this test which was scored automatically. The test contained ten question items for each 1,000 word frequency level, and it has a Rasch item reliability estimate of 0.87.

Results Results for Hypothesis 1

Hypothesis 1 stated that writing fluency rates would be significantly greater for students who did more timed writing practice. In order to evaluate this hypothesis, we took the number of words that each student wrote for the pre- and post-test writing samples and divided it by the amount of time allotted, thirty minutes, to give us their composition rate in words written per minute. We used the t test for independent samples to determine if there was significance between the writing and reading groups’ results. Table 1 shows the pre-test and post-test composition rate averages and gains for both groups. Despite our intention to make randomized groups, the Writing Group had a pre-test composition rate of over three words higher than the Reading Group. The Reading Group had a mean composition rate gain of 1.2 words written per minute (SD = 2.61), and the Writing Group gained 0.61 words written per minute (SD = 1.12) over the semester.

We found no statistical significance between the post test scores for the two groups with the t test. The t test value was -2.018. The critical value for a two-tail test is 2.145. Our obtained value was slightly less than the critical value at the 0.05 level, so we must accept the null hypothesis and assume that any difference occurred by chance. Our p value was 0.06, falling just short of significance.

Results for Hypothesis 2

Hypothesis 2 stated that the vocabulary size for the Reading Group would increase more than the Writing Group. In order to test this hypothesis we compared the gains made by each group on the Vocabulary Size Test at the 1,000 to 3,000 frequency levels. Table 2 shows the mean gain on the test for the Reading Group was 0.3 points and the Writing Group gained 0.6 points.

Table 1: Pretest and Posttest Composition Rates, Reading and Writing Groups (in written words per minute)

Reading Group Results Writing Group Results

Pre Post Gain Pre Post Gain

M 5.24 6.44 1.20 8.43 9.04 0.61

SD 2.61 2.41 1.61 2.8 2.73 1.12

Table 1: Pretest and Posttest Composition Rates, Reading and Writing Groups (in written

words per minute)

(6)

Discussion

We were not able to establish statistical significance for the results we obtained from this study, so we cannot use them to support or refute our hypotheses.

However, we can learn some things from the results we obtained. We have records of the composition rates and vocabulary sizes of students in this course. This data can be used to compare with future student results.

While absences of some students led to a variance of members each time, the overall average rose as the class progressed. For example, in the first session results from ten students were collected, compared with seven students for the seventh session. This may have influenced the discrepency we see between the composition rates recorded for the pre- and post-tests and those recorded during class sessions in Figure 1. The Writing Group’s average composition rate for the pre-test was 8.43 words but the average for class session was was 3.8 words. The post-test composition rate increased to 9.4 written words per minute but the final class session’s average was only 6.84 words. Possible explanations are that these differences may be the result of the relative ease or difficulty of the randomly selected writing topic or perhaps typing on the computers took more time for students and decreased their class session composition rates.

It is also interesting to note the lower gains in the composition rates of the Writing Group students, compared with the Reading Group students, despite the thirty minutes of writing practice they received during the treatment. However, the small group sizes and the lack of statistical significance for our results make any firm

Table 2: Pre-test and Post-test Vocabulary Size Test, Reading and Writing Groups Reading Group Results Writing Group Results

Pre Post Gain Pre Post Gain

1k level 9.1 9.2 0.1 9.0 9.38 0.38

2k level 4.7 5.2 0.5 6.13 6.75 0.63

3k level 5.8 6.1 0.3 6.88 7.63 0.75

M 6.53 6.83 0.3 7.33 7.92 0.6

Fig. 1: Average Composition Rate According to Class Session

3.00 3.50 4.00 4.50 5.00 5.50 6.00 6.50 7.00 7.50 8.00

1 2 3 4 5 6 7

Words per Minute

Class Session

Table 2: Pre-test and Post-test Vocabulary Size Test, Reading and Writing Groups

Fig. 1: Average Composition Rate According to Class Session

(7)

conclusions impossible. Further studies will be needed to determine if timed readings and class reading practice do in fact contribute to the development of writing fluency.

From the vocabulary size test results, we noticed there is little difference in vocabulary size for the 2

nd

1,000 frequency level and the 3

rd

1,000 word level for students in this study. Knowledge of words in the 3

rd

1,000 word level was slightly higher than the 2

nd

1,000 word level for all students on both the pre- and post-tests.

This could mean that students’ receptive knowledge of less frequently occurring words is higher than their knowledge of more frequently occurring words. Future studies should be conducted to determine if such an imbalance actually exists and steps should be taken to prioritize the acquisition of vocabulary according to its frequency of occurrence.

Limitations

As mentioned earlier, this study was conducted within an existing class with a small group of students. Better controls need to be put in place to ensure the accuracy of the data collected. The higher composition rates for the Writing Group in pre-test suggest that more efforts should be made to create groups of comparable ability. In addition, group sizes of less than twenty are usually considered too small for meaningful statistical analysis. Also, students took a variety of other courses for English study that involved reading and writing that may have influenced the results of this study.

Conclusion

As a preliminary investigation into writing fluency, this study provided the authors with an opportunity to collect data and learn more about our students’

writing fluency. Through this study we discovered the limitations of our research design and considered ways to overcome these limitations in future studies. Both the Reading and Writing Groups made gains in composition rate. Although our results were inconclusive, we did not find that the Writing Group’s gains in composition rate were noticeably higher than those of the Reading Group, as might be expected.

Differences in vocabulary size gains between the groups were also negligible. This may suggest that in order to discover meaningful differences in the data, a longer study period or a more intensive study period is necessary. However, within the current class and study format available to the authors, neither of these options are feasible at this time.

Future Studies

This study being the authors’ first attempt at analyzing the factors behind

students’ writing ability, the necessity of further studies has become clear. As

previously mentioned, composition rate alone might not be a sufficient indicator of

writing fluency; further analysis of student writing using the type/token ratio would

give us information about lexical density in student compositions. For vocabulary

size analysis, the authors plan on expanding their study up to the 5

th

1000 word

family in order to gain a greater perspective on students’ vocabulary sizes. In order

to compensate for the small number of participants in each group, the authors plan

to alternate reading and writing groups so all of the students in the class can be

included in both treatments. We also plan on taking a questionnaire to learn more

about student affitudes and determine the extent of their reading and writing practice

in other courses over the semester.

(8)

References

Beals, G. (1999). Curriculum Concepts. Greenwood, Western Australia: R.I.C.

Publications.

Chenoweth, A., & Hayes, J. (2001). Fluency in writing: generating texts in L1 and L2.

Written Communication, 18, 80-98.

Coyle, D., Hood, P., & Marsh, D. (2010). Content and language integrated learning.

Cambridge: Cambridge University Press.

Hafiz, F. M., & Tudor, I. (1990). Graded readers as an input medium in L2 learning.

System, 18, 31-42.

Hunt, K. (1965). Grammatical structures written at three grade levels. NCTE research report no. 3. Champaign, IL, USA: NCTE.

Lai, F. (1993). The effect of a summer reading course on reading and writing skills.

System, 21, 87-100.

Lee, S., & Hsu, Y. (2009). Determining the crucial characteristics of extensive reading programs: the impact of extensive reading on EFL writing. The International Journal of Foreign Language Teaching, 5, 12-20.

Mikulecky, B. S., & Jeffries, L. (2005). Reading power: reading for pleasure, comprehension skills, thinking skills, reading faster (3

rd

ed.). White Plains, NY: Pearson Education.

Nation, I.S.P., & Newton, J. (2009). Teaching ESL/EFL listening and speaking. New York, NY: Routledge Press.

Nation, I.S.P., & Beglar, D. (2007). A vocabulary size test. The Language Teacher, 31(7), 9-13.

Online test at: http://www.lextutor.ca/tests/levels/recognition/1_14k/

Newbolt, B. (2009). Climate change. Oxford: Oxford University Press

Reichelt, M. A. (2001). A critical review of foreign language writing research on pedagogical practices. Modern Language Journal, 85, 578-598.

Skehan, P. (1996). A framework for the implementation of task-based instruction.

Applied Linguistics, 17, 38-61.

Storch, N., & Tapper, J. (2009). The impact of an EAP course on postgraduate writing.

Journal of English for Academic Purposes, 8, 207-223.

Tudor, I., & Hafiz, F. (1989). Extensive reading as a means of input to L2 learning.

Journal of Research in Reading, 12, 164-178.

(受稿 平成26年12月8日,受理 平成26年12月15日)

Table  1:  Pretest  and  Posttest  Composition  Rates,  Reading  and  Writing  Groups  (in  written words per minute)
Table 2: Pre-test and Post-test Vocabulary Size Test, Reading and Writing Groups    Reading Group Results  Writing Group Results

参照

関連したドキュメント

Keywords: continuous time random walk, Brownian motion, collision time, skew Young tableaux, tandem queue.. AMS 2000 Subject Classification: Primary:

Kilbas; Conditions of the existence of a classical solution of a Cauchy type problem for the diffusion equation with the Riemann-Liouville partial derivative, Differential Equations,

Answering a question of de la Harpe and Bridson in the Kourovka Notebook, we build the explicit embeddings of the additive group of rational numbers Q in a finitely generated group

Then it follows immediately from a suitable version of “Hensel’s Lemma” [cf., e.g., the argument of [4], Lemma 2.1] that S may be obtained, as the notation suggests, as the m A

Definition An embeddable tiled surface is a tiled surface which is actually achieved as the graph of singular leaves of some embedded orientable surface with closed braid

We give a Dehn–Nielsen type theorem for the homology cobordism group of homol- ogy cylinders by considering its action on the acyclic closure, which was defined by Levine in [12]

Our method of proof can also be used to recover the rational homotopy of L K(2) S 0 as well as the chromatic splitting conjecture at primes p > 3 [16]; we only need to use the

While conducting an experiment regarding fetal move- ments as a result of Pulsed Wave Doppler (PWD) ultrasound, [8] we encountered the severe artifacts in the acquired image2.