DOCTORAL THESIS
Association between Socioeconomic Status, Mental Health and Need for Long-term Care: A Comparative
Study between the Japanese and Chinese Elderly
Fanlei KONG
Department of Urban System Science Tokyo Metropolitan University
September 2014
Association between Socioeconomic Status, Mental Health and Need for Long-term Care: A Comparative
Study between the Japanese and Chinese Elderly
by
Fanlei KONG
Department of Urban System Science Tokyo Metropolitan University
September 2014
I
ABSTRACT
Population aging has become a global demographic trend, first described in developed, then developing countries. The total number as well as the high proportion of the elderly among the population increases the total amount of need for long-term care (NLTC) and further raises the total expenditure on medical care for older persons.
Therefore medical care expenditure has become an important issue and the research about the determinants of the NLTC has also become an urgent issue. The literature review showed that few studies had explored the relationship between mental health and the NLTC, while no study had ever assessed the structural relationship between socioeconomic status (SES), mental health and NLTC simultaneously; the comparative study between the Japanese and Chinese elderly is not available. Aiming to fill this research gap, the objectives of the present study are to investigate in a cohort of the Japanese and Chinese men and student: 1) the structural relationship between SES, mental health and NLTC; 2) whether a gender difference exists between any of these associations.
Chapter 2 explored the association as well as the gender difference between the SES, mental health and NLTC among the Japanese elderly. A follow-up survey was carried out in Tama City, Tokyo in 2001 and 2004. Data were collected from the suburban-dwelling participants, aged 65 years old and above, through self-reported questionnaires. In total, 7,905 individuals participated in the survey (47.5% of male and 52.5% of female). Based on the structure equation model (SEM) analysis, a negative relationship was observed between the mental health and the NLTC among the Japanese elderly. The association between SES and NLTC was not statistically significant. A positive effect was observed from SES on mental health among the Japanese elderly. In both men and women, mental health was significantly and negatively associated with NLTC. In Japanese elderly women, SES had both direct effect and indirect (via mental health) effect on NLTC. However, these effects were not statistically significant in Japanese elderly men. In both men and women, there was a significant positive relationship between SES and mental health, with a stronger effect in women than in men.
II
Chapter 3 examined the structural relationship as well as the gender difference between SES, mental health and NLTC among the elderly in Tibet, China. A cross-sectional survey was conducted in Lhasa City and Shigatse City in Tibet between July-August 2009. Data were collected from the urban-dwelling participants, aged 60 years and above, through questionnaires resulting in 2,008 respondents (39.8% of male and 60.2% of female). The results of the SEM analysis showed that there was a negative correlation between mental health and NLTC among the Tibetan elderly. SES had not only a direct effect but also an indirect (via mental health) effect on NLTC. A positive relationship between SES and mental health was found among the Tibetan elderly.
Concerning the gender difference, a negative relationship was found between mental health and the NLTC in both Tibetan male and female elderly, with a slightly stronger effect among the Tibetan male elderly. SES exerted a negative effect onto the NLTC among the Tibetan male and female elderly, slightly stronger for the Tibetan male elderly. A positive association was observed between SES and mental health in both Tibetan male and female elderly; somewhat stronger among the Tibetan female elderly.
Chapter 4 assessed the relationship between the SES, mental health and NLTC among the urban elderly in Yanji. Whether the association differs between genders was also investigated. A cross-sectional survey was conducted in Yanji City between April-May 2012. Data were collected from the urban-dwelling participants, aged 60 years and above, through questionnaires. The study included 231 respondents (51.1% of male and 48.9% of female). Results illustrated that a negative relationship existed between mental health and NLTC among the elderly in Yanji. SES affected the NLTC directly and indirectly through mental health. Both the direct and indirect effects of SES on the NLTC were negative. A positive association was observed between SES and mental health among older persons in Yanji. Regarding the gender difference, the effect of mental health on the NLTC was negative both in male and female elderly in Yanji, while slightly stronger for the male elderly. The association between SES and the NLTC was negative both for the male and female elderly in Yanji, somewhat stronger among the male elderly. SES exerted a positive effect on mental health both in the male and female elderly in Yanji, a little stronger for the male elderly.
Chapter 5 compared the structural relationship between SES, mental health and NLTC between the Japanese and Chinese elderly. Whether there is a gender difference
III
of these associations was also examined. Overall, the structural association between SES, mental health and NLTC was almost the same between the Japanese and Chinese elderly, except the association between SES and NLTC. A significant association between SES and NLTC was only found to be significant in the Chinese elderly but not in the Japanese elderly. This might be due to the different development stages between Japan and China with less resource being owned by the Chinese elderly. The structural association between SES, mental health and NLTC were found to be almost the same in both Chinese and Japanese male and female elderly. Unlike in Chinese male elderly, a significant association between SES and NLTC was not statistically significant in Japanese male elderly. One of the reasons for these differences could be the use of different indicators for mental health and NLTC.
The present study, by clarifying the relationship between SES, mental health and NLTC, highlight the importance of the improvement of the SES and mental health on decreasing the NLTC. It provides useful evidence-based information for policy makers, health care practitioners and researchers. Despite the conspicuous features of using large-scaled and chronological database, this study has some limitation, including that the indicators of the NLTC were different between Japan and China; and the two cities chosen in China were both from ethnic minority areas. More studies using the same indicators and conducted in more general cities in China are needed to improve the internal and external validity of these findings.
IV
ACKNOWLEDGEMENTS
My doctoral journey could not have been finished without support and guidance of many people around me. Great appreciation is expressed to all those who have offered their kind help and assistance during the completion of my doctoral study.
I would like to express my deepest gratitude to Professors Tanji Hoshi. As my supervisor, he generously gave his knowledge, time and encouragement in assisting my study at Tokyo Metropolitan University. In addition, he has provided continual support to help me overcome many problems I encountered while I lived in Japan. I cannot thank him enough for all of his support and his confidence in my abilities.
I owe the greatest debt to the other three committee members, Professor Hidenori Tamagawa, Professor Kahoruko Yamamoto and Professor Motoki Nagano. Each of you contributed to the successful completion of my dissertation. Without your invaluable comments, insightful recommendations and continuous support throughout the process, I could not reach to the heights.
I would like to gratefully acknowledge the advisor of my Master course - Professor Bin Ai, who is also important to the success of my PhD course. In particular, I greatly appreciate you for giving me this wonderful study opportunity in Tokyo Metropolitan University.
I wish to acknowledge the Tokyo Metropolitan Government for the generous support on my PhD course with the Asian Human Resources Fund. I am truly grateful for the financial assistance to support my research and life in Tokyo, Japan.
Many thanks are also due to Professor Zumin Shi from the University of Adelaide, Australia, who have edited my dissertation draft and some original articles. You were always helping me on this time and energy consuming work in a timely manner despite your own busy life.
I must reserve special thanks for all the students in Hoshi Laboratory - who gave me unconditional support in countless ways during my stay in Japan. My deep appreciation would specially go to Dr. Toshihiko Takahashi, Dr. Naoko Nakayama, Dr. Miki Kubo, Dr. Naoko Inoue and Dr. Miru Tano. I am thankful to Suwen Yang, Shuo Wang, Pei Wen and Mingyu Zhang. Thank you for being an important part of my life over the past
V
three years.
I am also indebted to Romeo Gilbuena, Marcelino Villafuerte, Suyong Kim, Wong Yat Yu, Hembram Dambarudhar, Yohei Ito, Shuhei Kiyomoto and many other friends for their tremendous support and care. During my doctoral life in Japan, I could not have survived without the care and help from you. I also would like to specially thank Romeo Gilbuena for your assistance, since I could not have published my first SCI original article without you.
I attribute my great gratitude to many old adults who participated in our surveys. My research would not have been possible without their cooperation: allowing us to interview them and sharing their thoughts and feelings willingly with us. They provided the valuable information about the aging situation of our society which I will always remember.
My deepest thanks are reserved for my family members, for their strong belief in, support and love for me. My family had been always behind me throughout all of my educational endeavors over the past years. I could never accomplish them without your love and encouragement, you have been always the source of my motivation and inspiration. In particularly, thank you Dad and Mom, for your endless love and continued faith in me.
Finally, my special thanks go to my girlfriend – Ling HAN and her parents. Without your love, infinite patience and unceasing support in every step of my doctoral study, I would never stand where I am today.
VI
TABLE OF CONTENTS
Chapter 1 Introduction...1
1.1 Background...2
1.1.1 Becoming an aged society...2
1.1.2 Higher and higher medical expenditure on the aged people...22
1.2 Literature review...33
1.2.1 Definitions of socioeconomic status and its measurement...33
1.2.2 Definition of mental health and its measurement...35
1.2.3 Definition of need for LTC and its measurement...35
1.2.4 Relationship between SES and mental health...37
1.2.5 Association between SES and the need for LTC...39
1.2.6 Relationship between mental health and the need for LTC...39
1.2.7 An overview of the previous researches...40
1.3 Objective and hypotheses of the research...42
1.3.1 Objectives of the study...42
1.3.2 Hypotheses of the research...42
1.4 Originalities and significance of the research...43
1.4.1 Originalities of the study...43
1.4.2 Significance of the research...44
1.5 Dissertation structure...45
References...47
Chapter 2 Relationship between SES, Mental Health and Need for LTC among the Japanese Elderly: A Cohort Study in Tama City...55
2.1 Introduction...56
2.1.1 Population aging and the LTCI in Japan...56
2.1.2 Literature review...56
2.2 Method...58
2.2.1 Study settings and its aging population...58
2.2.2 Study design and research subjects...58
VII
2.2.3 Data collection procedure...59
2.2.4 Variable measurement...59
2.2.5 Analytical approach...61
2.3 Results...62
2.3.1 Descriptive analysis of observed variables by gender...62
2.3.2 Bivariate correlation analysis...66
2.3.3 Factor analysis...67
2.3.4 Structural relationship between SES, mental health and NLTC of all subjects..68
2.3.5 Gender difference of the structural relationship between SES, mental health and NLTC...70
2.4 Discussion...73
2.4.1 Principal findings and the comparison with other studies...73
2.4.2 Association between SES and NLTC...73
2.4.3 Relationship between Mental health and NLTC... 74
2.4.4 Association between SES and mental health...74
2.4.5 Determinant Coefficient...75
2.4.6 Structural relationship between SES, health and NLTC... 75
2.4.7 Conspicuous features of this study...76
2.5 Conclusion...76
References...79
Chapter 3 Relationship between SES, Mental Health and Need for LTC among the Chinese Elderly: A Cross-sectional Study in Tibet...83
3.1 Introduction...84
3.1.1 Population aging in China...84
3.1.2 Literature review...85
3.2 Method...87
3.2.1 Hypotheses of the research...87
3.2.2 Study location and subjects...88
3.2.3 Sampling method...88
3.2.4 Measurement of the variables...89
3.2.5 Statistical approach...89
VIII
3.3 Results...91
3.3.1 Characteristics of the subjects...91
3.3.2 NLTC of the Tibetan elderly...91
3.3.3 Structural relationship between SES, mental health and NLTC among the Tibetan elderly...93
3.3.4 Gender difference of the structural relationship between SES, mental health and NLTC...96
3.4 Discussion………...98
3.4.1 Relationship between mental health and NLTC...98
3.4.2 Correlation between SES and NLTC...99
3.4.3 Association between SES and mental health...99
3.4.4 Relationship between SES, mental health and NLTC...99
3.5 Main conclusions...100
References...103
Chapter 4 Relationship between SES, Mental Health and Need for LTC among the Chinese Elderly: A Cross-sectional Study in Yanji City...107
4.1 Introduction...108
4.2 Method...108
4.2.1 Hypotheses of the research...108
4.2.2 Study location and subjects...109
4.2.3 Sampling method...109
4.2.4 Measurement of the variables...110
4.2.5 Analysis approach...110
4.3 Results...111
4.3.1 Descriptive analysis results...111
4.3.2 NLTC of the elderly in Yanji...114
4.3.3 Relationship between SES, mental health and NLTC of all subjects...115
4.3.4 Gender difference of the association between SES, mental health and NLTC.118 4.4 Discussion………...121
4.4.1 Discussion on the satisfaction of the NLTC...121
4.4.2 Relationship between mental health and NLTC...121
IX
4.4.3 Correlation between SES and NLTC...122
4.4.4 Association between SES and mental health...122
4.4.5 Discussion on the association between SES, mental health and NLTC...122
4.5 Main conclusions...124
References...126
Chapter 5 Conclusions and Implications...129
5.1 Summary of previous chapters...130
5.2 Comparison between the Japanese and Chinese elderly...131
5.2.1 Comparisons on the relationship between mental health and NLTC...132
5.2.2 Comparisons on the relationship between SES and NLTC...134
5.2.3 Comparisons on the relationship between SES and mental health...135
5.3 Dissertation conclusions and notable findings...137
5.3.1 Main conclusions...137
5.3.2 Notable findings...139
5.3.3 Strength of this dissertation……...141
5.4 Implications...142
5.5 Limitations and future issues...145
References...147
APPENDICES...148
Appendix A: Abstract in Japanese...149
Appendix B: Questionnaire of the Japanese elderly in Tama City in 2001...152
Appendix C: Questionnaire of the Japanese elderly in Tama City in 2004...158
Appendix D: Questionnaire of the Chinese elderly in Tibet...171
Appendix E: Questionnaire of the Chinese elderly in Yanji city...178
X
LIST OF TABLES
Table 1.1 Distribution of the population of the world and development groups by age groups in 2013, 2050..……….3 Table 1.2 Life expectancy at birth of major area by gender: estimates and projections:
1950-2100..………10 Table 1.3 Ten countries or areas with the oldest populations in 2013, 2050 and 2100..11 Table 1.4 Ten countries or areas with the highest life expectancy in 2005-2010, 2045-2050, 2095-2100……...……….……14 Table 1.5 Life expectancy at birth of China, Japan, Asia and the world by gender:
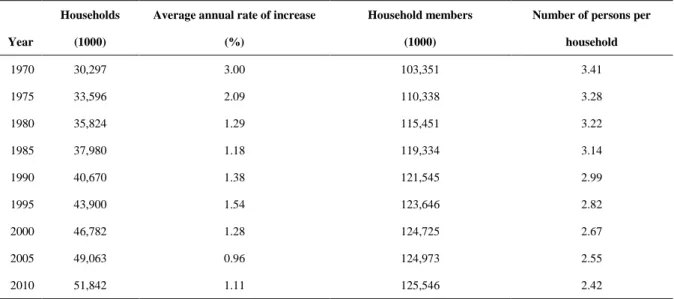
1950-2100………..………19 Table 1.6 Changed of the numbers of the Japanese households and household members………..………24 Table 1.7 Trend of the Japanese elderly households..………25 Table 1.8 Health expenditure of China, Japan and the world in 2000, 2005 and
2010……….31 Table 1.9 China: Population, Changing Demographics, and Healthcare Statistics since
2006………..……….33
Table 2.1 Study subjects by gender and age……….….….59 Table 2.2 Descriptive characteristic of observed variables of Japanese elderly by gender...…….64 Table 2.3 Correlation between observed variables among Japanese male elderly…….66 Table 2.4 Correlation between observed variables among Japanese female elderly…..67 Table 2.5 KMO and Bartlett’s Test Result……….67 Table 2.6 Factor Analysis of Observed Variables………...………68 Table 2.7 Model fitness indices for the hypothetical model of the Japanese elderly………..69 Table 2.8 Structural relationship between SES, Mental Health and NLTC among the Japanese elderly………69 Table 2.9 Model fitness indices for the hypothetical model of the Japanese elderly by
gender………70 Table 2.10 Structural relationship between SES, Mental Health and NLTC by gender
among the Japanese elderly………...72
XI
Table 3.1 Descriptive Analysis of the Subjects………..………90
Table 3.2 Distribution of the first care provider of the six basic needs for LTC…...91
Table 3.3 The satisfaction of the six basic needs for LTC...………...……92
Table 3.4 Factor Analysis of Observed Variables………...………93
Table 3.5 Model fitness indices for the hypothetical model of the Tibetan elderly...95
Table 3.6 Standardized effects of SES and Mental Health on NLTC of the Tibetan elderly………...……….95
Table 3.7 Standardized effects of SES on Mental Health of the Tibetan elderly……...96
Table 3.8 Model fitness indices for the hypothetical model of the Tibetan elderly by gender………...……….96
Table 3.9 Standardized effects of SES and Mental Health on NLTC by gender of the Tibetan elderly………...96
Table 3.10 Standardized effects of SES on Mental Health by gender of the Tibetan elderly………...……...98
Table 4.1 Characteristics of the Subjects...111
Table 4.2 Descriptive Analysis of the observed variables by gender…………...112
Table 4.3 Correlation between observed variables by employing Kendall's tau_b…..113
Table 4.4 Descriptive analysis of the care provider and the expected care provider of the elderly………...…….114
Table 4.5 Factor Analysis of Observed Variables……….…115
Table 4.6 Model fitness indices for the hypothetical model of the elderly in Yanji………...117
Table 4.7 Standardized effects of SES and Mental Health on NLTC of the elderly in Yanji………...117
Table 4.8 Standardized effects of SES on Mental Health of the elderly in Yanji………...…………....118
Table 4.9 Model fitness indices for the hypothetical model of the elderly in Yanji by gender………118
Table 4.10 Standardized effects of SES and Mental Health on NLTC among the elderly in Yanji by gender……….……….………120
Table 4.11 Standardized effects of SES on Mental Health among the elderly in Yanji by gender………....121
Table 5.1 Comparison on the structural relationship between SES, mental health and
XII
NLTC between Japanese and Chinese elderly………….…………....……132 Table 5.2 Comparison on the structural relationship between SES, mental health and NLTC between Japanese and Chinese elderly by gender………….……...133 Table 5.3 Comparison on the structural relationship between SES, mental health and NLTC between Japanese male elderly and Chinese male elderly………...140 Table 5.4 Comparison on the structural relationship between SES, mental health and NLTC between Japanese female elderly and Chinese female elderly…...141
XIII
LIST OF FIGURES
Figure 1.1 The world population by broad age group 1950-2100………...…….2 Figure 1.2 Age distribution of the world’s population by development group, 1970, 2010, 2050……….4 Figure 1.3 The world population by broad age group 1950-2100 ………...5 Figure 1.4 Total fertility rate of the world and major development groups………..7 Figure 1.5 World fertility rate maps in 1950-1955, 2010-2015, 2050-2055 and 2095-2100…..……….….8 Figure 1.6 Life expectancy at birth of the world and the main development regions:
1950-2100……….……….………8 Figure 1.7 Population by broad age group of Japan 1950-2100……….…11 Figure 1.8 Total fertility of Japan and its comparison with the world and Asia……….12 Figure 1.9 Life expectancy at birth of Japan compared with the world and
Asia………...….…13 Figure 1.10 Population by broad age group of China 1950-2100………..15 Figure 1.11 Proportion of the elderly aged 60 years or over in Japan and
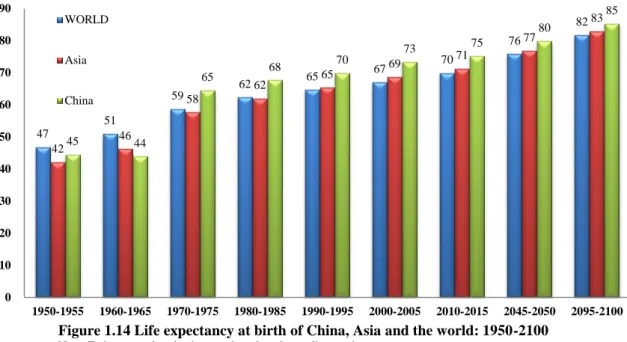
China………...….16 Figure 1.12 Population pyramid of Chinese population by age groups and sex in 1950, 2010, 2050 and 2100…………..……….………..…17 Figure 1.13 Total fertility rate of China, Asia and the world: 1950-2100………..18 Figure 1.14 Life expectancy at birth of China, Asia and the world: 1950-2100……....19 Figure 1.15 Percentage of the elderly in 31 provincial-level administrative regions of
China……...………...………....20 Figure 1.16 The Speed of Population Aging of Japan, China and Other Selected Countries………..……….…….21 Figure 1.17 Old-age dependency ratio of Japan, China and the World:
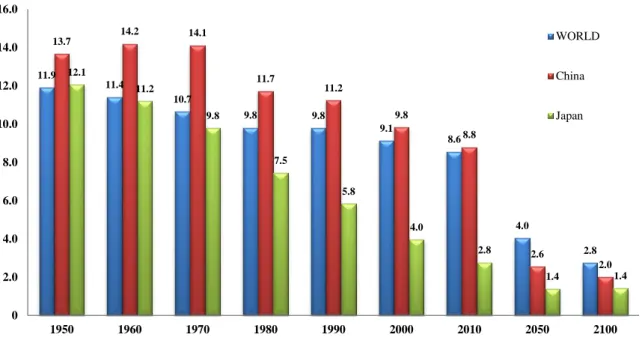
1950-2100………..………...….22 Figure 1.18 Life expectancy at birth of Japan, China and the world: 1950-2100……..23 Figure 1.19 Changes in household composition among the Japanese population……..24 Figure 1.20 Potential Support Ratio of Japan, China and the World: 1950-2100……..27 Figure 1.21 Changes in the Number of the Japanese Elderly Insured by the LTCI…...29 Figure 1.22 Changes in social security benefit expenditures of Japan………...30 Figure 1.23 Changes in Total Amount of LCTI Expenses in Japan………....30 Figure 1.24 Hypothetical model of the study……….43
XIV
Figure 1.25 Dissertation structure………..….46
Figure 2.1 Structural relationships between SES, mental health and NLTC among the Japanese elderly………...70 Figure 2.2 Structural relationships between SES, mental health and NLTC among the Japanese male elderly………..71 Figure 2.3 Structural relationships between SES, mental health and NLTC among the
Japanese female elderly………...71 Figure 2.4 Association between SES, mental health and NLTC among the Japanese elderly……….……….…76 Figure 2.5 Association between SES, mental health and NLTC among the Japanese male elderly……….…77 Figure 2.6 Association between SES, mental health and NLTC among the Japanese female elderly………..………77
Figure 3.1 Structural relationships between the SES, mental health and NLTC among the Tibetan elderly………...94 Figure 3.2 Structural relationships between the SES, mental health and NLTC among
the Tibetan male elderly………...…...97 Figure 3.3 Structural relationships between the SES, mental health and NLTC among
the Tibetan female elderly………...97 Figure 3.4 Comparison of the association between SES, mental health and NLTC
among the Tibetan elderly……….…101 Figure 3.5 Association between SES, mental health and NLTC among the Tibetan male elderly………..………102 Figure 3.6 Association between SES, mental health and NLTC among the Tibetan male elderly………..………102
Figure 4.1 Structural relationships between the SES, mental health and NLTC among the elderly in Yanji……….118 Figure 4.2 Structural relationships between the SES, mental health and NLTC among the male elderly in Yanji………119 Figure 4.3 Structural relationships between the SES, mental health and NLTC among
the female elderly in Yanji……….119 Figure 4.4 Association between SES, mental health and NLTC among the elderly in Yanji………..…………123
XV
Figure 4.5 Association between SES, mental health and NLTC among the male elderly in Yanji………….……….………125 Figure 4.6 Association between SES, mental health and NLTC among the female
elderly in Yanji……….………….125
Figure 5.1 Comparison of the Standardized effects of Mental Health on NLTC…….132 Figure 5.2 Comparison of the standardized effects of Mental Health on NLTC by gender………....133 Figure 5.3 Comparison of the Standardized effects of SES on NLTC……….134 Figure 5.4 Comparison of the Standardized effects of SES on NLTC by gender……135 Figure 5.5 Comparison of the Standardized effects of SES on Mental Health………136 Figure 5.6 Comparison of the Standardized effects of SES on Mental Health by
gender………..………....136 Figure 5.7 Comparison of the association between SES, mental health and NLTC
among the Japanese elderly and Chinese elderly………..138 Figure 5.8 Comparison of the association between SES, mental health and NLTC
among the Japanese male elderly and Chinese male elderly……….139 Figure 5.9 Comparison of the association between SES, mental health and NLTC among the Japanese female elderly and Chinese female elderly.……..…140 Figure 5.10 Trend in social security benefits in Japan from 1950 to 2012…………...142
XVI
LIST OF ABBREVIATIONS
ADL………...activities of daily life CCP………...………Chinese Communist Party GDP………...………Gross Domestic Product IADL………...……….instrumental activities of daily living LTC………..long-term care LTCI………...……….long-term care insurance NH ………...……….…nursing home NLTC………....need for long-term care OCP………...…….….One Child Policy PRC………...………..Peoples’ Republic of China PSR………..potential support ratio SEM……….……..structural equation modeling SES………socioeconomic status WHO………....World Health Organization
1
Chapter 1
Introduction
2
1.1 Background
1.1.1 Becoming an aged society 1.1.1.1 Global population aging trend
Population ageing, the shift towards an increased proportion of older persons in the population, is a global phenomenon resulting from rapid declines in fertility rates coupled with reductions in mortality and increased longevity (United Nations, 2012).
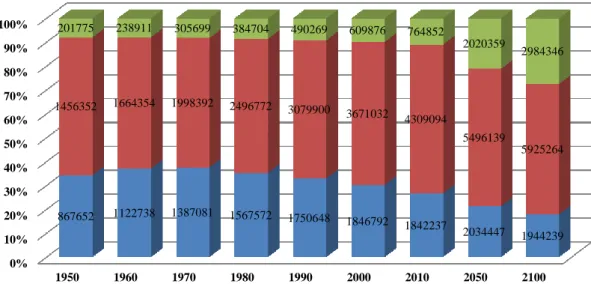
At the global level, 1 in every 12 individuals was at least 60 years of age in 1950, and by the year 2010, those ratios had increased to 1 in every 10 aged 60 years or older (Figure 1.1). By the year 2050, more than 1 in every 5 persons throughout the world is projected to be aged 60 or over. Such a demographic change, which had its origin in the nineteenth and twentieth centuries and will surely be the distinctive trait of populations during the twenty-first century, is transforming the world. Initially started in the more developed countries, population ageing is currently taking place almost everywhere in the world, and it has now become apparent in much of the developing world and it will affect virtually all countries over the medium-term, although its intensity will vary considerably among countries (United Nations, 2009).
In 1950, there were 201,775 thousands persons aged 60 or over throughout the world (Figure 1.1), accounting for 8 percent of the world population. At that time, only
0%
10%
20%
30%
40%
50%
60%
70%
80%
90%
100%
1950 1960 1970 1980 1990 2000 2010 2050 2100
867652 1122738 1387081 1567572 1750648 1846792 1842237 2034447 1944239 1456352 1664354 1998392 2496772 3079900 3671032 4309094
5496139
5925264 201775 238911 305699 384704 490269 609876 764852
2020359
2984346
Figure 1.1 The world population by broad age group 1950-2100 Note: Estimates and projections are based on the medium variant.
Source:United Nations, Population Division (2013). World Population Prospects: The 2012 Revision population age 0-14 (thousands) population age 15-59 (thousands) population age 60 or over (thousands)
3
3 countries had more than 10 million people 60 or older: China (42 million), India (20 million), and the United States of America (20 million) (United Nations, 2001). Fifty years later (the year of 2000), the number of persons aged 60 or over increased about three times to 609,876 thousands (Figure 1.1). In 2000, the number of countries with more than 10 million people aged 60 or over increased to 12, including 5 with more than 20 million older people: China (129 million), India (77 million), the United States of America (46 million), Japan (30 million) and the Russian Federation (27 million).
Table 1.1 Global population distribution according to the development levels and age groups in 2013, 2050
Population in 2013 (millions) Population in 2050 (millions)
Development group or major area 0-14 15-59 60+ 80+ Total 0-14 15-59 60+ 80+ Total
World 1 878 4443 841 120 7 162 2 034 5496 2 020 392 9 551
More developed regions 206 760 287 57 1 253 210 655 417 124 1 303
Less developed regions 1 672 3683 554 63 5 909 1 825 4820 1 603 268 8 248
Least developed countries 360 491 49 5 898 545 1082 183 21 1 811
Percentage distribution by age group World
26 62 12 1.7 100 21 58 21 4.1 100
More developed regions 16 61 23 4.5 100 16 52 32 9.5 100
Less developed regions 28 63 9.4 1.1 100 22 58 19 3.2 100
Least developed countries 40 55 5.4 0.5 100 30 60 10 1.1 100
Note: Estimates and projections are based on the medium variant
Source: Population Division of the Department of Economic and Social Affairs of the United Nations Secretariat (2013). World Population Prospects: The 2012 Revision
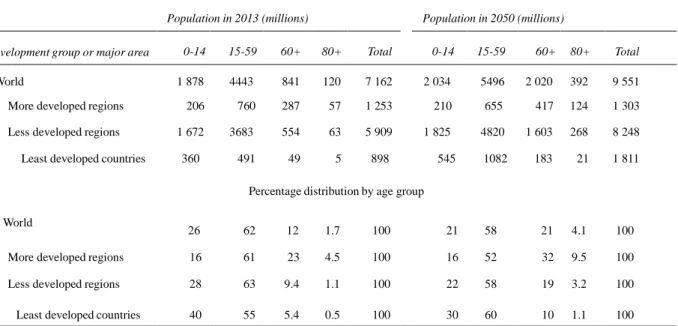
In 2013, the number of the older persons aged 60 or over rose to 841 million, which equals about 12 percent of the world population (Table 1.1). It is expected to reach 2020 million and occupy 21 percent of the world population in 2050 (Table 1.1). At that time, 33 countries are expected to have more than 10 million people aged 60 or over, including 5 countries with more than 50 million older people: China (437 million), India (324 million), the United States of America (107 million), Indonesia (70 million) and Brazil (58 million).
During the process of population ageing, the more developed regions have been in
4
the leading position and their experience provides a point of comparison for the expected ageing of the population of the less developed regions. In 1950, the number of children (age under 15) in the more developed world was more than twice the number of older persons (those aged 60 years or over), with children accounting for 27 per cent of the total population and the older persons for only 12 percent (United Nations, 2011).
In 2013, the proportion of older persons in the more developed regions was more than that of children (23 percent versus 16 percent, Table 1.1) and it is expected to be double that of children (32 per cent versus 16 per cent, Table 1.1) in 2050. By then, the number of older persons in more developed regions is projected to increase to 417 million.
In contrast with the process of population ageing experienced in the past by most countries in the more developed regions, the ageing process in most of the less developed regions is taking place in a much shorter period of time, and it is occurring on relatively larger population bases. To date, population ageing had been considerably slower in the less developed regions where fertility has been still relatively high. In
5
1970, the age pyramids had the triangular shape of a youthful population in both the less and more developed regions, and the base was much wider in the less developed regions (Figure 1.1). In 2010, the percentage of the population aged less than 15 years old decreased substantially comparing with 1970 for the less developed countries, while the percentage of the older persons who aged more than 60 years old age increased.
Although the pyramid was still triangular in the less developed regions, its base had started to narrow. As for the more developed countries, the age pyramid had transitioned to one that bulged at the working ages, denoting a population where ageing was already under way.
In 2050, the age pyramids are projected to be more rectangular in both the less and more developed countries, a sign of a more advanced stage of the population ageing (Figure 1.2). At that time, the proportion of older persons of the less developed countries is projected to reach 19 percent, whereas their proportion of children is projected to decline to 22 percent. Concerning the more developed countries, the percentage of the elderly aged more than 60 years will be two times bigger than that of children less than 15 years old(32% versus 16% as shown in Table 1.1). At the global level, the number of the population aged 60 or over will be almost same to that of the population aged 0-14, with the number of 2,020 million versus 2,034 million (Table 1.1).
0 1000000 2000000 3000000 4000000 5000000 6000000 7000000
1950 1960 1970 1980 1990 2000 2010 2050 2100
Figure 1.3 The world population by broad age group 1950-2100 Note: Estimates and projections are based on the medium variant.
Source:United Nations, Population Division (2013). World Population Prospects: The 2012 Revision
population age 0-14 (thousands) population age 15-59 (thousands) population age 60 or over (thousands)
6
Historically, the population of older persons in the world was small compared to the number of younger adults and of children (persons younger than 15 years), it will be the first time in human-being’s history that the number of these two age groups becomes almost equal. As illustrated in the Figure 1.3, the gap between the number of the population aged 60 or over and that of the 0-14 became narrowed since the year of 2000, since then, the population of children started levelling off while the growth of the older population accelerated dramatically.
It is worth noting that the older population itself is ageing. Within the older population, the proportion aged 80 years or over, which was 14 percent (120 million /841 million) in 2013, is projected to reach 19 percent (392 million/2020 million) in 2050 (Table 1.1). If this projection is correct, there will be 392 million persons aged 80 years or over by 2050, 3.3 times (392 million/120 million) more than today (Table 1.1).
As mentioned previously, decreasing fertility along with lengthening life expectancy was the main causes of the population aging and has reshaped the age structure of the population in most regions of the planet by shifting relative weight from younger to older groups. Between these two causes, fertility decline has been the primary determinant of population ageing (United Nations, 2013). It is because as fertility moves steadily to lower levels, people of reproductive age have fewer children relative to those of older generations, with the result that sustained fertility reductions eventually lead to a reduction of the proportion of children and young persons in a population and a corresponding increase of the proportions in older groups (United Nations, 2007b).
At the world level, total fertility rate—that is, the average number of children a woman would bear if fertility rates remained unchanged during her lifetime (United Nations, 1991)—is 4.97 children per woman in 1950-1955, it will decrease to 2.50 in 2010-2015 and less than the replacement level (the level that need to be sustained over the long run to ensure that a population replaces itself, close to 2.1 children per woman) in 2095-2100 (Figure 1.4).
Significant difference lies between the developed countries and the less developed countries, as the total fertility rate is below the replacement level in the more developed regions; meanwhile, the total fertility rate declines in the less developed regions started later but have proceeded faster. As a result of the sustained decline that occurred during the twentieth century, the average total fertility rate in the more developed regions has
7
dropped from an already low level of 2.83 children per woman in 1950-1955 to an extremely low level of 1.68 children per woman in 2010- 2015.
Presently, the total fertility rate is below the replacement level in practically all industrialized countries. As for the less developed countries, the total fertility reductions occurred later than the developed countries. Comparing with the developed countries, the average total fertility rate in the less developed regions dropped substantially, from 6.08 children per woman in 1950-1955 to 2.63 in 2010-2015. A particularly sharp reduction is also expected for the least developed countries, where the average total fertility rate may reach 2.11 children per woman in 2045-2050, down from 6.55 in 1950-1955 and 4.20 in 2010- 2015 (Figure 1.4). However, although the difference in total fertility between the more and the less developed regions narrows considerably by midcentury, the less developed regions are still expected to have a higher total fertility than the more developed regions, and this can be demonstrated by the Figure 1.5.
4.97
3.60
2.50
2.24
2.10
1.99 2.83
1.84
1.68 1.85 1.91 1.93
6.08
4.18
2.63
2.29
2.12
1.99
6.55 6.55
4.20
2.87
2.40
2.11
0 1.00 2.00 3.00 4.00 5.00 6.00 7.00 8.00
1950-1955 1980-1985 2010-2015 2045-2050 2070-2075 2095-2100 Figure 1.4 Total fertility rate of the world and major developement groups Note: Estimates and projections are based on the medium variant
Source:United Nations, Population Division (2013). World Population Prospects: The 2012 Revision WORLD
More developed regions
Less developed regions
Least developed countries
8
47
62
70
76 79 82
65
73
78
83 86 89
42
60
68
75 78 81
36
49
61
70
75 78
0 10 20 30 40 50 60 70 80 90 100
1950-1955 1980-1985 2010-2015 2045-2050 2070-2075 2095-2100
Figure 1.6 Life expectancy at birth of the world and the main development regions: 1950-2100 Note: Estimates and projections are based on the medium variant
Source:United Nations, Population Division (2013). World Population Prospects: The 2012 Revision WORLD
More developed regions Less developed regions Least developed countries
Figure 1.5 World fertility rate maps in 1950-1955, 2010-2015, 2050-2055 and 2095-2100
Note: These maps display estimates of total fertility for all countries of the world as well as probabilistic projections of total fertility, which have been carried out using a Bayesian Hierarchical Model (BHM). These estimates and projections have been prepared for the 2012 Revision of the World Population Prospects
9
As fertility rates move towards lower levels, mortality decline, especially at older ages, assumes an increasingly important role in population ageing (United Nations, 2007b). Actually, over the last six decades, life expectancy at birth increased more than 20 years globally, from 47 years in 1950-1955 to 70 years in 2010- 2015 (Figure 1.6).
On average, the gain in life expectancy at birth was 26 years in the less developed regions and 13 years in the more developed regions. Over the next 40 years, life expectancy at birth at the global level is expected to reach 76 years in 2045-2050 and 82 years in 2095-2100 (Figure 1.6).
Nevertheless, a considerable advantage still persists between the developed countries and the less developed countries. The more developed regions already had a high expectation of life in 1950-1955 (65 years) and have since experienced further gains in longevity. By 2010-2015 their life expectancy stood at 78 years, 10 years higher than in the less developed regions where the expectation of life at birth was 68 years. In 2045-2050, the life expectancy is expected to reach 83 years in the more developed regions and 75 years in the less developed regions, outliving by almost 8 years an individual born in the less developed regions, such a gap will sustain even in 2095-2100 (89 versus 81).
Except for a small number of countries, where cultural factors have contributed to lower female life expectancy, in nearly all countries of the world, female life expectancy at birth is higher than that of males. At the world level, females have a life expectancy of 47.92 years in 1950-1955, compared to 45.92 years for males (Table 1.2).
The gap between male and female increased to almost 5 years in 2005-2010 (66.52 versus 71.00). The developed countries and the less developed countries differed considerably on the gender gap on the life expectancy. In 2005-2010, the female advantage of the life expectancy is considerably larger in the more developed regions (7 years) than in the less developed regions (3.6 years). As for the least developed countries, the gap between male and female life expectancy is particularly narrow (2.2 years) in the same period. However, in 2045-2050, the gender gap on life expectancy is expected to narrow in the more developed regions, and widen in the less developed regions. The gap between male and female life expectancy is expected to narrow on the world level and in all regions expect the least developed countries where it is expected to stabilize since 2045-2050 at about 4 years in 2095-2100.
10
Table 1.2 Life expectancy at birth of major area by gender: estimates and projections: 1950-2100
Major areas
1950-1955 2005-2010 2045-2050 2095-2100
male female male female male female male female
WORLD 45.92 47.92 66.52 71.00 73.71 78.16 79.93 83.72
More developed regions 62.06 67.16 73.37 80.41 79.91 85.73 86.46 91.42
Less developed regions 41.26 42.01 65.23 68.80 72.71 76.77 79.09 82.68
Least developed countries 35.50 37.36 57.34 59.49 68.53 72.28 75.64 79.66
Note: Estimates and projections are based on the medium variant
Source: United Nations, Department of Economic and Social Affairs, Population Division (2013). World Population Prospects: The 2012 Revision
Population ageing, as a global phenomenon, had affected, is affecting and will affect both every individual in the micro level, no matter man or woman, child, adult or the elderly; and each society or country in the macro level. Specifically, population aging exerts its effect on our life in three ways: in the political sphere, it can influence the results and patterns of voting; in the economic area, it will have an impact on labor markets, intergenerational transfers, savings, pensions, investment and consumption; in the social filed, it can affect living arrangements, family composition and health and health care.Recognizing that the political, economic and social impact of population ageing is both an opportunity and a challenge to all societies, issues related to older persons will play a more prominent role in the future.
1.1.1.2 Population aging in Japan
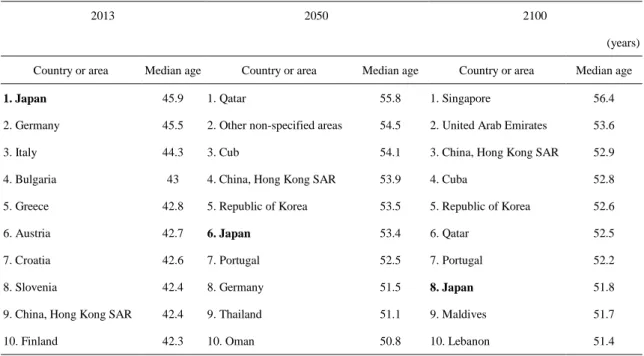
As stated previously, populations in the developed countries are ageing rapidly, while for Japan, it is ageing the quickest. In 1950, Japan had a very young population, there were 6,344 thousands of the older persons aged 60 years or over, constituting 7.7 percent of the total population; in 2010, the number of the elderly older than 60 years increased to 39085 thousands, about 30.7 percent of Japanese people were aged 60 years or older (Figure 1.7), the highest proportion in the world at that time. The median age of the population, another indicator which is usually used to assess the aging condition of specific country or areas, is 45.9 years in Japan in 2013 (Table 1.3), indicating that Japan was the oldest country in the world. Although the rank of Japan
11
will fall to sixth in 2050 and eighth in 2100 while the absolute number of the median age will keep increase since 2013, it will remain in the top ten during this century.
Table 1.3 Ten countries or areas with the oldest populations in 2013, 2050 and 2100
2013 2050 2100
(years) Country or area Median age Country or area Median age Country or area Median age
1. Japan 45.9 1. Qatar 55.8 1. Singapore 56.4
2. Germany 45.5 2. Other non-specified areas 54.5 2. United Arab Emirates 53.6
3. Italy 44.3 3. Cub 54.1 3. China, Hong Kong SAR 52.9
4. Bulgaria 43 4. China, Hong Kong SAR 53.9 4. Cuba 52.8
5. Greece 42.8 5. Republic of Korea 53.5 5. Republic of Korea 52.6
6. Austria 42.7 6. Japan 53.4 6. Qatar 52.5
7. Croatia 42.6 7. Portugal 52.5 7. Portugal 52.2
8. Slovenia 42.4 8. Germany 51.5 8. Japan 51.8
9. China, Hong Kong SAR 42.4 9. Thailand 51.1 9. Maldives 51.7
10. Finland 42.3 10. Oman 50.8 10. Lebanon 51.4
Note: estimates and projections are based on the medium variant
Source: United Nations, Department of Economic and Social Affairs, Population Division (2013). World Population Prospects: The 2012 Revision
0%
10%
20%
30%
40%
50%
60%
70%
80%
90%
100%
1950 1960 1970 1980 1990 2000 2010 2050 2100
29080
27898
25016 27311
22389 18385 16921 13573 11474
46775
56405
67697 73740
78591
78058
71347
48547 38260
6344 8198 10995 14861 21269
29272
39085
46209 34737
Figure 1.7 Population by broad age group of Japan 1950-2100 Note: Estimates and projections are based on the medium variant
Source:United Nations, Population Division (2013). World Population Prospects: The 2012 Revision population age 0-14 (thousands) population age 15-59 (thousands) population age 60 or over (thousands)
12
It is projected that the absolute number of the older person older than 60 years old will increase to 46,209 thousands in 2050, accounting for 42.7 percent of the Japanese population; by then, Japan’s population will still have the largest proportion of old people in the world. The increase of the absolute number of the older persons from 1950 to 2100 demonstrated explicitly in Figure 1.7.
On the other hand, while the proportion of the elderly aged 60 years and more increased, the percentage of the children (0-14 years) decreased. In 1950, the children population aged less than 15 years in Japan was 29,080 thousands, accounting for 35.4 percent of the Japanese population (Figure 1.7). This number decreased to 16921 thousands (13.3 percent) in 2010 and 13573 thousands (12.5 percent) in 2050. The trend of decline of the children population will sustain until 2100, by then, the absolute number will fall to 11,474 thousands, constituting 11.0 percent of the total population. It is worth noting that in terms of the proportion of the total population, the old persons have surpassed the children group since 1997 in Japan.
As the primary cause of the population aging, the total fertility rate of Japan declined
4.97 5.02
4.44
3.60
3.04
2.60
2.50
2.24
1.99
5.83 5.76
4.99
3.71
2.96
2.35
2.19
1.89 1.85
3.00
1.99 2.13
1.75
1.48
1.30 1.41
1.72 1.85
0 1.00 2.00 3.00 4.00 5.00 6.00 7.00
1950-1955 1960-1965 1970-1975 1980-1985 1990-1995 2000-2005 2010-2015 2045-2050 2095-2100 Figure 1.8 Total fertility of Japan and its comparison with the world and Asia Source: United Nations, Department of Economic and Social Affairs, Population Division (2013).
World Population Prospects: The 2012 Revision, DVD Edition.
WORLD
Asia
Japan
13
sharply to 1.99 in 1960-1965 after the postwar baby boom, and then underwent a slight growth to 1970-1975(Figure 1.8). Since then, from 1970-1975 to 2000-2005, during these 30 years, the total fertility rate of the Japanese population dropped from 2.13 to 1.30. Although the fertility rate will gradually increase from 1.41 in 2010-2015 to 1.85 in 2095-2100, the fertility rate of the Japanese population is always less than the replacement level (total fertility rate equal 2.1) and the world and Asia during the whole 21th century, which represents the key feature of the population aging.
As another cause of the population aging, the life expectancy of the Japanese population climbed sharply after the World War Ⅱ, amounted from 62 years in 1950-1955 to 69 years in 1960-1965 (Figure 1.9), with an increase of 7 years. A remarkable fact worth noting is the huge gap between Japan and Asia on the life expectancy, 20 years in 1950-1955 and 23 years in 1960-1965. After 1960-1965, the life expectancy of Japan increased gradually. It was over 80 years and reached to 82 years in 2000-2005, while the life expectancy of the world and Asia was still under 70 years. It is projected that the life expectancy of Japan will increase to 88 years in 2045-2050 and 94 years in 2095-2100. Although the life expectancy of the world and Asia also increased and will increase since 1950-1955, their gap with Japan is still large and will sustain across this century, with a minimum of 11 years to the maximum of 23 years.
47 51
59 62 65 67 70
76
82
42
46
58
62 65 69 71
77
83
62
69
73 77 79 82 83
88
94
0 10 20 30 40 50 60 70 80 90 100
1950-1955 1960-1965 1970-1975 1980-1985 1990-1995 2000-2005 2010-2015 2045-2050 2095-2100 Figure 1.9 Life expectancy at birth of Japan compared with the world and asia Sources: United Nations, Department of Economic and Social Affairs, Population Division (2013). World Population Prospects: The 2012 Revision, DVD Edition.
WORLD Asia Japan
14
Table 1.4 Ten countries or areas with the highest life expectancy in 2005-2010, 2045-2050, 2095-2100
2005-2010 2045-2050 2095-2100
(years)
Country or area
Life
expectancy Country or area
Life
expectancy Country or area
Life expectancy
1. Japan 82.7 1. China, Hong Kong SAR 89.0 1. Republic of Korea 95.5
2. China, Hong Kong SAR 82.4 2. Republic of Korea 88.4 2. China, Hong Kong SAR 94.9
3. Switzerland 81.8 3. Japan 88.4 3. Japan 94.2
4. Australia 81.7 4. Singapore 87.7 4. Martinique 94.1
5. Italy 81.5 5. Martinique 87.7 5. Singapore 94.0
6. Iceland 81.4 6. Italy 87.3 6. Guadeloupe 93.5
7. Singapore 81.2 7. Switzerland 87.2 7. Italy 93.3
8. Spain 81.2 8. Australia 87.2 8. Australia 93.2
9. Sweden 81.1 9. Guadeloupe 87.1 9. Switzerland 93.0
10. France 80.9 10. Spain 86.8 10. Spain 92.5
Note: estimates and projections are based on the medium variant
Source: United Nations, Department of Economic and Social Affairs, Population Division (2013). World Population Prospects: The 2012 Revision
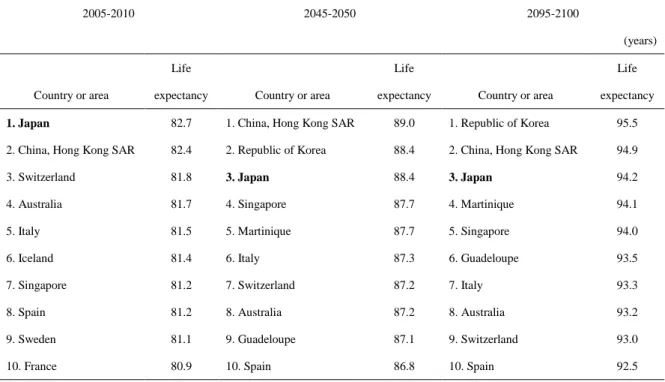
In fact, the life expectancy of the Japanese population was not just higher than the world and Asia, it was the highest one in the world in 2005-5010 (Table 1.4). Although the rank of the life expectancy of the Japanese population will decline to third both in 2045-2050 and 2095-2100, the absolute number of the life expectancy will remain increase. With the higher and higher life expectancy and the lower and lower total fertility rate, such a demographic situation means that Japan’s experiences so far and its prospects in the future hold important lessons for the other countries, since they will soon be facing similar demographic situations.
1.1.1.3 Population aging in China
The success of the economy growth of China is a modern phenomenon, mainly due to the reform and opening-up policy which implemented soon after the Cultural Revolution. The rate of growth and the length it has sustained are unprecedented, making it rank second in terms of Gross Development Product (GDP) in the world and become the envy of the other countries. However, numerous pressing issues that await
15
proper attention lay behind the economic success, such as the demographic change, specifically, the crushing burden of the aging population. In fact, the population aging has been an important feature of the contemporary change of the Chinese population, which has brought many pressures for China itself and the world more generally, although China is a new comer as an aged society.
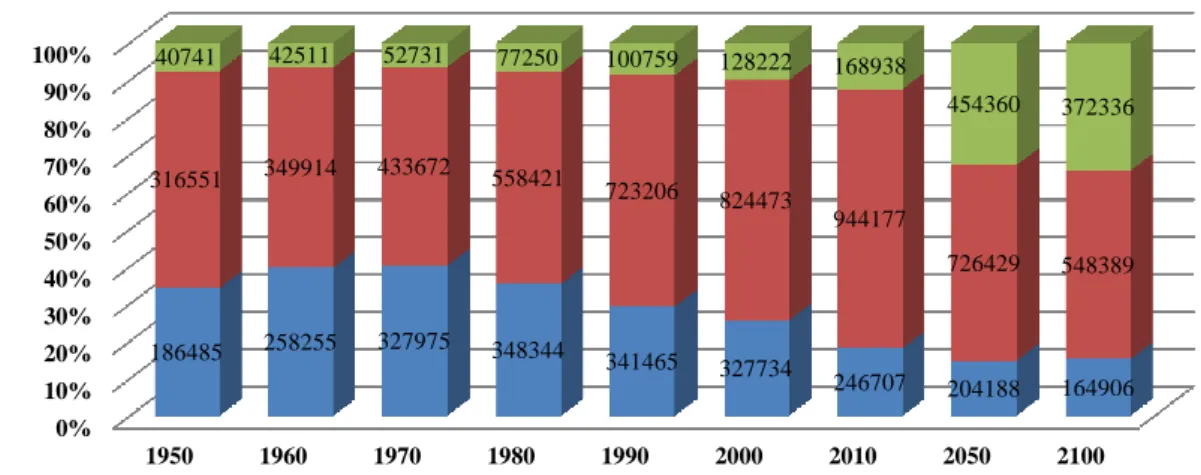
Holding the world’s biggest population, the absolute number of the elderly in China is higher than any other countries in the past, currently and in the future decades. Figure 1.10 apparently demonstrated the increase of the absolute number of the elderly in China since 1950. In 1950, the absolute number of the older persons aged 60 years or over was 40,741 thousands, accounting for 7.5 percent of the total Chinese population at that time (Figure 1.11). It is noted that although the absolute number of the older person aged 60 years and more amounted from 42,511 thousands to 52,731 thousands, the proportion of the elderly remained 6.5 percent in the year of 1960 and 1970, partly due to the baby-booming after the foundation of the Peoples’ Republic of China (PRC) and the calling of the leader of the Chinese Communist Party (CCP) – Mao Tse-tung. Since 1980, both the absolute number and the percentage of the elderly increased again, from 77,250 thousands (7.9 percent) in 1980 to 168,938 thousands (12.4 percent) in 2010. It is worth noting that in the year of 2000, the percentage of the Chinese elderly accounted for 10.0 percent of the total population, which marked the entrance of the aged society.
Since then, the speed of the aging of the Chinese population increased rapidly, and it is
0%
10%
20%
30%
40%
50%
60%
70%
80%
90%
100%
1950 1960 1970 1980 1990 2000 2010 2050 2100
186485 258255 327975 348344 341465 327734
246707 204188 164906 316551 349914 433672 558421
723206 824473
944177
726429 548389 40741 42511 52731 77250 100759 128222 168938
454360 372336
Figure 1.10 Population by broad age group of China 1950-2100 Note: Estimates and projections are based on the medium variant
Source:United Nations, Population Division (2013). World Population Prospects: The 2012 Revision population age 0-14 (thousands) population age 15-59 (thousands) population age 60 or over (thousands)
