N-terminal Hydrophobic Amino Acids of
Activating Transcription Factor 5 Protein Confer
IL-1β-Induced Stabilization
Takanori Abe
TABLE OF CONTENTS
General Introduction 1
1.1. Introduction 2
1.2. Materials and Methods 3
1.2.1. Cell Culture and Reagents 3
1.2.2. Transfection of DNA and Stealth RNA 3
1.2.3. Plasmids 4
1.2.4. Western Blot Analysis 4
1.2.5. Immunoprecipitation 5
1.2.6. Three-dimensional Structure Prediction of ATF5 5 1.2.7. CD Absorption Spectra of ATF5 N-terminal Polypeptides 5 1.2.8. Analysis of the Translation Efficiency of ATF5 mRNA 5 1.2.9. Luciferase Assay 5 1.2.10. Preparation of RNA and Quantification of Transcripts 6 1.2.11. Hydropathy Index 6 1.2.12. AGGRESCAN 6 1.2.13. Statistical Analysis 6
1.3. Results 7
1.3.1. IL-1β Stabilizes ATF5 7 1.3.2. IL-1β-induced Up-regulation of ATF5 Requires the N Terminus
Not Poly-ubiquitination 8 1.3.3. HSP70 Is Responsible for IL-1β-induced ATF5 Up-regulation 10
1.3.4. The Hydrophobic N Terminus Is Responsible for ATF5 Destabilization
and Stress Response 12 1.3.5. Local Hydrophobicity and Aggregation Propensity Are Key Features
for the Stability of ATF5 Protein 16 1.3.6. Inhibition of Autophagic Protein Degradation Does Not Upregulate ATF5 19
1.3.7. IL-1β Increases Translation Efficiency of ATF5 via 5’UTRα and eIF2α
Phosphorylation 20
1.3.8. ATF5 knockdown boosts IL-1β-induced SAA1 and SAA2 expression 22
1.4. Discussion 23
General Discussion and conclusion 25
General Introduction
Activating transcription factor 5 (ATF5) is a stress-response transcription factor of the cAMP response element-binding protein/ATF family. ATF5 contains a basic leucine zipper (bZIP) domain and regulates processes involved in cellular differentiation (1), the cell cycle (2), and apoptosis (3, 4). Jared et al. (5) reported that ATF5 mRNA is induced in LPS-treated macrophage. This suggests ATF5 involument in the regulation of immune response. We have shown that ATF5 mRNA is regulated by it’s 5’ UTRα and phosphorylation of eukaryotic translation initiation factor 2α (eIF2α) (6), and ATF5 protein is stabilized after CdCl2 and NaAsO2 exposure (7). Furthermore, we demonstrated that N-terminal amino acids contribute to the destabilization of the ATF5 protein in steady-state conditions and serve as stabilization domain in the stress response after CdCl2 or NaAsO2 exposure (7). However, the precise
mechanism by which the N-terminal amino acids of ATF5 protein function as a destabilization domain or stress response stabilization domain remains to be elucidated. Gene expression system controlled by stress responsive transcription factors is important to protect cell from a variety of environmental stresses including nutrient limitation, oxidative stress, hypoxia, and infection. However, molecular mechanism of this system has not been fully elucidated.
Acute phase response (APR) is early-defense immune system induced by inflammatory cytokines produced by immune cells, and triggered by various stimuli such as bacterial infection and tissue damage. A variety of acute phase response proteins (APPs) are also synthesized in liver. Using microarray analysis, we found that knockout of ATF5 up-regulates LPS-induced APP expression in mouse liver. This prompted us to investigate whether immune response system regulates ATF5 expression.
1.1. Introduction
Activating transcription factor 5 (ATF5), a transcription factor in the cAMP response element-binding protein/ATF2 family, was first identified by protein blots as a protein that bound the CCAAT/enhancer-binding protein γ (8). Newman et al. (9) reported that ATF5 is a CCAAT/enhancer-binding protein γ-binding transcription factor in a comprehensive protein array analysis. ATF5 contains a basic leucine zipper (bZIP) domain and regulates processes involved in cellular differentiation (1), the cell cycle (2), and apoptosis (3, 4). ATF5 is a target of ubiquitin-mediated proteolysis by Cdc34, a G2 checkpoint gene (2). Recently, Monaco et al. (10) showed that a wide range of carcinomas express ATF5 and that RNA interference of ATF5 causes apoptotic cell death of neoplastic breast cell lines. These findings suggest that ATF5 could be a target for cancer therapy and that studies of ATF5 expression mechanisms could be important in investigating cancer treatments. Mammalian cells alter their gene expression to adapt to a variety of environmental stresses, including nutrient limitation, oxidative stress, and hypoxia, although the exact molecular events controlling stress responses have not been fully elucidated. We discovered that ATF5 is a stress-responsive transcription factor that responds to amino acid limitation, cadmium chloride (CdCl2), and sodium arsenite
(NaAsO2) (7, 11). Roach et al. (12) found that LPS induces ATF5 mRNA expression in
two putative translation start sites (uAUG1 and uAUG2), and similar two-uORF configurations. Under nonstressed conditions, the low level of eIF2α phosphorylation favors reinitiation of translation at uAUG2 by scanning ribosomes after translation of uORF1. This precludes translation of the ATF5 ORF. Under stressed conditions, highly phosphorylated eIF2α decreases ribosome assembly and favors reinitiation of translation at the ATF5 ORF downstream of uORF2, resulting in elevated ATF5 protein production (6). Many transcription factors, including ATF4, ATF5, and Nrf2, are regulated by modulation of protein stability via the ubiquitin-mediated proteasome pathway (17, 18). We showed that CdCl2 and NaAsO2
exposure stabilizes ATF5 protein and increases ATF5 protein levels (7). Furthermore, we demonstrated that the N-terminal 21 amino acids of ATF5 protein serve as a destabilization domain in steady-state conditions and function as a stress response stabilization domain after CdCl2 and NaAsO2 exposure. Li et al. (19) showed that HSP70 binds to the N-terminal
proline-rich activation domain of ATF5 protein, inhibiting ATF5 protein degradation. Consequently, accumulated ATF5 promotes the survival of glioma cells. Liu et al. (20) also showed that nucleophosmin (NPM1) competes with HSP70 for binding to the basic leucine zipper of ATF5 protein and promotes proteasome- and caspase-dependent ATF5 degradation in hepatocellular carcinoma cells. However, the precise mechanism by which the N-terminal amino acids of theATF5 protein function as a destabilization domain remains to be elucidated. In this study, we investigated IL-1β-induced stabilization of ATF5 and subsequent accumulation in HepG2 human hepatoma cells. The N-terminal hydrophobic amino acids are responsible for ATF5 protein stability. HSP70 knockdown reduced IL-1β -induced up-regulation of ATF5 expression. Furthermore, IL-1β induced eIF2α phosphorylation and elevated the translation efficiency of ATF5 mRNA in HepG2 cells. ATF5 knockdown resulted in the enhancement of the acute phase mRNA response of serum amyloid A1 (SAA1) and serum amyloid A2 (SAA2) induced by IL-1β. This study provides new insights about the roles of ATF5 in the immune response.
1.2. Materials and Methods 1.2.1. Cell culture and reagents
HepG2 cells were maintained in DMEM supplemented with 10% fetal bovine serum. Proteasome inhibitor MG132 (Peptide Institute, Osaka, Japan), IL-1β (PeproTech, Rocky Hill, NJ), CdCl2 (Wako Pure Chemical Industries, Osaka, Japan), and cycloheximide (Wako Pure
Chemical Industries) were added to cell cultures at the indicated concentrations. 1.2.2. Transfection of DNA and stealth RNAi
(5’-GACUCCCUGUUUGAGGGCAUGGACU-3’) were designed using the BLOCK-iTTM
RNAi Designer (Invitrogen). The Stealth RNAiTM negative control duplex (Invitrogen) was used as a negative scrambled siRNA control. For transfection of stealth RNAi, we used a reverse transfection method using RNA i MAX (Invitrogen) according to the instructions of the manufacturer.
1.2.3. Plasmids
pSV40-β-galactosidase was from Promega. pcDNA3.1-FLAG-Luc has been described previously (7). pcDNA3.1-3×FLAG was generated by PCR amplification of a 3×FLAG tag and subcloned into pcDNA3.1(-) (Invitrogen). pcDNA3.1-3×FLAG-ATF5 was generated by cloning human ATF5 cDNA into pcDNA3.1-3×FLAG. pSV40-3×FLAG-ATF5 was generated by substituting an SV40 promoter/enhancer fragment for a CMV promoter/enhancer fragment on pcDNA3.1-3×FLAG-ATF5. Expression vectors for 3×FLAG tagged ATF5 point mutants were generated by inverse PCR amplification using a KOD-Plus-Mutagenesis kit (Toyobo, Osaka, Japan) on the basis of pSV40-3×FLAG-ATF5. pSV40-3×FLAG-Luc was generated by substituting the SV40 promoter/enhancer and a 3×FLAG fragment from pSV40-3×FLAG-ATF5 for the CMV promoter/enhancer and a FLAG fragment on pcDNA3.1-FLAG-Luc. pSV40-3×FLAG-ATF5 (22-282) was generated by subcloning an ATF5 fragment for amino acids 22-282 from pcDNA3.1-FLAG-ATF5 (22-282) (7) into pSV40-3×FLAG. pEGFP-N1 was from Clontech. pATF5 (1-21)-EGFP and pATF5 (1-100)-EGFP were generated by subcloning the human ATF5 N-terminal region (amino acids 1-21 and 1-100) into pEGFP-N1. pATF5 (1-100) pmt-EGFP was generated by inverse PCR amplification using a KOD-Plus-Mutagenesis kit on the basis of pATF5 (1-100)-EGFP. pcDNA3.1-HSP70-HA was generated by PCR amplification of human HSP70 cDNA, HA-tagged by PCR, and cloned into pcDNA3.1(-). pSV40-HSP70-HA was generated by substituting an SV40 promoter/enhancer fragment for the CMV promoter/enhancer fragment on pcDNA3.1-HSP70-HA. The expression vector for HA-tagged ubiquitin (HA-ubiquitin) has been described previously (7). pRL-CMV, pGL3-Basic vector, pCMV-hATF5-5’UTRα-LUC, and pCMV-hATF5-5’UTRα mt2-LUC have been constructed previously (6).
1.2.4. Western blot analysis
Calbiochem), anti-NPM1 (1:4000, Sigma-Aldrich), anti-eIF2α (1:1000, Santa Cruz Biotechnology, Santa Cruz, CA), anti-phospho-eIF2α (1:1000, Santa Cruz Biotechnology), anti-β-galactosidase (1:5000, Promega), anti-EGFP (1:6000, Clontech, Palo Alto, CA), horseradish peroxidase-coupled antimouse secondary antibody (1:5000, Cell Signaling Technology, Beverly, MA), and goat anti-rabbit secondary antibody (1:5000, Santa Cruz Biotechnology).
1.2.5. Immunoprecipitation
Cells were lysed in radioimmune precipitation assay buffer (50 mM Tris-HCl (pH 7.2), 1 mM EDTA, 1% Nonidet P-40, 10% glycerol, 0.2 M NaCl, 2.5 mM EGTA) and 1×completeTM protease inhibitor mixture. When interactions between ATF5 and HSP70 or NPM1 were detected, 0.6 mg of protein lysate was subjected to immunoprecipitation using 30 µl of protein G-Sepharose (GE Healthcare) and 16.5 µg of anti-HA antibody following the protocol of the manufacturer. When ubiquitination of ATF5 was detected, 0.4 mg of protein lysate was subjected to immunoprecipitation using 30 µl of anti-DYKDDDDK tag beads (Wako Pure Chemical Industries) following the protocol of the manufacturer.
1.2.6. Three-dimensional structure prediction of ATF5
The three-dimensional structure of the whole chain for wild-type ATF5 was predicted by the Rosetta server (21) with the Rosetta de novo protocol (22, 23). Using this structure as a template, the three-dimensional structure of the ATF5 mutants was predicted by Modeler (24) with homology modeling. All calculations for the structure prediction were carried out with default parameter settings.
1.2.7. CD absorption spectra of ATF5 N-terminal polypeptides
CD measurement was carried out using a J-720 spectropolarimeter (Jasco, Hachioji, Japan). The 27-residue peptide (MSLLATLGLELDRALLPASGLGWLVDY) corresponding to the N-terminal sequence of ATF5 was dissolved in 5 mM Tris-HCl buffer (pH 7.3), 50% (v/v) methanol. The spectrum was recorded from 200-250 nm at 25 °C, and the solvent background was then subtracted. The spectrum is reported as the average of five scans with 2-s signal averaging and using a 1.0-nm bandwidth. A 0.5-cm path length quartz cuvette was used. The peptide concentration was 8.7 µM.
1.2.8. Analysis of the translation efficiency of ATF5 mRNA
Cells were harvested in 1 ml of phosphate-buffered saline, and 300 µl of cell suspension was centrifuged. Pellets were dissolved in passive lysis buffer for luciferase activity measurement, and 700 µl was used for RNA extraction and quantification of luciferase mRNA.
Cells were lysed in passive lysis buffer (Promega), and luciferase activities were determined using a Dual-Luciferase reporter assay system (Promega) and Lumat LB 9501 (EG and G Berthold, Bad Wildbad, Germany). Activities were normalized to Renilla luciferase.
1.2.10. Preparation of RNA and quantification of transcripts
Total RNA was isolated using a GenElute mammalian total RNA miniprep kit (Sigma-Aldrich). Reverse transcription using 0.5 µg of RNA and oligo (dT) 12-18 primer (Invitrogen) was performed with ReverTra Ace (Toyobo) according to the instructions of the manufacturer. Reverse-transcribed first-strand cDNA was quantified by real-time quantitative PCR (ABI PRISM 7000 sequence detection system) using SYBR○R Premix Ex TaqTM II
(Takara, Shiga, Japan). For the PCR of SAA1, SAA2, and β-actin, samples received 50 °C for 2 min; 95 °C for 30 s; and 40 cycles at 95 °C for 5 s, 57 °C for 30 s, and 72 °C for 45 s. For PCR of beetle luciferase and Renilla luciferase, samples received 50 °C for 2 min, 95 °C for 30 s, and 40 cycles at 95 °C for 5 s and 60 °C for 31 s. The following oligonucleotides were used for the amplification of the cDNA corresponding to SAA1, SAA2, ATF5, β-actin, beetle luciferase, or Renilla luciferase: SAA1, 5’-CTGCAGAAGTGATCAGCG-3’ and 5’-ATTGTGTACCCTCTCCCC-3’; SAA2, 5’-CTGCAGAAGTGATCAGCA-3’ and 5’-ATTATATGCCATATCTCAGC-3’; ATF5, 5’-TGGATCTCCTTCCCTCCTTT-3’ and 5’-GCTCTATCCTGTCGCCACTC-3’; β-actin, 5’-AAACTGGAACGGTGAAGGTG-3’ and
5’-AGAGAAGTGGGGTGGCTTTT-3’; beetle luciferase,
5’-ACAAGGATGGATGGCTAC-3’ and 5’-CTTCAGGCGGTCAACGAT-3’; and Renilla
luciferase, 5’-ATGGGATGAATGGCCTGATA-3’ and
5’-GCTGCAAATTCTTCTGGTTCT-3’. 1.2.11. Hydropathy index
Kyte-Doolittle hydropathy plots (25) were used to predict hydrophobic regions in proteins. A Kyte-Doolittle score of >0 indicates a hydrophobic region, and <0 indicates a hydrophilic region (25).
1.2.12.Aggrescan
AGGRESCAN was used to calculate the influence of sequential changes on protein aggregation propensity (27, 28).
1.2.13. Statistical analysis
1.3. Results
1.3.1. IL-1β stabilizes ATF5
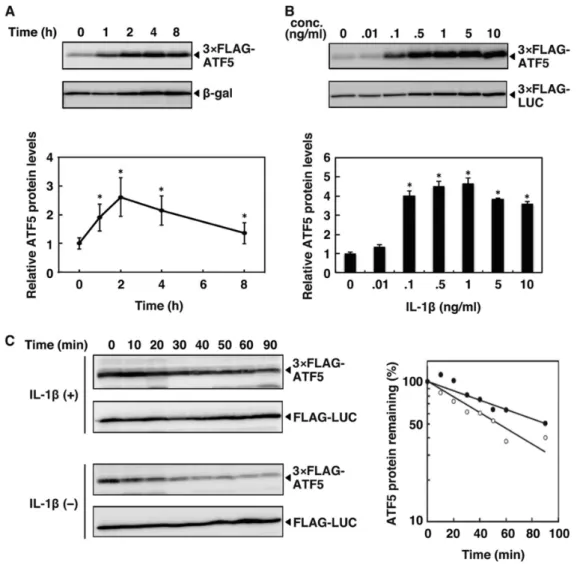
Treatment of HepG2 cells expressing 3×FLAG-ATF5 with IL-1β (0.1 ng/ml) increased
ATF5 protein levels within 2 h, with a subsequent ATF5 decrease (Fig. 1A). The up-regulation of ATF5 protein caused by IL-1β was dose-dependent (Fig. 1B). To determine whether IL-1β regulated the stability of ATF5 protein, we monitored the levels of basal and IL-1β-induced ATF5 protein in HepG2 cells after treatment with the protein synthesis inhibitor cycloheximide. As shown in Fig. 1C, in untreated cells, ATF5 was degraded rapidly, with a half-life of 57 min. In IL-1β-treated cells, ATF5 was stabilized, with a half-life of 104 min. These results indicate that IL-1β increases the ATF5 protein levels, at least in part, by protein stabilization.
Figure 1. IL-1β increases ATF5 protein by enhancing stability. A, HepG2 cells were transiently
analyzed by Western blot analysis using anti-FLAG and anti-β-galactosidase. Relative ATF5 protein levels were determined as the ratio of 3×FLAG-ATF5 to β-galactosidase. ATF5 protein in untreated cells was set at 1.0. Each value is the mean ± S.E. of five independent experiments. *, p < 0.05 versus IL-1β (0 h). B, HepG2 cells were transiently cotransfected with 2 µg of pSV40-3×FLAG-ATF5 and 0.5 µg of pSV40-3×FLAG-Luciferase as control. After 48 h, cells were treated with IL-1β at the indicated concentration (conc.) for 2 h. 3×FLAG-ATF5 and 3×FLAG-Luciferase protein contents were analyzed by Western blot analysis as in A. Relative ATF5 protein levels were the ratio of 3×FLAG-ATF5 to 3×FLAG-Luciferase. ATF5 protein in untreated cells was set at 1.0. Each value is the mean ± S.E. of three independent experiments. *, p < 0.05 versus IL-1β (0 ng/ml). C, HepG2 cells were transiently cotransfected with 2 µg of pSV40-3×FLAG-ATF5 and 2 µg of pcDNA3.1-FLAG-Luciferase. After 48 h, cells were treated with IL-1β (5 ng/ml) for 2 h. At time 0, cells were treated with cycloheximide (50 µg/ml) with IL-1β. As a control, cells were treated with cycloheximide without IL-1β. 3×FLAG-ATF5 and FLAG-Luciferase were analyzed by Western blot analysis as in A. Relative ATF5 protein levels were the ratio of 3×FLAG-ATF5 to FLAG-Luciferase. ATF5 in cells untreated with cycloheximide (time 0) were set at 100%. Each value is the mean ± S.E. of three independent experiments.
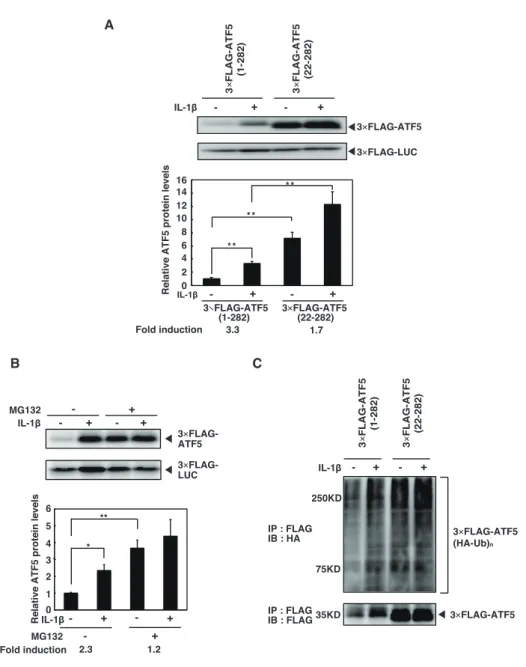
1.3.2. IL-1β-induced up-regulation of ATF5 requires the N-terminus, not polyubiquitination
In a previous study, we showed that the N-terminal region of ATF5 is responsible for both basal and CdCl2-induced expression of the ATF5 protein (7). To examine whether the N-
Figure 2. Stabilization of ATF5 by IL-1β requires the N-terminal region and is not dependent on polyubiquitination-mediated degradation. A, HepG2 cells were transiently cotransfected with 2 µg
pSV40-3×FLAG-ATF5 (1-282) or pSV40-3×FLAG-ATF5 (22-282) and 0.5 µg pSV40-3×FLAG-Luciferase as control. After 48 h, cells were treated with IL-1β (0.1 ng/ml) for 2 h. 3×FLAG-ATF5 and 3×FLAG-Luciferase protein was analyzed by Western blot as in Fig. 1A. Relative ATF5 protein was the ratio of 3×FLAG-ATF5 to 3×FLAG-Luciferase. ATF5 in untreated cells transfected with 3×FLAG-ATF5 (1-282) was set at 1.0. Each value is mean ± SE of three independent experiments. **p < 0.01 between indicated groups. B, HepG2 cells were transiently cotransfected with 2 µg pSV40-3×FLAG-ATF5 (1-282) and 0.5 µg pSV40-3×FLAG-Luciferase as control. After 48 h, cells were treated with MG132 (20 µM) for 6 h followed by the treatment of IL-1β (0.1 ng/ml) for 2 h. 3×FLAG-ATF5 and 3×FLAG-Luciferase protein was analyzed by Western blot as in Fig. 1A. C, HepG2 cells were transiently cotransfected with 8 µg pSV40-3×FLAG-ATF5 or pSV40-3×FLAG-ATF5 (22-282) and 8 µg expression vector for HA-ubiquitin. After 48 h, cells were treated with or without IL-1β (0.05
ng/ml) for 1 h with a medium change. After 4 h, cells were lysed in RIPA buffer for immunoprecipitation. 3×FLAG-ATF5 and HA-ubiquitin were analyzed by Western blot using anti-FLAG or anti-HA.
1.3.3. HSP70 is responsible for IL-1β-induced ATF5 up-regulation
Liu et al. (20) showed that ATF5 interacts with HSP70, that this interaction stabilizes ATF5, and that NPM1, a nucleolar chaperone protein, antagonizes the protective effect of HSP70 to promote ATF5 degradation by competition with HSP70 for ATF5 binding. Thus, we examined the effect of HSP70 knockdown on ATF5 expression. HSP70 knockdown by HSP70 siRNA significantly decreased IL-1β-induced up-regulation of ATF5 (Fig. 2A). However, the expression of endogenous HSP70 protein was not induced by IL-1β (Fig. 2B). Furthermore, IL-1β did not decrease the expression of endogenous NPM1 protein (Fig. 2B). These findings prompted us to investigate whether interactions of these proteins and ATF5 were involved in IL-1β-induced ATF5 up-regulation. Coimmunoprecipitation (Fig. 2C,
bottom panels) showed that the levels of the ATF5-HSP70 and ATF5-NPM1 complexes were
Figure 2. HSP70 is responsible for IL-1β-induced up-regulation of ATF5. A, HepG2 cells were transfected
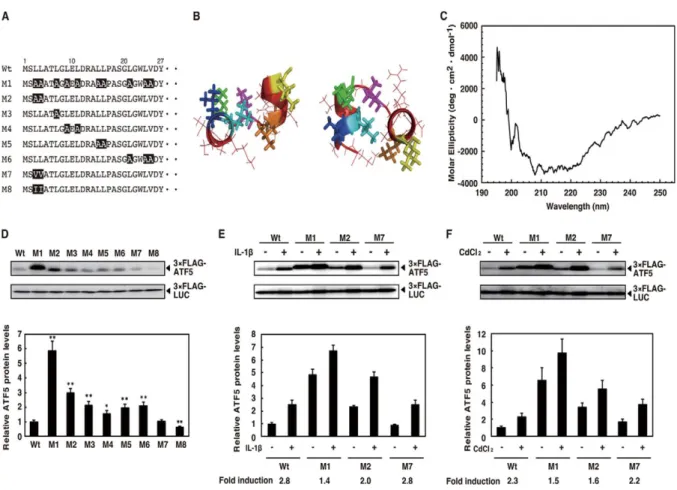
1.3.4. The hydrophobic N-terminus is responsible for ATF5 destabilization and stress response
CdCl2 but to a lesser extent than the ATF5 wild type and ATF5-M7. We next confirmed the
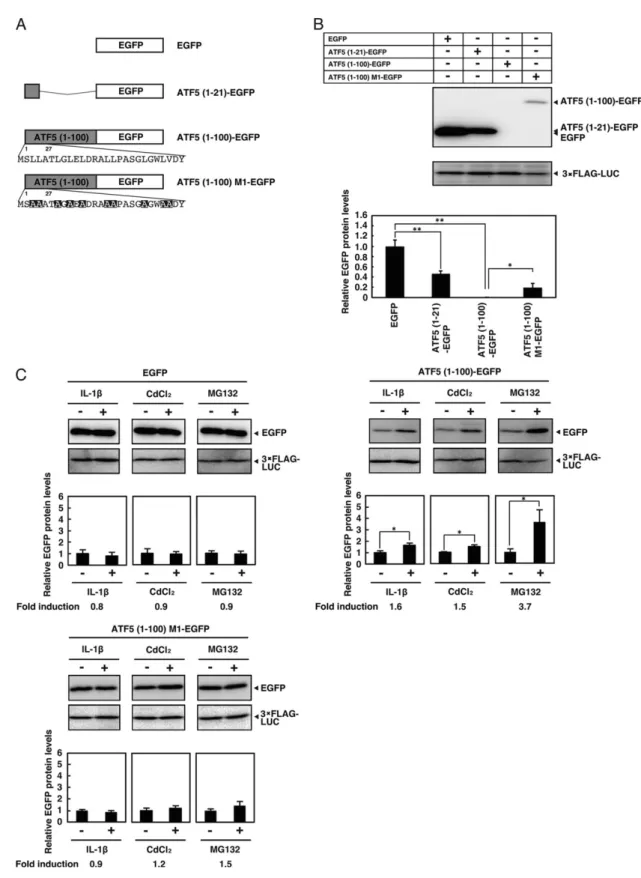
importance of strong hydrophobic amino acid residues in the N-terminus of ATF5 for basal and inducible protein stability using a transient transfection system to express the ATF5 N-terminal region (amino acids 1-21 or 1-100) fused to the N-terminus of GFP protein in HepG2 cells (Fig. 4A). ATF5(1-21)-EGFP expression was partially down-regulated compared with EGFP alone, whereas ATF5(1-100)-EGFP protein expression was severely inhibited (Fig. 4B). Furthermore, the down-regulation of ATF5(1-100)-EGFP was reversed by substituting leucine or valine with alanine in the N-terminus of ATF5. Treatment of HepG2 cells expressing EGFP or ATF5(1-100) M1-EGFP with IL-1β, CdCl2 or MG132 did not
change protein expression levels, whereas cells expressing ATF5(1-100)-EGFP showed significantly increased protein levels under stress conditions (Fig. 4C). These results indicated that the ATF5 N-terminal region fused to N-terminus of EGFP conferred instability and stress responsiveness to the chimeric protein.
Figure 3. Secondary structure predictions of ATF5. JPRED prediction (http://www.compbio.dundee.ac.uk/
Figure 4. N-terminal hydrophobic amino acids of ATF5 are responsible for the destabilization and
response to IL-1β and CdCl2. A, schematic of the structure of the ATF5 N-terminal region (amino acids
1-27) with alanines substituted for leucines and valines. Mutations are shown in black. B, predicted structure of residues 1-15 of wild-type ATF5. Views from the top and side are presented. The backbone structure and side chains are illustrated in ribbon and line/stick presentation, respectively. Leu-3 is colored blue, Leu-4 is cyan, Leu-7 is green, Leu-9 is magenta, Leu-11 is orange, and Leu-15 is yellow. Other residues are shown in red. C, CD absorption spectra of ATF5 N-terminal polypeptides. CD absorption spectra were measured as described under “Experimental Procedures.” D, HepG2 cells were transiently cotransfected with 2 µg of pSV40-3×FLAG-ATF5 (1-282) or a pSV40-3×FLAG-ATF5 point mutant and 0.5 µg of pSV40-3×FLAG-Luciferase as a control. 3×FLAG-ATF5 and 3×FLAG-Luciferase were analyzed by Western blot analysis as in Fig. 1A. Relative ATF5 protein levels were the ratio of 3×FLAG-ATF5 to 3×FLAG-Luciferase. ATF5 in cells transfected with 3×FLAG-ATF5 (Wt) was set at 1.0. Each value is the mean ± S.E. of 10 independent experiments. *, p < 0.05 versus 3×FLAG-ATF5 (Wt); **, p < 0.01 versus 3×FLAG-ATF5 (Wt). E and F, HepG2 cells were transiently cotransfected with 2 µg of pSV40-3×FLAG-ATF5 (1-282) or a pSV40-3×FLAG-ATF5 point mutant (M1, M2, and M7) and 0.5 µg of pSV40-3×FLAG-Luciferase as control. 48 h after transfection, cells were treated with IL-1β (0.1 ng/ml) for 2 h (E) or CdCl2 (50 µm) for 5 h
Figure 5. ATF5 N-terminal region fused to the EGFP N-terminus confers instability and stress response to
IL-1β and CdCl2. A, schematic of ATF5 N-terminal region-EGFP fusions. Mutations are shown in black. B,
3×FLAG-Luciferase. EGFP in cells transfected with pEGFP was set at 1.0. Each value is the mean ± S.E. of six independent experiments. *, p < 0.05 versus ATF5 (1-100)-EGFP; **, p < 0.01 versus EGFP. C, HepG2 cells were transiently cotransfected with 2 µg of pEGFP or pATF5(1-100)-EGFP or pATF5(1-100)M1-EGFP and 0.5 µg of pSV40-3×FLAG-Luciferase as a control. 48 h after transfection, cells were treated with IL-1β (0.1 ng/ml) for 2 h, CdCl2 (50 µm) for 5 h, or MG132 (20 µm) for 6 h. EGFP and 3×FLAG-Luciferase were analyzed by
Western blot analysis using antibodies against FLAG or EGFP. Relative EGFP protein was the ratio of EGFP to 3×FLAG-Luciferase. EGFP in cells transfected with pEGFP was set at 1.0. Fold induction was the ratio of relative EGFP in IL-1β-, CdCl2-, or MG132-treated cells to untreated cells. Each value is the mean ± S.E. of at
least three independent experiments. *, p < 0.05 versus IL-1β (-), CdCl2(-), and MG132(-).
1.3.5. Local hydrophobicity and aggregation propensity are key features for the stability of ATF5 protein
Figure 6. Two hydrophobic regions of the ATF5 N-terminus are essential for destabilization and inducible expression. Kyte-Doolittle hydropathy values for the N-terminal region of ATF5. The window size was set to
terminus on the aggregation potential of ATF5 (amino acids 1-282) was measured using AGGRESCAN. Aggregation potential is represented as hot spots. Black, wild type; red, point mutants (M1 -M8).
1.3.6. Inhibition of autophagic protein degradation does not upregulate ATF5
Aggregation propensity in exposed protein regions correlates with autophagic protein degradation (30). Thus, we examined whether autophagic protein degradation was involved in ATF5 expression. We examined the effect of autophagic inhibition on ATF5 expression using 3-methyladenine and chloroquine (Fig. 8). 3-Methyladenine inhibits PI3K and blocks autophagosome formation. Chloroquine neutralizes the pH value inside the lysosome and inhibits lysosomal protease activities. Chloroquine induced the expression of endogenous LC3-II and p62, presumably by blocking the lysosomal degradation of LC3-II and p62 (Fig. 8). Furthermore, 3-methyladenine inhibited the expression of endogenous LC3-II and up-regulated p62 expression, which indicated an inhibition of LC3-II-positive autophagosomes. These findings indicate that chloroquine and 3-methyladenine effectively inhibit the autophagic protein degradation. However, these inhibitors failed to up-regulate ATF5 expression, whereas the proteasome inhibitor MG132 effectively up-regulated ATF5 expression. These results show that autophagy is not the main catabolic pathway for the ATF5 protein in HepG2 cells.
Figure 8. Inhibition of autophagic protein degradation does not upregulate ATF5 expression. HepG2
cells were transiently cotransfected with 2 µg pSV40-3FLAG-ATF5 (1-282) and 0.5 µg pSV40-3FLAG-Luciferase as control. After 48 h, cells were treated with two different autophagy inhibitors chloroquine (CQ, 100 µM) and 3-methyladenine (3-MA, 1 mM) and a proteasome inhibitor MG132 (20 µM) for indicated time periods. Western blot analysis was used to detect the expression of p62, LC3-I, and LC-3II; β-actin was used as a loading control. Exogenously expressed 3×FLAG-ATF5 and 3×FLAG-Luciferase proteins so analyzed using western blot.
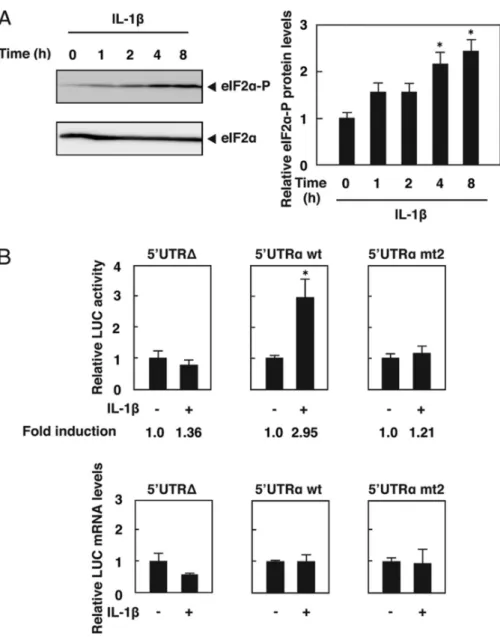
1.3.7. IL-1β increases translation efficiency of ATF5 via 5’UTRα and eIF2α phosphorylation
Figure 9. IL-1β increases the translational efficiency of ATF5 mRNA via eIF2α phosphorylation.
1.3.8. ATF5 knockdown boosts IL-1β-induced SAA1 and SAA2 expression
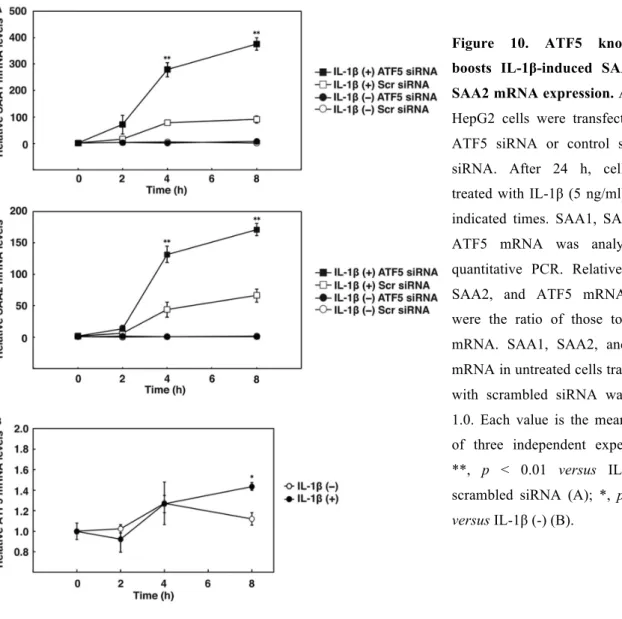
A DNA microarray analysis using mRNAs from the livers of ATF5 knockout mice indicated that SAA1 and SAA2 mRNA expression levels increased with ATF5 gene deficiency. Thorn et al. (33) reported that IL-1β induces SAA1 and SAA2 in HepG2 cells. We examined whether ATF5 knockdown influenced IL-1β-induced SAA1 and SAA2 mRNA expression in HepG2 cells. As shown in Fig. 8, IL-1β significantly induced SAA1 and SAA2 mRNA 79-fold and 44-fold at 4 h. ATF5 knockdown boosted IL-1β-induction of SAA1 and SAA2 mRNA 141-fold and 94-fold at 4 h. These results indicate that ATF5 down-regulates SAA1 and SAA2 expression. However, ATF5 mRNA expression was increased only 1.3-fold after 8 h of IL-1β administration.
Figure 10. ATF5 knockdown boosts IL-1β-induced SAA1 and SAA2 mRNA expression. A and B,
1.4. Discussion
In this study, we investigated the effect of IL-1β treatment of HepG2 cells on ATF5 protein
General discussion and conclusion
APR is the earliest stage of the innate immune responses, which is characterized by fever and APP production. APR is triggered by various stimuli such as bacterial infection, tissue damage, or inflammatory cytokines including IL-1β, IL-6 and tumor necrosis factor-α (TNF-α) secreted from immune cells such as neutrophil granulocytes or macrophages. Secretion of cytokines cause production of acute phase proteins (APP) in liver. Stringent control of the inflammation response is important to minimize the organ burden. However, the precise mechanism by which the inflammation is suppressed and the transcription factor controlling the suppression of inflammation remain to be elucidated.
Activeting transcription factor 5 (ATF5) is a stress-response transcription factor which is known to control cellular differentiation (1), the cell cycle (2), and apoptosis (3, 4). Jared et al. (5) suggest that ATF5 is involved in the regulation of immune response. Previously, we have found that ATF5 might supress LPS-indused APP expression levels in the liver and functions as a negative regulator of APR.
In this study, we show that IL-1β, a proinflammatory cytokine increases the expression of ATF5 protein in HepG2 hepatoma cells in part by stabilizing the ATF5 protein. The N-terminal domain rich in hydrophobic amino acids predicted to form a hydrophobic network was responsible for destabilization in steady-state conditions and served as an IL-1β response domain. Furthermore, IL-1β increased the translational efficiency of ATF5 mRNA via the 5’ UTRα and phosphorylation of eIF2α. ATF5 knockdown in HepG2 cells up-regulated the IL-1β-induced expression of the SAA1 and SAA2 genes. These results support the notion that ATF5 is a negative regulator of IL-1β-induced SAA1 and SAA2 expressions in hepatoma cells, and suggest the importance of ATF5 in inflammation.
1.5. Acknowledgments
Initially, I would like to express my gratitude to Professor Yuji Takahasi for his patient guidance and warm encouragement. I am deeply grateful to Associate Professor Shigeru Takahashi who helped and encouraged me very much throughout the production of this study. I thank Dr. Mariko Umemura and Dr. Haruo Nakano for their constructive comments and warm encouragements. I am also grateful to member of laboratory of Environmental Molecular Physiology.
I sincerely thank Professor Masaki Kojima (Laboratory of Bioinformatics) for prediction of ATF5 three-dimensional structure and helpful discussions. I also thank Dr. Akanuma Satoshi (Laboratory of Extremophiles) for measurement CD absorption spectra of ATF5 N-terminal polypeptides and helpful discussions.
1.6 References
1. Angelastro, J. M., Ignatova, T. N., Kukekov, V. G., Steindler, D. A., Stengren, G. B., Mendelsohn, C., and Greene, L. A. (2003) Regulated expression of ATF5 is required for the progression of neural progenitor cells to neurons. J Neurosci 23, 4590-4600
2. Pati, D., Meistrich, M. L., and Plon, S. E. (1999) Human Cdc34 and Rad6B ubiquitin-conjugating enzymes target repressors of cyclic AMP-induced transcription for proteolysis. Mol Cell Biol 19, 5001-5013
3. Persengiev, S. P., Devireddy, L. R., and Green, M. R. (2002) Inhibition of apoptosis by ATFx: a novel role for a member of the ATF/CREB family of mammalian bZIP transcription factors. Genes Dev 16, 1806-1814
4. Dluzen, D., Li, G., Tacelosky, D., Moreau, M., and Liu, D. X. (2011) BCL-2 is a downstream target of ATF5 that mediates the prosurvival function of ATF5 in a cell type-dependent manner. The Journal of biological chemistry 286, 7705-7713
5. Jared, C. R., Kelly, D. S., Katie, L. S., Stephanie, M. N., Christian, D. H., Daixing Z., Thomas, J. V., Held, G. A., Gustavo, A. S., Leroy, E. H., and Alan, A. (2007) Transcription factor expression in lipopolysaccharide-activated peripheral-blood-derived mononuclear cells. Proc Natl Acad Sci U S A 104, 16245-16250
6. Watatani, Y., Ichikawa, K., Nakanishi, N., Fujimoto, M., Takeda, H., Kimura, N., Hirose, H., Takahashi, S., and Takahashi, Y. (2008) Stress-induced translation of ATF5 mRNA is regulated by the 5'-untranslated region. The Journal of biological chemistry 283, 2543-2553
7. Uekusa, H., Namimatsu, M., Hiwatashi, Y., Akimoto, T., Nishida, T., Takahashi, S., and Takahashi, Y. (2009) Cadmium interferes with the degradation of ATF5 via a post-ubiquitination step of the proteasome degradation pathway. Biochem Biophys Res
Commun 380, 673-678
8. Nishizawa, M., and Nagata, S. (1992) cDNA clones encoding leucine-zipper proteins which interact with G-CSF gene promoter element 1-binding protein. FEBS Lett 299, 36-38
9. Newman, J. R., and Keating, A. E. (2003) Comprehensive identification of human bZIP interactions with coiled-coil arrays. Science 300, 2097-2101
10. Monaco, S. E., Angelastro, J. M., Szabolcs, M., and Greene, L. A. (2007) The transcription factor ATF5 is widely expressed in carcinomas, and interference with its function selectively kills neoplastic, but not nontransformed, breast cell lines. Int J
Cancer 120, 1883-1890
11. Watatani, Y., Kimura, N., Shimizu, Y. I., Akiyama, I., Tonaki, D., Hirose, H., Takahashi, S., and Takahashi, Y. (2007) Amino acid limitation induces expression of ATF5 mRNA at the post-transcriptional level. Life Sci 80, 879-885
Transcription factor expression in lipopolysaccharide-activated peripheral-blood-derived mononuclear cells. Proc Natl Acad Sci U S A 104, 16245-16250
13. Chuang, H. C., Wang, J. M., Hsieh, W. C., Chang, Y., and Su, I. J. (2008) Up-regulation of activating transcription factor-5 suppresses SAP expression to activate T cells in hemophagocytic syndrome associated with Epstein-Barr virus infection and immune disorders. Am J Pathol 173, 1397-1405
14. Holcik, M., and Sonenberg, N. (2005) Translational control in stress and apoptosis. Nat
Rev Mol Cell Biol 6, 318-327
15. Zhan, K., Narasimhan, J., and Wek, R. C. (2004) Differential activation of eIF2 kinases in response to cellular stresses in Schizosaccharomyces pombe. Genetics 168, 1867-1875 16. McEwen, E., Kedersha, N., Song, B., Scheuner, D., Gilks, N., Han, A., Chen, J. J., Anderson, P., and Kaufman, R. J. (2005) Heme-regulated inhibitor kinase-mediated phosphorylation of eukaryotic translation initiation factor 2 inhibits translation, induces stress granule formation, and mediates survival upon arsenite exposure. The Journal of
biological chemistry 280, 16925-16933
17. Lassot, I., Segeral, E., Berlioz-Torrent, C., Durand, H., Groussin, L., Hai, T., Benarous, R., and Margottin-Goguet, F. (2001) ATF4 degradation relies on a phosphorylation-dependent interaction with the SCF(betaTrCP) ubiquitin ligase. Mol
Cell Biol 21, 2192-2202
18. Stewart, D., Killeen, E., Naquin, R., Alam, S., and Alam, J. (2003) Degradation of transcription factor Nrf2 via the ubiquitin-proteasome pathway and stabilization by cadmium. The Journal of biological chemistry 278, 2396-2402
19. Li, G., Xu, Y., Guan, D., Liu, Z., and Liu, D. X. (2011) HSP70 protein promotes survival of C6 and U87 glioma cells by inhibition of ATF5 degradation. The Journal of
biological chemistry 286, 20251-20259
20. Liu, X., Liu, D., Qian, D., Dai, J., An, Y., Jiang, S., Stanley, B., Yang, J., Wang, B., Liu, X., and Liu, D. X. (2012) Nucleophosmin (NPM1/B23) interacts with activating transcription factor 5 (ATF5) protein and promotes proteasome- and caspase-dependent ATF5 degradation in hepatocellular carcinoma cells. The Journal of biological chemistry 287, 19599-19609
21. Raman, S., Vernon, R., Thompson, J., Tyka, M., Sadreyev, R., Pei, J., Kim, D., Kellogg, E., DiMaio, F., Lange, O., Kinch, L., Sheffler, W., Kim, B. H., Das, R., Grishin, N. V., and Baker, D. (2009) Structure prediction for CASP8 with all-atom refinement using Rosetta. Proteins 77 Suppl 9, 89-99
spatial restraints. Journal of molecular biology 234, 779-815
25. Kyte, J., and Doolittle, R. F. (1982) A simple method for displaying the hydropathic character of a protein. J Mol Biol 157, 105-132
26. Fredrickson, E. K., Rosenbaum, J. C., Locke, M. N., Milac, T. I., and Gardner, R. G. (2011) Exposed hydrophobicity is a key determinant of nuclear quality control degradation. Mol Biol Cell 22, 2384-2395
27. Conchillo-Sole, O., de Groot, N. S., Aviles, F. X., Vendrell, J., Daura, X., and Ventura, S. (2007) AGGRESCAN: a server for the prediction and evaluation of "hot spots" of aggregation in polypeptides. BMC Bioinformatics 8, 65
28. de Groot, N. S., Castillo, V., Grana-Montes, R., and Ventura, S. (2012) AGGRESCAN: method, application, and perspectives for drug design. Methods in molecular biology
(Clifton, N.J.) 819, 199-220
29. Cole, C., Barber, J. D., and Barton, G. J. (2008) The Jpred 3 secondary structure prediction server. Nucleic acids research 36, W197-201
30. Kubota, H. (2009) Quality control against misfolded proteins in the cytosol: a network for cell survival. Journal of biochemistry 146, 609-616
31. Zhou, D., Palam, L. R., Jiang, L., Narasimhan, J., Staschke, K. A., and Wek, R. C. (2008) Phosphorylation of eIF2 directs ATF5 translational control in response to diverse stress conditions. The Journal of biological chemistry 283, 7064-7073
32. Oliver, B. L., Cronin, C. G., Zhang-Benoit, Y., Goldring, M. B., and Tanzer, M. L. (2005) Divergent stress responses to IL-1beta, nitric oxide, and tunicamycin by chondrocytes. J Cell Physiol 204, 45-50
33. Thorn, C. F., Lu, Z. Y., and Whitehead, A. S. (2003) Tissue-specific regulation of the human acute-phase serum amyloid A genes, SAA1 and SAA2, by glucocorticoids in hepatic and epithelial cells. Eur J Immunol 33, 2630-2639
34. McDonough, H., and Patterson, C. (2003) CHIP: a link between the chaperone and proteasome systems. Cell Stress Chaperones 8, 303-308
35. Mijaljica, D., Prescott, M., and Devenish, R. J. (2007) Nibbling within the nucleus: turnover of nuclear contents. Cell Mol Life Sci 64, 581-588
36. Vembar, S. S., and Brodsky, J. L. (2008) One step at a time: endoplasmic reticulum-associated degradation. Nat Rev Mol Cell Biol 9, 944-957
37. Gardner, R. G., Nelson, Z. W., and Gottschling, D. E. (2005) Degradation-mediated protein quality control in the nucleus. Cell 120, 803-815
38. Fu, L., Gao, Y. S., Tousson, A., Shah, A., Chen, T. L., Vertel, B. M., and Sztul, E. (2005) Nuclear aggresomes form by fusion of PML-associated aggregates. Mol Biol Cell 16, 4905-4917
39. Janer, A., Martin, E., Muriel, M. P., Latouche, M., Fujigasaki, H., Ruberg, M., Brice, A., Trottier, Y., and Sittler, A. (2006) PML clastosomes prevent nuclear accumulation of mutant ataxin-7 and other polyglutamine proteins. J Cell Biol 174, 65-76
K., Nukina, N., and Tsuji, S. (2009) Intranuclear degradation of polyglutamine aggregates by the ubiquitin-proteasome system. The Journal of biological chemistry 284, 9796-9803
41. Wang, Q., Zhang, H., Zhao, B., and Fei, H. (2009) IL-1beta caused pancreatic beta-cells apoptosis is mediated in part by endoplasmic reticulum stress via the induction of endoplasmic reticulum Ca2+ release through the c-Jun N-terminal kinase pathway. Mol
Cell Biochem 324, 183-190
42. Oyadomari, S., Takeda, K., Takiguchi, M., Gotoh, T., Matsumoto, M., Wada, I., Akira, S., Araki, E., and Mori, M. (2001) Nitric oxide-induced apoptosis in pancreatic beta cells is mediated by the endoplasmic reticulum stress pathway. Proc Natl Acad Sci U S A 98, 10845-10850
43. Yamazaki, T., Ohmi, A., Kurumaya, H., Kato, K., Abe, T., Yamamoto, H., Nakanishi, N., Okuyama, R., Umemura, M., Kaise, T., Watanabe, R., Okawa, Y., Takahashi, S., and Takahashi, Y. (2010) Regulation of the human CHOP gene promoter by the stress response transcription factor ATF5 via the AARE1 site in human hepatoma HepG2 cells.
Life sciences 87, 294-301
44. Chan, J. Y., Biden, T. J., and Laybutt, D. R. (2012) Cross-talk between the unfolded protein response and nuclear factor-kappaB signalling pathways regulates cytokine-mediated beta cell death in MIN6 cells and isolated mouse islets. Diabetologia 55, 2999-3009
45. Verma, G., and Datta, M. (2010) IL-1beta induces ER stress in a JNK dependent manner that determines cell death in human pancreatic epithelial MIA PaCa-2 cells. Apoptosis 15, 864-876
46. Yamada, T. (1999) Serum amyloid A (SAA): a concise review of biology, assay methods and clinical usefulness. Clinical chemistry and laboratory medicine : CCLM /
FESCC 37, 381-388
47. Sellar, G. C., and Whitehead, A. S. (1994) The putative fifth human serum amyloid A protein (SAA)-related gene "SAA5" is defined by SAA3. Biochemical and biophysical
research communications 200, 202-205
48. Whitehead, A. S., de Beer, M. C., Steel, D. M., Rits, M., Lelias, J. M., Lane, W. S., and de Beer, F. C. (1992) Identification of novel members of the serum amyloid A protein superfamily as constitutive apolipoproteins of high density lipoprotein. The Journal of
biological chemistry 267, 3862-3867
49. Malle, E., and De Beer, F. C. (1996) Human serum amyloid A (SAA) protein: a prominent acute-phase reactant for clinical practice. Eur J Clin Invest 26, 427-435
L., Kelvin, D. J., and Oppenheim, J. J. (1994) Serum amyloid A is a chemoattractant: induction of migration, adhesion, and tissue infiltration of monocytes and polymorphonuclear leukocytes. J Exp Med 180, 203-209
53. Chen, C. H., Wang, P. H., Liu, B. H., Hsu, H. H., Mersmann, H. J., and Ding, S. T. (2008) Serum amyloid A protein regulates the expression of porcine genes related to lipid metabolism. J Nutr 138, 674-679
54. Faty, A., Ferre, P., and Commans, S. (2012) The acute phase protein Serum Amyloid A induces lipolysis and inflammation in human adipocytes through distinct pathways.
PLoS One 7, e34031
55. Tam, S. P., Flexman, A., Hulme, J., and Kisilevsky, R. (2002) Promoting export of macrophage cholesterol: the physiological role of a major acute-phase protein, serum amyloid A 2.1. J Lipid Res 43, 1410-1420