Evaluation of Phytoplankton Growth in Estuary as Effect of Nutrient Inputs during Rainfall Using Ecological Model
(
生態系モデルを用いた降雨時の栄養塩流入後の 内湾における植物プランクトン増殖量の評価)
July, 2019
Doctor of Philosophy (Engineering)
Teuku Mahlil
テウク マハリルToyohashi University of Technology
i
Abstract
Eutrophication is currently one of most popular water environment issues in the world. This problem has been occurred and could be seen in several countries with high development in infrastructure, industrial, and agricultural. It is associated with rapid population and economic growth where the development has been pressing provision of human needs in form of food and settlement. To accelerate the provisioning process, the used of various biological and chemical substances including nutrients in the form of nitrogen (N) and phosphorus (P) are massively increased. In its application, most of those substances are, directly or indirectly, leached into aquatic environment as diffuse pollution. Particularly in agricultural sector, the high frequency of fertilizer application and increase of non-point nutrient loads from agriculture has been associated to the impairment of surface and ground water qualities. Leaching process of nutrient from agriculture soil into surface water bodies significantly influenced by rainfall. During rainfall, soil nutrients are flushed out by rainfall run-offs into river and transported into estuaries and extending seaward. Enrichment of nutrients loads in waterbodies are resulting in acceleration of phytoplankton growth by the response of nutrient uptake by phytoplankton itself and photosynthesis. Phytoplankton growth could lead to an imbalance of algal production and consumption, which followed by enhanced sedimentation of algal-derived organic matter, stimulation of microbial decomposition and oxygen consumption, depletion of oxygen, and further affecting mass mortalities of marine animals and leave bad impact on aquaculture and local socio- economic conditions. Eutrophication and phytoplankton growth, especially red tide, has become one of the major pollution problems in several estuaries in Japan including Atsumi Bay, Aichi prefecture. For over 40 years, eutrophication accompanies red tide and hypoxia occurred in every summer season as effect of huge nutrients inputs from industrial and agricultural areas around the bay. Several studies have investigated water quality and phytoplankton growth around Atsumi bay areas. However, effect of huge river inputs in estuaries during rainfall still less investigated. In current study, our purpose is to evaluate nutrient dynamics and phytoplankton growth on estuarine waterbodies with focus on huge river inputs effect during rainfall. Here, the pre- and post- rainfall conditions were at normal meteorological conditions, with heavy rainfall and gentle wind induced water bodies, where salinity and concentration alteration mostly occurred at the surface layer. The evaluations methods of this research are based on field measurement and numerical simulation. In
ii
our simulation, we developed depth-averaged two-dimensional ecological model. The model has ability to simulate nutrient dynamics in form of dissolved nutrients, and phytoplankton growth over estuary. Biochemical parameter fitting becomes important part of the simulation in order to figure out dissolved nutrients cycles and phytoplankton growth. The model simulation is including distribution and transformation of dissolved nitrogen (DN), dissolved phosphorus (DP), and primary production of phytoplankton (Chl a). From field measurement result, we found that freshwater inputs during rainfall had changed post rainfall salinity stratification in the Umeda river transect of Atsumi bay. Post rainfall, an increase of nutrients and a decline in salinity after rainfall proved that a large amount of freshwater, mixed with nutrients, affected water quality conditions in the estuary. The decrease of dissolved nutrients is from the effects of freshwater dilution and phytoplankton uptake which verified by the increase of Chl a and decrease of DN and DP.
Moreover, the influence of freshwater was dominant at river mouth station rather than at other the stations. The further the station was from the river mouth, the lower the influence which depicts the large proportion differences between Chl a, dissolved nutrients, and particulate nutrients concentrations at river mouth station and at the open sea station. In addition, the surface layer was supplied to more than the bottom layer, because the inputs were more influencing horizontal circulation than vertical circulation. It resulted in a small alteration of nutrients and Chl a concentrations compared to the surface layer. In the other hand, our ecological model has provided reasonable results and well correlation with observation data. The evaluation showed, in compare to pre-rainfall condition, increase of dissolved nutrients availability post-rainfall has gained production of phytoplankton in the Bay.
iii
Acknowledgments
In the name of Allah the Most Gracious Most Merciful
First, I would like to thank Allah, the Almighty, for giving me the strength and ability to carry on this study. The completion of this thesis could not have been possible without the participation, support, and assistance of so many people whose names may not all be enumerated. Their contributions are sincerely appreciated and gratefully acknowledged. However, the author would like to express his deep appreciation particularly to the following:
I express my deep gratitude to my supervisor, Professor Takanobu Inoue, for the support and supervision he has provided throughout my study year. He has taught me innumerable knowledge and experience during my study. I have been grateful to be supervised by him who care so much about my work and condition. I would like to thank Professor Shigeru Kato and Associate Professor Kuriko Yokota for taking their time to examine this thesis. I also would like to thank all staff of the Toyohashi University of Technology and Department of Architecture and Civil Engineering to support my study and teaching endeavors.
I must express my very profound gratitude to my parents and family, for the love, endless support and continuous encouragement throughout my years of study and whole life. The accomplishment would not have been likely completed without them.
Finally, great thanks to all my friends, including all Water and Environment Engineering Laboratory of Toyohashi University of Technology's members and all Universitas Pertamina’s lecturers and staff. Thank you very much for your friendship, support, and for every kindness and hospitality.
Author, Teuku Mahlil
iv
Table of Contents
Abstract ... i
Acknowledgment... iii
Table of Contents ... iv
List of Figures ... vii
List of Tables ... x
Chapter 1 Introduction ... 1
1.1 Background of Research ... 1
1.2 General Information ... 2
1.2.1 Estuarine Nutrients ... 2
1.2.2 Nitrogen Compounds ... 3
1.2.3 Phosphorus Compounds ... 4
1.2.4 Eutrophication ... 5
1.2.5 Red Tide ... 6
1.3 Ecological Model ... 7
1.4 Research Purpose ... 8
1.5 Structure of Thesis... 9
REFERENCES ... 10
Chapter II Study Area and Data Collection ... 13
2.1 Study Area ... 13
2.2 Data Collection ... 16
2.2.1 Field Measurement and Analysis Method ... 16
2.2.1.1 River Measurement ... 16
v
2.2.1.2 Estuary Measurement ... 17
2.2.2 Analysis method of water quality ... 17
2.2.3 Secondary Data... 18
2.2.3.1 Meteorological Data ... 18
2.2.3.2 Discharges and Water Level Data ... 20
REFERENCES ... 21
Chapter III Numerical Model Development ... 23
3.1 Ecological Model ... 23
3.2 Depth-Averaged Two-Dimensional Model ... 24
3.2.1 Depth-Averaged Two-Dimensional Hydrodynamic Model ... 25
3.2.2 Depth-Averaged Two-Dimensional Ecological Model ... 27
3.3 Water Density ... 28
3.4 Initial Conditions ... 28
3.5 Boundary Conditions ... 29
3.5.1 Shear Stress ... 29
3.5.2 Free Radiation of Open Boundaries ... 30
3.5.3 Tidal Amplitude ... 31
3.6 Biochemical Reaction ... 32
3.6.1 Phytoplankton Production ... 33
3.6.2 Phytoplankton Uptake ... 34
3.7 Solar radiation ... 36
3.8 Numerical Method ... 37
REFERENCES ... 41
vi
Chapter IV Effect of Nutrient Inputs on Water Quality Change and
Phytoplankton Growth ... 43
4.1 Introduction ... 43
4.2 Water Quality Condition during Summer 2010 ... 44
4.2.1 Water Quality Condition at River Station ... 44
4.2.2 Water Quality Conditions at Estuary Stations ... 46
4.3 Post-Rainfall Water Quality Condition ... 54
4.3.1 Freshwater Influence Salinity Alteration on Pre- and Post-Rainfall ... 54
4.3.2 Chlorophyll a And Nutrient Alterations on Pre- and Post-Rainfall ... 56
4.4 Conclusion ... 61
REFERENCES ... 62
Chapter V Simulation of Phytoplankton Growth as Eutrophication Effect in Estuary ... 65
5.1 Introduction ... 65
5.2 Numerical Model Setup... 66
5.3 Physical Parameter ... 68
5.4 Depth-Averaged Two-Dimensional Model ... 72
5.4.1 Hydrodynamic Model Results ... 72
5.4.2 Ecological Model Results ... 74
5.4.3 Water Quality Change Pre- and Post-Rainfall ... 80
5.4.4 Summary of Depth-Averaged Two-Dimensional Model ... 95
5.6 Conclusion ... 95
REFERENCES ... 96
Chapter VI General Conclusions ... 99
vii
List of Figures
CHAPTER 1
Figure 1.1 Nitrogen Cycle Figure 1.2 Phosphorus Cycle Figure 1.3 Red Tide
CHAPTER 2
Figure 2.1 Location of Ise-Mikawa Bay in Japan Figure 2.2 Bathymetrical Map of Ise-Mikawa Bay Figure 2.3 Atsumi Bay
Figure 2.4 Precipitation Data of Toyohashi City on 2010 Figure 2.5 Wind Rose of Toyohashi City on 2010
Figure 2.6 Sunshine Duration of Toyohashi City on Summer 2010 Figure 2.7 Umeda River Discharges on Summer 2010
Figure 2.8 Observed Water Level at Mikawa Port Tidal Station
CHAPTER 3
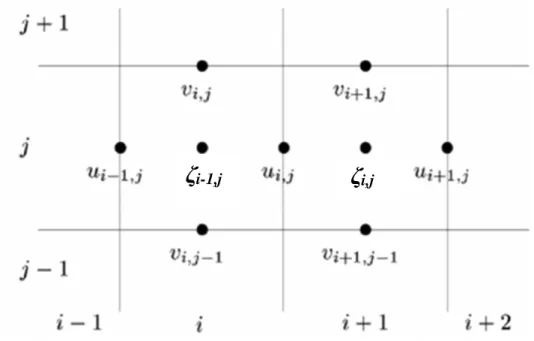
Figure 3.1 Staggered Grid System
CHAPTER 4
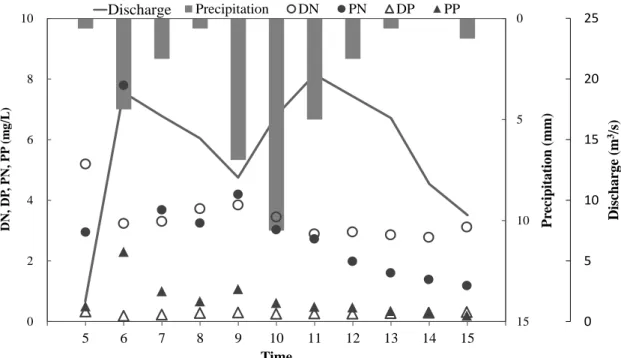
Figure 4.1 Precipitation, Discharges, DN, DP, PN, and PP of Umeda River conditions on Summer 2010
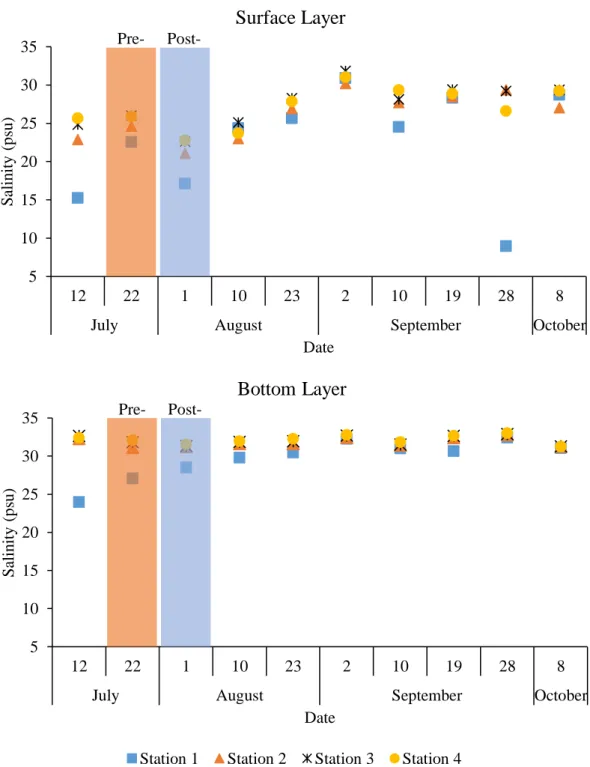
Figure 4.2 Precipitation, Discharges and Nutrients on 29th July during Rainfall at Umeda River Figure 4.3 Observed Estuarine Salinity during Summer 2010
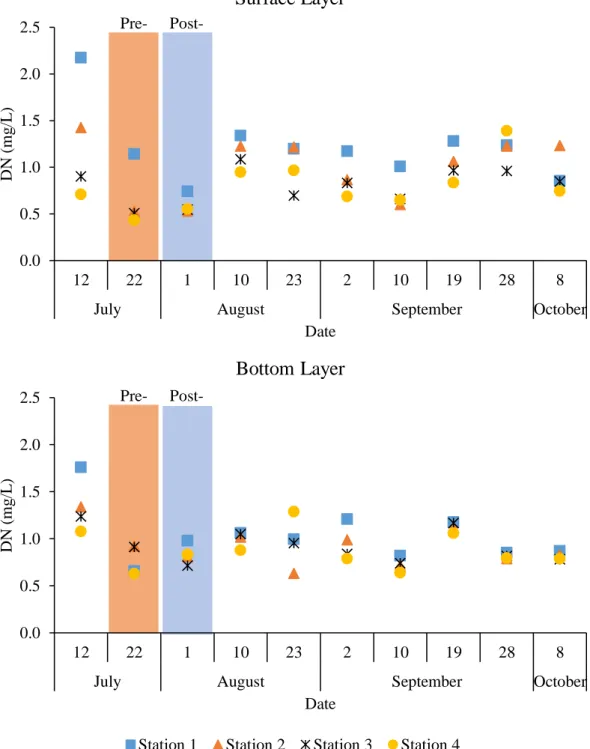
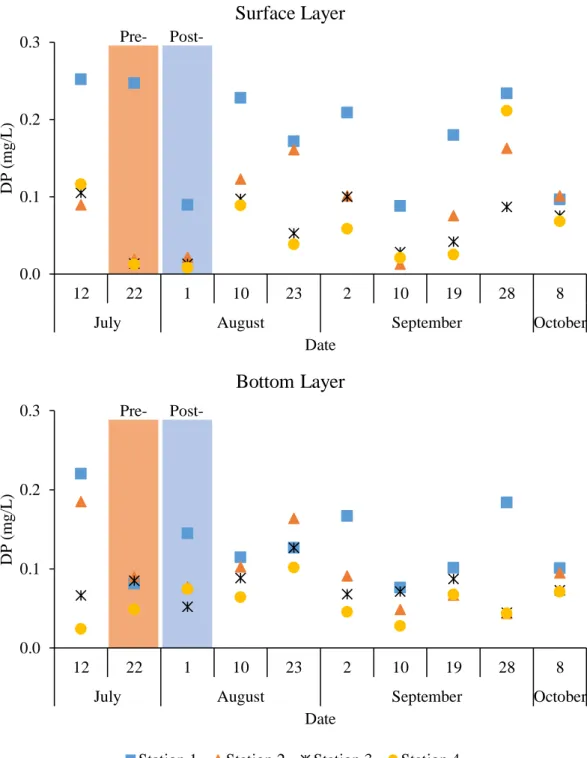
Figure 4.4 Observed Estuarine DN during Summer 2010 Figure 4.5 Observed Estuarine DP during Summer 2010
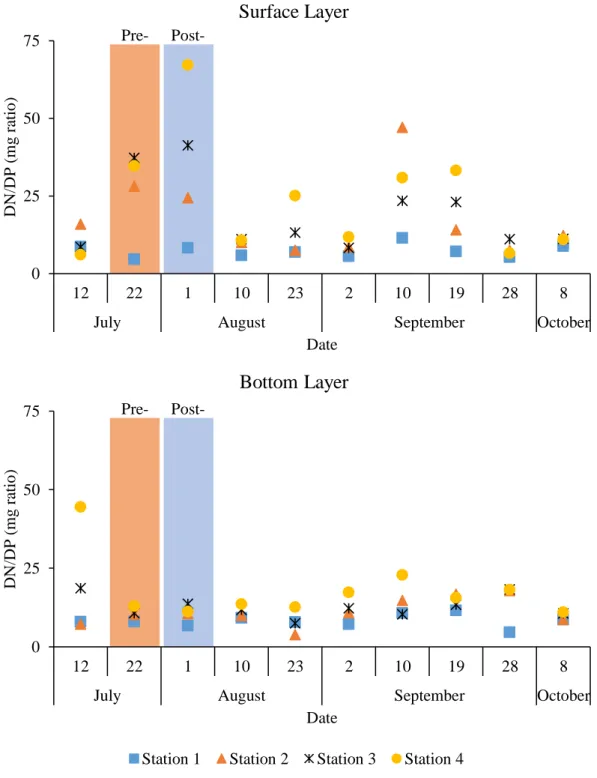
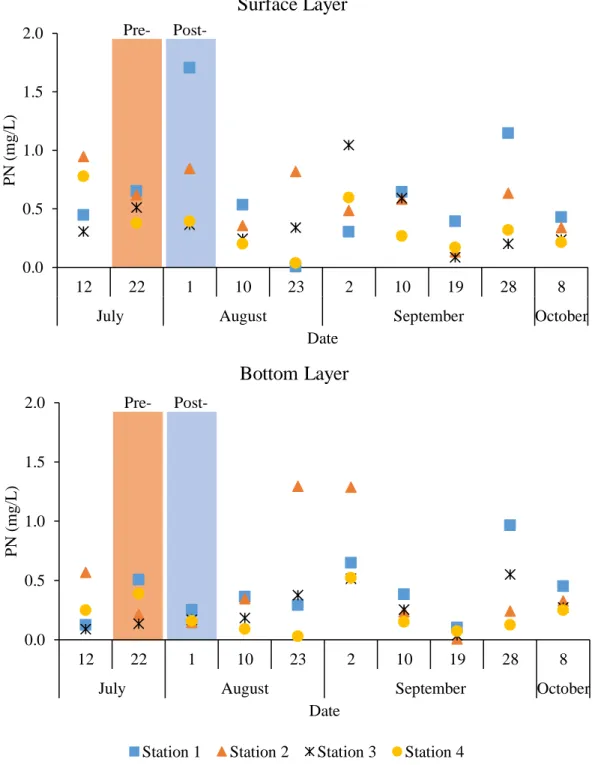
Figure 4.6 Observed Estuarine DN/DP Ratio during Summer 2010 Figure 4.7 Observed Estuarine PN during Summer 2010
viii
Figure 4.8 Observed Estuarine PP during Summer 2010 Figure 4.9 Observed Estuarine Chl a during Summer 2010
Figure 4.10 Estuarine Salinity Condition between Pre- and Post-Rainfall Figure 4.11 Estuarine Chl a Condition between Pre- and Post-Rainfall Figure 4.12 Estuarine DN Condition between Pre- and Post-Rainfall Figure 4.13 Estuarine DP Condition between Pre- and Post-Rainfall
Figure 4.14 Surface Salinity and Dissolved Nutrients (DN and DP) Relation Figure 4.15 Estuarine PN Condition between Pre- and Post-Rainfall
Figure 4.16 Estuarine PP Condition between Pre- and Post-Rainfall Figure 4.17 Chl a and Particulate Nutrients (PN and PP) Relation Figure 4.18 Phytoplankton Biomass on PN and PP
CHAPTER 5
Figure 5.1 Tidal harmonic and water elevation simulation at Mikawa Port Tidal Station Figure 5.2 Observed and harmonic analysis correlation
Figure 5.3 Discharges and Nutrients Concentrations at Umeda River Figure 5.4 Relationship between Discharge and DN Loads
Figure 5.5 Relationship between Discharge and DP Loads Figure 5.6 Observed Solar Radiation of Nagoya Station
Figure 5.7 Validation of Angstrom Equation for Solar Radiation Figure 5.8 Simulated Solar Radiation of Toyohashi City
Figure 5.9 Analytical solution and simulation result of water level (ζ) Figure 5.10 Analytical solution and simulation correlation
Figure 5.11 DN Concentration during Summer 2010 Figure 5.12 DP Concentrations during Summer 2010 Figure 5.13 Chl a Concentration during Summer 2010
Figure 5.14 Discharge, DN, and DP Inputs on 29 July during Rainfall
Figure 5.15 Light Intensity (f2(I)) and Phytoplankton Production (Pgrowth) Relation Figure 5.16 DN, DP, and Chl a Concentration on 22 July
Figure 5.17 DN, DP, and Chl a Concentration on 23 July Figure 5.18 DN, DP, and Chl a Concentration on 24 July
ix
Figure 5.19 DN, DP, and Chl a Concentration on 25 July Figure 5.20 DN, DP, and Chl a Concentration on 26 July Figure 5.21 DN, DP, and Chl a Concentration on 27 July Figure 5.22 DN, DP, and Chl a Concentration on 28 July Figure 5.23 DN, DP, and Chl a Concentration on 29 July Figure 5.24 DN, DP, and Chl a Concentration on 30 July Figure 5.25 DN, DP, and Chl a Concentration on 31 July Figure 5.26 DN, DP, and Chl a Concentration on 1 August Figure 5.27 DN, DP, and Chl a Concentration on 2 August Figure 5.28 DN, DP, and Chl a Concentration on 3 August
x
List of Tables
Table 3.1 Tidal amplitude tabel of Mikawa Port Tidal Station, Atsumi Bay Table 3.2 Biochemical reaction parameters
1
Chapter I Introduction
1.1 Background of Research
Excessive nutrient or eutrophication is currently one of most popular water environment issues in the world. Due to anthropogenic activities, nutrient loads have been changing water quality of aquatic environment such as rivers, lakes, and estuaries throughout the world (Glibert, 2017). This problem have been occurred and could be seen in several countries with high development in infrastructure, industrial, and agricultural. It is associated with rapid population and economic growth where the development has been pressing provision of human needs in form of food and settlement. In order to accelerate the provisioning process, the used of various biological and chemical substances including nutrients in the form of nitrogen (N) and phosphorus (P) are massively increased. In its application, most of those substances are, directly or indirectly, leached into aquatic environment from point and non-point sources.
Particularly in agricultural sector, the high frequency of fertilizer application and increase of non-point nutrient loads from agriculture has been associated to the impairment of surface and ground water qualities (Sharpley, 2013). Leaching process of nutrients from agriculture soil into surface water bodies significantly influenced by rainfall. During rainfall, accumulated nutrients on surface soil are flushed out by rainfall run-offs into river, and transported into estuaries and extending seaward. Enrichment of nutrient loads in waterbodies are resulting in acceleration of phytoplankton growth by the response of nutrient uptake by phytoplankton itself and photosynthesis. Further effect of the growth, as describe by Cloern (2001), could lead to an imbalance of algal production and consumption, which followed by enhanced sedimentation of algal-derived organic matter, stimulation of microbial decomposition and oxygen consumption, and the depletion of oxygen or also
2
called hypoxia. In addition, algal growth could affect mass mortalities of marine animals and leave bad impact on aquaculture and local socio-economic conditions.
1.2 General Information
1.2.1 Estuarine Nutrients
Estuaries are semi-enclosed coastal bodies of water where freshwater mixes with seawater (Dyer, 1973). In other words, estuary also describes as a transitional aquatic environment between river and shore, with typical shallow in depth, where freshwater mixed with seawater. As a typical shallow water with strong connection between land and coastal, estuaries have received huge influences by wind, waves, tides, salinities, off-shores current, and especially riverine inputs which makes estuaries rich with biological and chemical sources. Those factors and some morphological factors including the presence of irregular coastlines, islands, shoals and estuarine constructions have led estuaries to very complex hydrodynamic and transport processes (Hu et al., 2009).
Water quality of estuaries are influenced by chemical and biological conditions of freshwater inputs. In the watershed, freshwater qualities depend on human activities and values of nutrient released to the environment from point sources and non-point sources. Point sources usually release in small values into channel or river by following standard control of local regulation. On the other hand, non-point sources are more difficult to monitor and to control due to unspecific sources and areas. Agricultural area is one example of the biggest non- point sources in land and watershed areas. Agricultural activities such as the application of fertilizer into agricultural field tends to supply high concentration of nutrients, in form of nitrogen (N) and phosphorus (P), which is resulting in accumulation of nutrients in soil bodies. Then, meteorological parameters, including rainfall and discharges, are supporting on distribution of nutrients to whole ecosystems.
Important roles of rainfall and discharges are held by these parameters to distribute nutrients from watershed to estuaries. During rainfall, run-offs flush out nutrients from soil bodies into river and resulting in water quality changes of river freshwater. From river, the discharges take over the task to transport nutrients into estuaries and seaward. Eventually,
3
mixing between freshwater and seawater in estuary and excessive inputs of nutrient are affecting on enrichment of nutrients, or called eutrophication, in the water bodies.
1.2.2 Nitrogen Compounds
Nitrogen is a chemical form that exist in form of nitrogen gas and liquid. In liquid form, nitrogen enters the environment in the form of dissolved nitrogen (DN) and particulate nitrogen (PN). Nitrogen have very complicated cycles in environment as shown on Figure 1.1. Major component of nitrogen cycles are in the forms of organic nitrogen (ON), nitrate (NO3-), nitrite (NO2-) and ammonium (NH4+). The primary source of nitrogen is ON which come to environment externally from plants and animal (including animal excretion and death bodies). By influences of bacterial, ON decomposed and mineralized into form of NH4+. Furthermore, nitrification process occurs by help of bacterial to oxidize NH4+ into the
Figure 1.1 Nitrogen Cycle
Nitrification
Phytoplankton Uptake
Organic
Nitrogen (ON) Mineralization / Decomposition
Consumption
Excretion/
Death
Particulate Nitrogen
Settling Settling
4
form of NO2- and NO3-. NH4+, NO2-, and NO3- are the essential nutrients for algal growth.
Those substances uptake by algal during photosynthesis process by influences of light intensity and water temperature.
In addition, some algal have abilities to convert NO3- into nitrogen gas form of N2 by denitrification process, during low DO conditions, and further release from waterbodies to atmosphere. During fixation process, N2 in atmosphere is consumed by algal and converted into ON form. In this nitrogen cycle, eventually algal is becoming source of nitrogen for animals. Later, all nitrogen from animals is going to be released to environment in the form of ON and the nitrogen cycles restart continuously.
1.2.3 Phosphorus Compounds
Figure 1.2 Phosphorus Cycle Organic
Phosphorus (OP)
Phytoplankton
Mineralization / Decomposition Excretion/
Death
Consumption
Settling
Dissolved Phosphorus
(DP)
Particulate Phosphorus
(PP) Animals
Death
Settling Settling
5
Phosphorus is also essential nutrients for aquatic organism and vital nutrient for algal growth as well as nitrogen. Phosphorus does not have a gas form, it is existed only in the form of inorganic and organic matter including dissolved phosphorus (DP) and particulate phosphorus (PP). Availability of phosphorus in water bodies is very important for photosynthesis process on algal production. Huge inputs of phosphorus in water bodies could result in eutrophication and give adverse effect on excessive algal growth and hypoxia.
As shown in Figure 1.2, phosphorus cycles in environment are started in the form of organic phosphorus (OP). OP is mineralized and decomposed into dissolved phosphorus (DP) and particulate phosphorus (PP). The dissolved form is up taken by algal for photosynthesis where particulate form is settling down to bottom layer, consumes by animals, and sorb by sediments. Moreover, dissolved phosphate in algal bodies is converted as OP. Then, algal will be consumed by animals where later the excretion waste and death bodies of animals also converted into OP.
1.2.4 Eutrophication
Eutrophication is the enrichment of nutrients, N and P, concentrations in waterbody as response of natural processes or human activities. As natural processes, nutrients enrichment may take more than a decade or century to be eutrophic. On the other hand, artificial process including development of countries, enhancement of industries, and the advanced application of fertilizer in agricultural activities has caused significant anthropogenic impacts including eutrophication in lake, river, and coastal environments. Especially in coastal areas, nutrient enrichment caused by riverine inputs is the most widespread and globally significant anthropogenic impact (Billen and Garnier, 1997). Enrichment of nutrients in estuaries produce huge effects in marine ecosystems such as: increased biomass of marine phytoplankton and epiphytic algae, shifts in phytoplankton species composition, changes in macroalgal production, biomass, reduced of water clarities, dissolved oxygen depletion in the water column, increase probability of death of recreationally and commercially important animal species (Smith et al., 1999).
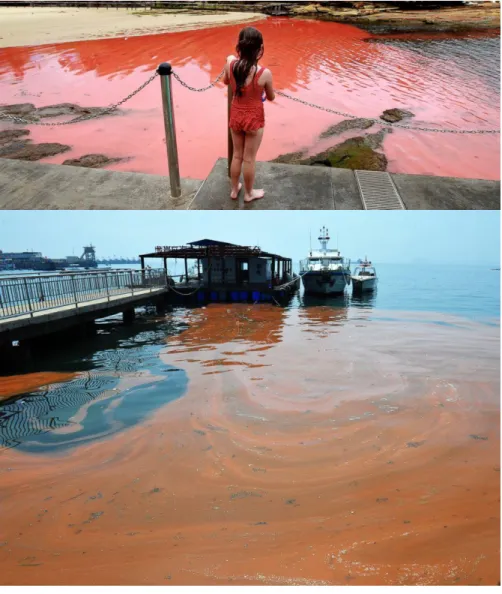
6 1.2.5 Red Tide
Red tide is phytoplankton overgrowth phenomenon as effect of eutrophication in waterbodies (Figure 1.3). The occurrence of red tide is related to phytoplankton production by influence of nutrients, light intensity, and water temperature. Phytoplankton growth is part of nitrogen and phosphorus cycles where phytoplankton uptakes dissolved nutrients and convert it into organic nutrients. On eutrophic estuaries, availability of high nutrient concentrations led highly growth of phytoplankton in water bodies and affecting water transparencies and depletion of oxygen. Decrease of water transparency gives direct effect
Figure 1.3 Red Tide
Source: http://abcnews.go.com/US/massive-red-tide-off-coast-florida/story?id=24963894 Accessed: 19 August 2017 14.01 JST
7
in distribution of light intensity in water layer which use by aquatic plans for photosynthesis process. Less photosynthesis process could result in wilt and drop of aquatic plans where it continues to effect aquatic animals that consume those plans. Moreover, depletion oxygen effect also become harmful to aquatic animals. Disruption of aquatic animals’ population also gives impact to socio-economic condition of people around estuary who are working in fisheries and tourism sectors. In addition, several species of phytoplankton have ability to produce and release toxin into waterbodies which is harmful for aquatic plants and animals, and for people who are leaving around eutrophic estuaries.
1.3 Ecological Model
An ecological model is a tool to evaluate the physical, chemical, and biological characteristic of water bodies. In this study, the model was developed numerically into depth-integrated two-dimensional model. The model is parted into two segments including hydrodynamic and ecological models. In the first segment, hydrodynamic model uses to evaluate current velocities, water level, salinities, and temperatures. The model is evaluated by concerning various terms including advection, diffusion, Coriolis force, pressure gradient, surface wind stress, bottom stress, and density gradients.
Dynamic results of hydrodynamic model are applied to the second segment or called ecological model. The hydrodynamic results are including current velocities simulate distribution of nutrients and phytoplankton concentration (advection term); salinity and temperature to quantify water density conditions; and temperature also uses in analyzing biochemical reaction of phytoplankton growth. In ecological model, the evaluations are specified to mass balance condition of every concentrations in the model including dissolved nitrogen (DN), dissolved phosphorus (DP), and phytoplankton growth in form of Chlorophyll a (Chl a).
Development of hydrodynamic and ecological models are following Navier-Stokes equation which commonly used in numerical model development. Model discretization is using explicit first order upwind scheme for advection terms of depth-integrated two-dimensional
8
model, and explicit second order central scheme for horizontal diffusion terms. Detail of the model is provided at Chapter 2.
1.4 Research Purpose
Eutrophication and phytoplankton growth, especially red tide, has become major pollution problem in several estuaries in Japan such as Tokyo Bay, Ise-Mikawa Bay, and Seto Inland Sea (Nakanishi et al., 1990; Nakane et al., 2006; Suzuki, 2016). Especially for Ise-Mikawa Bay, Aichi Prefecture, Japan, as the widest bay in Central Japan region and surrounding by highly developed cities are continuously dealing with eutrophication and red tides problems.
The bay is divided into two bays region which are Ise bay in the western side and Mikawa bay in the eastern side. Some researchers reported that eutrophication accompany by red tide and hypoxia have been occurred in the bay for more than four decades as effect of rapid development around these areas (Matsukawa and Suzuki, 1985; Bodergat, 1997; Suzuki, 2004). Especially at the eastern side of Mikawa Bay or called Atsumi Bay, red tide and hypoxia occurred in every summer season as effect of huge nutrients inputs from industrial and agricultural areas around the bay.
Several studies have investigated water quality and phytoplankton growth around Ise- Mikawa areas (Sakamoto and Tanaka, 1989; Kasih and Kitada, 2004, 2008; Higashi et al., 2012). Especially for water quality changes in Atsumi Bay, the study had been studied by Rasul (2013) and Rasul et al. (2013, 2014) with focused on the effects of nutrient enrichment and hypoxia after a typhoon event, with three major river inputs including the Toyo, Umeda, and Shio rivers. In their study, the evaluation was based on extreme meteorological conditions with very heavy rainfall and strong wind induced water bodies, which resulted in salinity dilution and significant changes in nutrient concentrations from the surface to the bottom layer. However, effect of huge river inputs in estuaries during rainfall still less investigated.
In the current study, attention was paid to the effect of the Umeda River inputs on nutrient concentration changes and phytoplankton growth on pre- and post-rainfall water quality conditions in Atsumi Bay, especially around the Umeda transects. Here, the pre- and post- rainfall conditions were observed under normal meteorological conditions with heavy
9
rainfall and gentle wind-induced waterbodies, where salinity and concentration alteration mostly occurred at the surface layer. The purpose of the current research was to evaluate the influence of nutrient inputs from the Umeda River to Atsumi Bay. Our evaluation of water quality conditions was for the period of peak phytoplankton bloom in the summer of 2010.
The evaluations methods of this research are based on field measurement and numerical simulation. In our simulation, we developed an ecological model based on depth-integrated two-dimensional model and three-dimensional sigma-coordinate. Model simulations are including distribution and transformation of dissolved nitrogen (DN), dissolved phosphorus (DP), and primary production of phytoplankton in the form of Chlorophyll a (Chl a).
1.5 Structure of Thesis
The present thesis is a study about water quality changes in estuary as effect of huge nutrient inputs during rainfall. In this study, we analyze water quality of Atsumi bay during summer 2010 by observation data analysis and numerical simulation. The whole methods and results of current study are presented and discussed in chapter II, III, IV, and V. In addition, general conclusions of our study is presented in chapter VI.
Chapter I is highlights of general information about nutrients in estuaries, eutrophication, red tide, ecological model, and purpose of this research. Chapter II is describing the study area, data collections from observation and other party’s secondary data. Data observation and analyses methods, research parameters, and secondary data collection are given in detail at this chapter. Chapter III is illustrating the development of depth-averaged two- dimensional ecological model which begin with governing equation, numerical discretization, and parameter inputs.
Chapter IV is discussing about alteration of water quality of Atsumi Bay as effect of nutrient inputs from Umeda River. This chapter show detail discussion about the important finding about summer 2010 water quality condition of the bay, and the impact of enrichment nutrients on phytoplankton production around the bay. In particular, water quality alteration and phytoplankton biomass (in the form of Chlorophyll a) condition around the bay at pre-, during, and post- high precipitation day are clearly explained.
10
Chapter V is examining phytoplankton growth and nutrient dynamics condition of Atsumi Bay using depth-averaged two-dimensional model. All parameters inputs, model setup, data initialization, boundary setting, physical parameter influences, biochemical reaction, and ecological simulation are explained in this chapter. The discussion about water quality alteration and phytoplankton growth in Atsumi Bay as effect of nutrient inputs from Umeda River is notified clearly and specifically. In the final chapter VI, whole finding and results are summarized and presented as conclusions.
REFERENCES
Billen, G., and J. Garnier. 1997. "The Phison River plume: Coastal eutrophication in response to changes in land use and water management in the watershed." Aquatic Microbial Ecology 13: 3–17. doi:10.3354/ame013003.
Bodergat, A-M., Rio, M., Ikeya, N. 1997. "Tide versus eutrophication. Impact on ostracods populations structure of Mikawa Bay (Japan)." Revue de Micropaléontologie 40 (1):
3-13. doi:10.1016/S0035-1598(97)90080-5.
Cloern, J.E. 2001. "Our evolving conceptual model of the coastal eutrophication problem."
Marine Ecology Progress Series 210: 223-253.
Dyer, K. R. 1973. Estuaries: A physycal introduction. New York and London: Wiley- Interscience.
Glibert, P. M. 2017. "Eutrophication, harmful algae and biodiversity — Challenging paradigms in a world of complex nutrient changes." Marine Pollution Bulletin 124(2): 591-606. doi: 10.1016/j.marpolbul.2017.04.027.
Higashi, H., H. Koshikawa, S. Murakami, K. Kohata, M. Mizuochi, and T. Tsujimoto. 2012.
"Effects of land-based pollution control on coastal hypoxia: a numerical case study of integrated coastal area and river basin management in Ise Bay, Japan." Procedia Environmental Sciences 13: 232-241.
Hu, K., P. Ding, Z. Wang, and S. Yang. 2009. "A 2D/3D hydrodynamic and sediment transport model for the Yangtze Estuary, China." Journal of Marine Systems 77 (1- 2): 114-136. doi:10.1016/j.jmarsys.2008.11.014.
Kasih, G. A. A., and T. Kitada. 2004. "Analysis of factors regulating algal bloom in mikawa bay using eutrophication model." Environmental Engineering Research 41: 613-624.
11
Kasih, G. A. A., and T. Kitada. 2008. "Modeling of the role of tideland in eutrophication reduction in Mikawa Bay, Japan." Proceedings of the Symposium on Global Environment 16: 41-50.
Matsukawa, Y., and T. Suzuki. 1985. "Box model analysis of hydrography and behaviour of nitrogen and phosphorus in a eutrophic estuary." Journal of the Oceanographical Society of Japan 41 (6): 407–426. doi:10.1007/BF02109035.
Nakane, T., K. Nakaka, H. Bouman, and T. Plat. 2006. "Environmental control of short-term variation in the plankton community of inner Tokyo Bay, Japan." Estuarine, Coastal and Shelf Science 78 (4): 796-810. doi:doi.org/10.1016/j.ecss.2008.02.023.
Nakanishi, H., M. Ukita, M. Sekine, M. Fukagaw, and S. Murakami. 1990. "Eutrophication Control in Seto Inland Sea." Marine Coastal Eutrophication 1239-1256.
doi:10.1016/B978-0-444-89990-3.50105-X.
Rasul, E. 2013. The influence of typhoon on nutrient dynamics and hypoxia in Atsumi bay, Japan. Toyohashi: Toyohashi University of Technology.
Rasul, E., T. Inoue, S. Aoki, K. Yokota, Y. Matsumoto, Y. Okubo, and Djumanto. 2013.
"Influence of tropical cyclone on the water quality of Atsumi Bay." Journal of Water and Environment Technology 11 (5): 439-451.
Rasul, E., T. Inoue, S. Aoki, K. Yokota, Y. Matsumoto, and Y. Okubo. 2014. "Nutrient enrichmenr and physical environmental effects caused by typhoons in a semi- enclosed Bay." Journal of Ecotechnology Research 17 (3-4): 107-114.
doi:10.11190/jer.17.107.
Sakamoto, M., and T. Tanaka. 1989. "Phosphorus dynamics associated with phytoplankton blooms in eutrophic Mikawa Bay, Japan." Marine Biology 101 (2): 265-271.
Sharpley, A. N. 2013. "Agriculture, Nutrient Management, and Water Quality."
Encyclopedia of Biodiversity (Second Edition) 95-110. doi:10.1016/B978-0-12- 384719-5.00361-0.
Smith, V.H., G.D. Tilman, and J.C. Nekola. 1999. "Eutrophication: Impacts of Excess Nutrient Inputs on Freshwater, Marine, and Terrestrial Ecosystems." Environmental Pollution 100 ((1-3)): 179-196.
Suzuki, C. 2016. "Assessing change of environmental dynamics by legislation in Japan, using red tide occurrence in Ise Bay as an indicator." Marine Pollution Bulletin 102 (2): 283-288.
12
Suzuki, T. 2004. "Large-scale restoration of tidal flats and shallows to suppress the development of oxygen deficient water masses in Mikawa Bay." Bulletin of Fisheries Research Agency Supplement 1: 111-121.
13
Chapter II
Study Area and Data Collection
2.1 Study Area
In central of Japan area, lies one of the biggest bays in Japan which called Ise-Mikawa Bay (Figure 2.1). The bay is in Aichi Prefecture, Japan where several cities such as Nagoya, Toyohashi, Gamagori, other cities located. The Bay is divided into Ise Bay in western side and Mikawa Bay in eastern side (Figure 2.2). Both bays receiving huge influence from Pacific Ocean and watersheds around its surrounding area. Watershed inputs into the bay not only in the form of freshwater discharge, several substances from anthropogenic activities around the watershed also loads to the bay. As example, enrichment nutrients or eutrophication from watershed inputs regularly found in several estuary around the bay which is related to human activities of highly developed cities around the watersheds where most of the cities famed for industrial and agricultural sectors.
This research is conducted in one of the highly developed cities in Aichi Prefecture which calls Toyohashi city. The city is located at eastern part of Mikawa Bay surrounding area where eutrophication and phytoplankton bloom regularly occurred. In this eastern side, people called this bay area as Atsumi Bay. Atsumi Bay is a partially mixed estuary, where river discharge and tidal forces dominantly influence the circulation and stratification of the water bodies. Its topographical condition is shallow and flat with a mean depth of about 10 m. The total area of the bay is approximately 180.5 km2 (Figure 2.3). There are some ports and famous recreational locations around this area as a vital infrastructure to support socio- economy of people around the Bay, especially people in Toyohashi city. The Toyohashi city and Atsumi Bay areas have a temperate climate with average precipitation was around 1,516 mm/year in 2010. During the summer of 2010, rainfall was recorded 39 times with amounts varying from 0.5 mm/day to 81 mm/day. In addition, several typhoons, along with high precipitation, pass through this the area every year during summer season.
14
Figure 2.1 Location of Ise-Mikawa Bay in Japan
Figure 2.2 Bathymetrical Map of Ise-Mikawa Bay
15
As in many countries around the globe, agricultural areas in Japan are one of the major non- point sources of nutrients (Yamada and Inoue, 2005). In Japan, especially in Atsumi Bay, red tide and hypoxia have occurred for a significant number of years due to riverine nutrient inputs mainly originating from the surrounding agricultural areas. Several rivers, such as the Toyo, Umeda, and Shio Rivers, are connected and flow into Atsumi Bay. These rivers are the main suppliers of freshwater and nutrients to the bay. The highest input of nutrients into the bay comes from the Umeda River Watershed (Rasul, 2013). The Umeda Watershed covers approximately 134 km2 and comprises of agricultural area (45.7%), urban area (33.9%), forest area (6.5%), and other areas (13.9%) (Rasul et al., 2013). It was reported by Bodergat et al. (1997) that Mikawa Bay, including Atsumi Bay, has become highly eutrophic due to the increase of nutrient inputs from livestock farms and municipalities as well as from rapid industrial development since the mid-1960s.
Figure 2.3 Atsumi Bay
16 2.2 Data Collection
In this study, we used both primary data from field observation and secondary data from other sources. The primary data were observed and analysis by our laboratory member and following guideline of each data analysis method. On the other hand, we used raw secondary data from other sources, such as government, laboratory member, and faculty member, for further evaluation and simulation.
2.2.1 Field Measurement and Analysis Method
2.2.1.1 River Measurement
Samples were collected at the Umeda River Station (Hatakeda Bridge) and four stations along the Atsumi Bay in the summer of 2010 (Figure 2.3). At the Umeda River Station, observations were conducted between July and October 2010 during rainfall and on fine days with a total of 99 samples collected. For each observation, water samples were taken from 8 to 24 times at hourly intervals. Durinh rainfall, samples were collected from when the flood started until the moment the flood subsided. All samples were collected at the surface layer using an auto sampler (6700, Teledyne ISCO, USA) and were then dispensed into 500-mL polypropylene bottles. The sample analysis was conducted at laboratory immediately after sampling.
River samples were used to quantify nutrient load from river to estuary using empirical estimation called L-Q equation model. This model is widely used to quantify river nutrient loads, where the results are used for river boundary inputs on multidimension hydrodynamic and water quality models. The L-Q equation model was constructed using regression model by following the relation between river discharge and nutrient loads (Tsushima et al., 2009).
The evaluation of model was evaluated following coefficient of determination (r2) between observation data and model results. The coefficient of determination values must be approaching ≈1 to convince that the results are close to field condition and the a, b coefficients are adequate to adopt. The mathematical formulation of the L-Q equation model can be seen in equation 2.1.
17
𝐿 = 𝑎𝑄𝑏 (2.1)
Where: L is the nutrient loads (g s-1), Q is river flow (m3 s-1), and a, b are model coefficients.
2.2.1.2 Estuary Measurement
Estuary measurement is conducted to observe salinity, dissolved and particulate nutrients, and Chl a condition of Atsumi Bay. The observations were conducted ten times, with intervals of eight to ten days, from July to October 2010 along Umeda River transect. At the estuary stations, 80 samples were collected at 1 m below the surface (surface layer) and 1 m above the bottom (bottom layer), and then dispensed into 500-mL polypropylene bottles with a peristaltic pump. To measure vertical salinity, we used conductivity-temperature- depth and a DO sensor (Rinko Profiler, JFE Advantech Co. Ltd, Kobe, Japan). This instrument measured vertical profiles at 0.1 m depth intervals.
2.2.2 Analysis Method of Water Quality
Nutrient analyses were conducted at the laboratory immediately after sampling. An aliquot of each sample was filtered through a GF/F glass-fiber filter (Whatman International Ltd., Maidstone, UK) for Chlorophyll a analysis. The filtrate samples were used for analysis of the dissolved nitrogen (DN) and dissolved phosphorus (DP), while unfiltered samples were used for analysis of total nitrogen (TN) and total phosphorus (TP). The amounts of particulate nitrogen (PN) and particulate phosphorus (PP) were calculated by subtracting total and dissolved nutrients. In order to minimize volatilization and biodegradation, the samples were stored in a dark freezer until analysis was done in the following days.
Nutrient analyses were conducted by adjusting the water characteristics of the sample locations under the measurement procedure of the American Public Health Association (2005). Analysis of the river samples was undertaken using Milli-Q water. In the case of the estuary samples, artificial seawater was created to adjust the density and ion concentration of the water by integrating 28.5 g of NaCl, 6.82 g of Mg.SO4.7H2O, 5.16 g of Mg.Cl2.6H2O, and 1.47 g of CaCl2.2H2O to 1 L of Milli-Q water. In the analysis of Chl a, methanol
18
extraction was used in accordance with the protocol of Otsuki et al. (1987), where the sample residue on the GF/F filters was extracted using 100% methanol.
2.2.3 Secondary Data
2.2.3.1 Meteorological Data
Meteorological data for study location areas were obtained at Toyohashi and Nagoya rain gage station by Automated Meteorological Data Acquisition System (AMeDAS) operated by Japan Meteorological Agency (JMA). The data are openly published through JMA’s website www.jma.go.jp that can be accessed by everyone and for unlimited purposes especially academic purpose. In our study, we used several meteorological data of 2010 from Toyohashi rain gage station that includes precipitation (Figure 2.4), wind speed and direction (Figure 2.5), air temperature, and sunshine duration (Figure 2.6). On the other hand, we used solar fluxed radiation and sunshine duration of the same year from the nearest station to Toyohashi city, which is Nagoya rain gage station, to simulate the condition of solar fluxed radiation at Toyohashi city areas. All meteorological data are used for simulation requirements of hydrodynamic and ecological model that detailly explained in Chapter III.
0 10 20 30 40 50 60 70 80 90
1-Jul 21-Jul 10-Aug 30-Aug 19-Sep 9-Oct 29-Oct
Precipitation (mm/day)
Date
Figure 2.4 Precipitation Data of Toyohashi City on 2010
19 0.0
0.1 0.2 0.3 0.4 0.5 0.6 0.7 0.8 0.9 1.0
1-Jul 11-Jul 21-Jul 31-Jul 10-Aug 20-Aug 30-Aug
Sunshine duration (hour)
Date
Figure 2.6 Sunshine Duration of Toyohashi City on Summer 2010
0%
2%
4%
6%
8%
10%
N
N-NE NE
E-NE
E
E-SE
SE S-SE S
S-SW SW
W-SW W W-NW
NW
N-NW
Wind Speed:
1-3 m/s 3-6 m/s 6-9 m/s 9-12 m/s
> 12 m/s
Figure 2.5 Wind Rose of Toyohashi City on 2010
20 2.2.3.2 Discharges and Water Level Data
Umeda River water level data was obtained from measurement of river water level by Yokota et al. (2013) and then converted into discharges (Figure 2.7). The discharges and water level data are used in this study to estimate river nutrient loads and as boundary conditions of hydrodynamic and ecological model. Estimation of discharges to nutrient loads in form of DN and DP is explained in more detail on Chapter 3. On the other hand, sea water level also used for the model’s boundary conditions. The sea level data was obtained from water level data at Maeshiba Station, which operated by Ministry of Land, Infrastructure and Transport, Japan (Figure 2.8). Mikawa Port Tidal Station is specifically lied Atsumi Bay around Umeda River transects. The station is the inside of our simulation boundary and properly use to predict tidal constituents for basic estimation of tidal water level of Atsumi Bay. The data is in form of water level which observed every one-hour for 30 days duration. The simulation of tidal constituents conducted using harmonic analysis as explained in Chapter 3.
0 20 40 60 80 100
1-Jul 11-Jul 21-Jul 31-Jul 10-Aug 20-Aug 30-Aug
Discharges (m3 /s)
Date
Figure 2.7 Umeda River Discharges on Summer 2010
21 REFERENCES
American Public Health Association/American Water Works Association/Water Environment Federation. 2005. Standard methods for examination of water and wastewater. Vol. 21st ed., New York.
Bodergat, A-M., M. Rio, and N. Ikeya. 1997. "Tide versus eutrophication. Impact on ostracods populations structure of Mikawa Bay (Japan)." Revue de Micropaléontologie 40 (1): 3-13. doi:10.1016/S0035-1598(97)90080-5.
Otsuki, A., M. M. Watanabe, and K. Sugahara. 1987. "Chlorophyll Pigments in Methanol Extracts from Ten Axenic Cultured Diatoms and Three Green Algae as Determined by Reverse Phase HPLC with Fluorometric Detection." Journal of Phycology 23 (3):
404-414.
Rasul, E. 2013. The influence of typhoon on nutrient dynamics and hypoxia in Atsumi bay, Japan. Toyohashi: Toyohashi University of Technology.
Rasul, E., Inoue, T., Aoki, S., Yokota, K., Matsumoto, Y., Okubo, Y., Djumanto. 2013. ", Influence of Tropical Cyclone on the Water Quality of Atsumi Bay." Journal of Water 0.0
0.5 1.0 1.5 2.0 2.5
1-Jul 6-Jul 11-Jul 16-Jul 21-Jul 26-Jul 31-Jul
Water Level (m)
Date
Figure 2.8 Observed Water Level at Mikawa Port Tidal Station
22 and Environment Technology 11: 439-451.
Tsushima, K., T. Koike, Y. Horinouchi, T. Inoue, and T. Yamada. 2009. "Evaluation of Nutrient Loads from a Citrus Orchard in Japan." Journal of Water and Environment Technology 7 (2): 267-276.
Yamada, T., and T. Inoue. 2005. "Influence of Phosphorus Runoff from Agricultural Areas on Enclosed Sea Downstream." Journal of Water and Environment Technology 3 (2):
157-156.
Yokota, K., Inoue, T., Yokokawa, M., Shimoyama, R. and Okubo, Y. 2013. "Evaluation of nutrient load from Umeda River flowing into the Mikawa Bay." Environmental Science 26: 140–149.
23
Chapter III
Numerical Model Development
3.1 Ecological Model
For decades, researcher have been observing coastal region in order to evaluate hydrodynamic and ecological condition of coastal region. Influence of many meteorological, topographical, and biochemical parameters have made coastal region to be the most complicated waterbodies in comparison to lake and river. Observations have been conducted in many coastal regions over the world. However, sometimes an observation could not evaluate the hydrodynamic and ecological condition of a coastal region continuously due to limitation of times, tools, and resources.
Moreover, since early 20th century many efforts have been made to create numerical models in order to solve those limitations. Various numerical models from one, two, or three dimensions have been developed and upgraded from time to time with purpose to create tools for detail evaluation of coastal hydrodynamic and ecological condition. In current study, an ecological model was developed with purpose not only to evaluate hydrodynamic condition of coastal waterbodies but also to evaluate phytoplankton growth and nutrient dynamic.
Current model was developed based on Navier-Stokes equation for hydrodynamic simulation which commonly used in several models such as Princeton Ocean Model (POM), Bergen Ocean Model (BOM), Delft-3D, Regional Ocean Modeling System (ROMS), and many other models (Mellor and Yamada, 1982; Berntsen et al., 2015; Xu et al., 2017; Sikirić et al., 2013). The model is divided into two segments: hydrodynamic and ecological models.
Hydrodynamic model is main physical model to evaluate current velocities, water elevation, temperature, and salinity. In this segment, physical influences such as tidal, wind speed, wind direction, river inputs, ocean inflow and outflow are comprehensively estimated as driven forces of coastal hydrodynamic. In ecological model, besides evaluating the physical
24
parameters, this segments more specifically used to evaluate the distribution and biochemical reaction of phytoplankton growth in the form of phytoplankton biomass (Chl a) and the dissolved nutrient dynamics including dissolved nitrogen (DN), dissolved phosphorus (DP).
In shallow waters, such as estuaries and shallow bays like Atsumi Bay, horizontal velocities are more dominant than vertical velocity. It is proved by our observation of salinity distribution along the Bay which dominantly change in surface layer in comparison to bottom layer (detailly explained in the Chapter 4). This condition indicated that the bay circulation mostly influenced by horizontal velocities. Therefore, adopting depth-averaged two-dimensional model to simulate large-scaled circulation in shallow waters is adequate (Ji, 2008).
3.2 Depth-Averaged Two-Dimensional Model
In two-dimensional model, depth-averaged two-dimensional model is commonly adopted for hydrodynamic and ecological models. Basic governing equation of the model is based on three-dimensional model. In assumption that vertical velocity is less dominant than horizontal velocities and constant water density, the z coordinates of basic three-dimensional model is neglected and counts as zero flux. Then, horizontal velocities are estimated over total water depth.
𝜕𝑢̅
𝜕𝑥+𝜕𝑣̅
𝜕𝑦 = 0 (3.1)
𝑢̅ = 1
ℎ+𝜁∫ 𝑢ℎ𝜁 𝑑𝑧 (3.2)
𝑣̅ = 1
ℎ+𝜁∫ 𝑣ℎ𝜁 𝑑𝑧 (3.3)
Where: u, v are current velocities in x, y direction (m s-1); ū, 𝑣̅ are depth-averaged velocities in x and y directions (m s-1); h is water depth (m); and ζ is water level (m).
25
3.2.1 Depth-Averaged Two-Dimensional Hydrodynamic Model
In hydrodynamic and ecological model, the basic calculation is based on advection and diffusion terms. The advection term is applied to calculate the momentum and mass conservations by influence of water velocities. In this calculation the averaged water velocities in x and y direction are the main parameters that need to be set and simulate.
Diffusion term is applied to calculate the dispersion of velocities or other substances by effect of density gradients and layer stress. In this term, the horizontal kinematic viscosity (Nh, m2 s-1) must be firstly evaluated using Smagorinsky equations as follow:
𝑁ℎ = 𝑐 ∆𝑥 ∆𝑦 1
2|(𝜕𝑢̅
𝜕𝑥)2 + (𝜕𝑣̅
𝜕𝑥+𝜕𝑢̅
𝜕𝑦)2+ (𝜕𝑣̅
𝜕𝑦)2| (3.4)
where: c is non-dimensional horcon parameter in range of 0.1 - 0.2 (curent model set up uses 0.12); and Δx and Δy is grid size in x and y directions (m).
In current depth-averaged velocities of x and y direction, other additional terms are applied including Coriolis force, water depth gradient, and shear stress. Coriolis force (f) is a calculation water circulation motions as effect of earth rotation with respect to an inertial frame. The force influences an aquatic area to rotate following clockwise or counter clockwise which depends on latitude position of study area. The basic equation of f is as follow:
𝑓 = 2Ω sin θ (3.5)
where: f is Coriolis force (s-1), Ω is angular rotation of earth with value 7.2921 x 10⁻⁵ (rad s-
1), and θ is latitude of location (°).
Water depth gradient is calculation of hydrostatic force in water bodies or sometimes called water pressure. The pressure comes from influence of dynamic condition of total water depth due to tidal and water elevation change. Shear stress are type of frictional stress that occurs in surface and bottom layer. The explanation of shear stress is given in sub-chapter 3.5.