Fukushima Medical University
This document is downloaded at: 2021-11-08T00:33:36Z
Title
The basic data for residents aged 15 years or younger who received a comprehensive health check in 2011-2012 as a part of The Fukushima health management survey after the great east japan earthquake
Author(s)
Kawasaki, Yukihiko; Hosoya, Mitsuaki; Yasumura, Seiji;
Ohira, Tetsuya; Satoh, Hiroaki; Suzuki, Hitoshi; Sakai, Akira;
Ohtsuru, Akira; Takahashi, Atsushi; Ozasa, Kotaro; Kobashi, Gen; Kamiya, Kenji; Yamashita, Shunichi; Abe, Masafumi Citation Fukushima Journal of Medical Science. 61(2): 101-110
Issue Date 2015
URL http://ir.fmu.ac.jp/dspace/handle/123456789/488
Rights © 2015 The Fukushima Society of Medical Science
DOI 10.5387/fms.2015-13
Text Version publisher
101 BASIC DATA FROM THE PEDIATRIC COMPREHENSIVE HEALTH CHECK
Fukushima J. Med. Sci., Vol. 61, No. 2, 2015
[Original Article]
THE BASIC DATA FOR RESIDENTS AGED 15 YEARS OR YOUNGER WHO RECEIVED A COMPREHENSIVE HEALTH CHECK IN 2011
-2012
AS A PART OF THE FUKUSHIMA HEALTH MANAGEMENT SURVEY AFTER THE GREAT EAST JAPAN EARTHQUAKE
YUKIHIKO KAWASAKI
1)3), MITSUAKI HOSOYA
1)3), SEIJI YASUMURA
1)4), TETSUYA OHIRA
1)2), HIROAKI SATOH
1)5), HITOSHI SUZUKI
1)6), AKIRA SAKAI
1)7), AKIRA OHTSURU
1)8), ATSUSHI TAKAHASHI
1)9), KOTARO OZASA
10), GEN KOBASHI
11), KENJI KAMIYA
1)12),
SHUNICHI YAMASHITA
1)13), MASAFUMI ABE
1),
and THE FUKUSHIMA HEALTH MANAGEMENT SURVEY GROUP
1)
Radiation Medical Science Center for the Fukushima Health Management Survey, Fukushima Medical University, Fukushima, Japan,
2)Department of Epidemiology, Fukushima Medical University, Fukushi- ma, Japan,
3)Department of Pediatrics, Fukushima Medical University, Fukushima, Japan,
4)Department of Public Health, Fukushima Medical University, Fukushima, Japan,
5)Department of Nephrology, Hyper tension, Diabetology, and Endocrinology, Fukushima Medical University, Fukushima, Japan,
6)
Department of Cardiology and Hematology, Fukushima Medical University, Fukushima, Japan,
7)
Department of Radiation Life Sciences, Fukushima Medical University, Fukushima, Japan,
8)Depart- ment of Radiation Health Management, Fukushima Medical University, Fukushima, Japan,
9)Depart- ment of Gastroenterology and Rheumatology, Fukushima Medical University, Fukushima, Japan,
10)
Department of Epidemiology, The Radiation Effects Research Foundation, Hiroshima, Japan,
11)
Department of Planning and Management, National Institute of Radiological Sciences, Chiba, Japan,
12)
Research Institute for Radiation Biology and Medicine, Hiroshima University, Hiroshima, Japan,
13)
University of Nagasaki, Nagasaki, Japan
(Received April 22, 2015, accepted June 23, 2015)
Abstract : Aim : To assist in the long
-term health management of residents and evaluate the health impacts after the Tokyo Electric Power Company’s Fukushima Daiichi Nuclear Power Plant accident in Fukushima Prefecture, the Fukushima prefectural government decided to implement the Fukushima Health Management Survey. This report describes the results for residents aged 15 years or younger who received health checks and evaluates the data obtained from 2011 and 2012.
Methods : The target group consisted of residents aged 15 years or younger who had lived in the evacuation zone. The health checks were performed on receipt of an application from any of the residents. The checks, which included the measurements of height, weight, blood pressure, bio- chemical laboratory findings, and peripheral blood findings, were performed as required.
Results : 1) A total of 17,934 (64.5%) and 11,780 (43.5%) residents aged 15 years or younger re- ceived health checks in 2011 and 2012, respectively. 2) In both years, a number of male and female residents in the 7
-15 year age group were found to suffer from obesity, hyperlipidemia, hyperurice- mia, or liver dysfunction. Furthermore, pediatric aged 15 years or younger were commonly ob- served to suffer from hypertension or glucose metabolic abnormalities. 3) A comparison of data from 2012 and 2011 demonstrated that both males and females frequently showed increased body
Corresponding author : Yukihiko Kawasaki E
-mail : [email protected]
https://www.jstage.jst.go.jp/browse/fms http://www.fmu.ac.jp/home/lib/F
-igaku/
INTRODUCTION
On March 11, 2011, a massive undersea earth- quake and subsequent tsunami struck East Japan.
With a Richter
-scale magnitude of 9.0, the Great East Japan Earthquake was one of the most powerful earthquakes on record and the largest to hit Ja- pan
1-4). The associated tsunami hit the northern part of the main island of Honshu, covering more than 800km of the Pacific coastline and claiming nearly 20,000 lives. In Fukushima Prefecture, 1,609 people were confirmed killed and 207 remain missing
5,6).
The Fukushima Daiichi Nuclear Power Plant, which is owned and operated by the Tokyo Electric Power Company was severely damaged by the earthquake and tsunami. The tsunami destroyed the direct current power supply, resulting in a com- plete loss of power to the Nuclear Power Plant cool- ing system. Consequently, the overheated Nuclear Power Plant reactor cores underwent a meltdown and hydrogen gas explosions dispersed large amounts of radionuclide materials into the surround- ing areas
7). Due to the accident at the Fukushima Daiichi Nuclear Power Plant, residents of all ages living in the evacuation zone
-, a government
-desig- nated area around the nuclear power plant in Fuku- shima prefecture, were evacuated. As a result, many child evacuees from the government
-desig- nated evacuation zone were forced to make changes to their lifestyle, such as school life, diets, free play outside with friends, exercise patterns, and sleep patterns. Further, some parents experienced anxi- ety regarding their health status, particularly with regard to radiation exposure.
The Fukushima prefectural government decid- ed to conduct what it called the Fukushima Health Management Survey (FHMS) to assist in the long
-term health management of residents, to evaluate the health impacts of the accident, to promote the
future well
-being of residents, and to determine whether long
-term low
-dose radiation exposure has any effect of their health
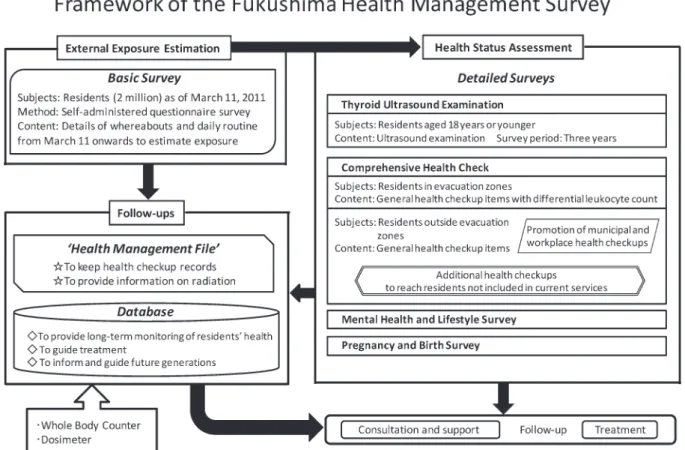
4,8). The framework of the FHMS was showed in Fig. 1. Comprehensive health checks (CHCs) are part of the detailed FHMSs and we sought to review the data regarding their health, assess the incidence of various diseas- es, and improve the health status of evacuees.
To assist in the long
-term health management of residents aged 15 years or under and evaluate the health impacts after the Tokyo Electric Power Com- pany’s Fukushima Daiichi Nuclear Power Plant acci- dent, we performed health checks for child evacuees from the government
-designated evacuation zone and analyzed the basic data.
METHODS
The study was carried out under the auspices of the Committee for Human Experiments at the Fukushima Medical University School (the Institu- tional Review Board approval number 1319). In- formed consent was obtained from all residents aged 15 years or under, who have received health checks or their parents. The target group and methods employed in the CHC were reported previously by Yasumura et al.
8).
Target group
The target group consisted of residents aged 15 years or under who had lived in Hirono
-machi, Naraha
-machi, Tomioka
-machi, Kawamata
-machi Kawauchi
-mura, Okuma
-machi, Futaba
-machi, Na- mie
-machi, Kazurao
-mura, Iitate
-mura, Minami
-so- ma City, Tamura City and the part of Date city spe- cifically recommended for evacuation.
The residents aged 15 years or under have re- ceived health checks at 102 pediatric medical insti- tutions in the prefecture since January 2011 (153 pe- diatricians agreed to be registered to conduct these height and decreased body weight in 2012. The prevalence of hypertension, glucose metabolic ab-
normalities, or high γ
-GTP values in males and females in the 7
-15 year age group in 2012 was low- er than that in 2011. However, the prevalence of hyperuricemia among residents in the 7
-15 year age group was higher in 2012 than in 2011.
Conclusions : These results suggested that some residents aged 15 years or under who had lived in the evacuation zone had developed obesity, hyperlipidemia, hyperuricemia, liver dysfunction, hy- pertension, or glucose metabolic abnormalities. Therefore, we think that it is necessary to contin- ue the health checks for these residents in order to ameliorate these lifestyle
-related diseases.
Key words : health check, Fukushima Health Management Survey, The Great East Japan Earth-
quake, child, adult
103 BASIC DATA FROM THE PEDIATRIC COMPREHENSIVE HEALTH CHECK
comprehensive health checks).
The CHCs have also been performed outside the prefecture, with a total of 554 pediatric medical institutions helping to conduct health checks for children aged 15 years or younger.
Evaluation items
In addition to assessing the effects of radiation, additional variables were specified according to age in order to assess health, prevent lifestyle
-related diseases, and identify or treat diseases at an early stage. The survey items for children aged 7 to 15 years consisted of height, weight, blood pressure, red blood cell (RBC) count, hematocrit (Hct), hemo- globin (Hb), platelet count, and white blood cell (WBC) count. Upon request, aspirate aminotrans- ferase (AST), alanine aminotransferase (ALT), γ
-glutamyl transpeptidase (γ
-GTP), triglyceride (TG), high
-density lipoprotein
-cholesterol (HDL
-C), low
-density lipoprotein
-cholesterol (LDL
-C), hemo- globin A1c (HbA1c), fasting plasma glucose concen- tration, serum creatinine (Cr), and uric acid (UA) could be added. For children aged 0 to 6 years, height, weight, RBC count, Hct, Hb, platelet count, and WBC count were examined.
Definitions
Hypertension, anemia, liver dysfunction, hyper- uricemia and hyperlipidemia were defined as previ- ously reported
9).
Statistics
Data are expressed as the mean values.
RESULTS
1) Baseline characteristics for residents aged 15 years or under who had lived in the evacuation zone (Table 1)
In 2011, 17,934 (64.5%) of the residents aged 15 years or younger received health checks, where- as 11,780 (43.5%) of those aged 15 years or younger received health checks in 2012. The numbers of residents aged 15 years or under who had lived in Hirono
-machi, Naraha
-machi, Tomioka
-machi, Kawamata
-machi Kawauchi
-mura, Okuma
-machi, Futaba
-machi, Namie
-machi, Kazurao
-mura, Iitate
-mura, Minami
-soma City, Tamura City and the part of Date city are shown in Table 1.
Fig. 1. Items included in the comprehensive health check.
2) Body height, weight and blood pressure in resi- dents aged 15 years or under who had lived in the evacuation zone (Table 2, 3, 4, 5,and 6)
1 Body height
Body height is shown in Table 2, 3, 4, and 5.
Increases in body height were observed in males in the 1 year (Y) 2 month (M)
-1Y6M , 1Y8M
-1Y10M, and 2Y
-14Y age groups in 2012 in comparison to the data for 2011, with gains in body height also ob- served in females in the 10M
-1Y, 1Y2M
-1Y6M, 2Y
-2Y6M, 3Y
-4Y6M, 5Y6M
-9Y, 11Y, 13Y, and 15Y age groups in 2012 compared to 2011.
2 Body weight
Decreased body weight was observed in males in the 10M
-1Y6M, 1Y8M
-2Y, 2Y6M
-6Y, 8Y
-10Y, 12Y, and 15Y age groups in 2012 in comparison to
the data for 2011, with decreases in body weight also observed in females in the 10M
-3Y, 3Y6M
-5Y6M, 6
-8Y, 10Y, and 12Y
-15Y age groups in 2012 com- pared to 2011.
3 blood pressure
With regard to blood pressure, the prevalence of high systolic BP or high diastolic BP in the male residents in 2011 was 0.9% and 0.8%, respectively, in the 7
-15Y age group, while in the female resi- dents it was 0.2% and 0.4%, respectively, in the 7
-15 Y age group. In 2012, the prevalence of high sys- tolic BP or high diastolic BP in the male residents was 0.4% and 0.4%, respectively, in the 7
-15 Y age group, while in the female residents it was 0.1% and 0.3%, respectively, in the 7
-15 Y age group (Table 6).
In addition, the prevalence of hypertension in both the male and female residents in the 7
-15 Y age Table 1. The number of residents aged 15 years or under who had lived in the evacuation zone in childhood.
Date
City Tamura
City Minamisoma
City Kawamata
Machi Hirono
Machi Naraha
Machi Tomioka Machi
0
-6 years 98 1,720 3,664 580 257 347 760
7
-15 years 200 3,503 6,078 1,190 515 688 1,431
Kawauchi
Mura Okuma
Machi Futaba
Machi Namie
Machi Katsurao
Machi Iitate Machi
0
-6 years 88 777 362 1,016 53 280
7
-15 years 175 1,126 559 1,709 105 538
Table 2. The mean body height of residents aged
-less than 6 years old who had lived in the evacuation zone in 2011 and 2012.
Age years (Y), month (M)
male female
2011 2012
(b)
-(a)
2011 2012
(b)
-(a)
n means
(cm) (a) n means
(cm) (b) n means
(cm) (a) n means
(cm) (b)
10M
-1Y 44 73.6 46 73.3 △0.3 36 71.5 49 72.0 0.5
1Y
-1Y2M 77 74.8 52 74.1 △0.7 79 73.7 60 73.4 △0.3
1Y2M
-1Y4M 68 76.5 64 77.2 0.7 85 75.1 41 75.2 0.1
1Y4M
-1Y6M 93 78.7 54 79.1 0.4 80 77.4 54 77.8 0.4
1Y6M
-1Y8M 80 81.2 59 80.2 △1.0 78 78.9 53 78.9 0.0
1Y8M
-1Y10M 73 82.1 56 82.5 0.4 86 81.2 49 81.1 △0.1
1Y10M
-2Y 83 83.8 52 83.7 △ 0.1 98 82.0 52 81.8 △ 0.2
2Y
-2Y6M 281 86.6 181 87.4 0.8 263 85.4 178 85.6 0.2
2Y6M
-3Y 269 90.7 196 91.4 0.7 288 89.9 199 89.7 △0.2
3Y
-3Y6M 281 94.8 193 94.9 0.1 255 93.5 208 94.0 0.5
3Y6M
-4Y 257 98.6 170 99.0 0.4 246 97.3 181 97.4 0.1
4Y
-4Y6M 258 101.7 203 102.3 0.6 275 100.6 175 100.8 0.2
4Y6M
-5Y 280 105.7 193 105.7 0.0 253 104.2 192 103.9 △0.3
5Y
-5Y6M 286 108.5 182 108.9 0.4 286 107.6 197 107.5 △0.1
5Y6M
-6Y 293 111.4 199 111.9 0.5 296 110.3 191 111.1 0.8
105 BASIC DATA FROM THE PEDIATRIC COMPREHENSIVE HEALTH CHECK
Table 3. The mean body weight of residents aged
-less than 6 years old who had lived in the evacuation zone in 2011 and 2012.
Age years (Y), month (M)
male female
2011 2012
(b)
-(a)
2011 2012
(b)
-(a)
n means
(kg) (a) n means
(kg) (b) n means
(kg) (a) n means (kg) (b)
10M
-1Y 44 9.8 46 9.4 △0.4 36 8.9 49 8.7 △0.2
1Y
-1Y2M 77 9.9 52 9.5 △0.4 79 9.4 60 9.1 △0.3
1Y2M
-1Y4M 68 10.4 64 10.2 △0.2 85 9.7 41 9.4 △0.3
1Y4M
-1Y6M 93 10.9 54 10.5 △0.4 80 10.3 54 10.1 △0.2
1Y6M
-1Y8M 80 11.2 59 11.2 0.0 79 10.5 53 10.4 △0.1
1Y8M
-1Y10M 73 11.6 56 11.4 △ 0.2 86 11.0 49 10.5 △ 0.5
1Y10M
-2Y 83 12.0 52 11.6 △0.4 98 11.2 52 10.8 △0.2
2Y
-2Y6M 281 12.7 181 12.8 0.1 263 12.1 178 11.9 △0.2
2Y6M
-3Y 269 13.8 196 13.5 △0.3 288 13.2 199 12.9 △0.3
3Y
-3Y6M 281 14.8 193 14.6 △0.2 255 14.1 208 14.1 0.0
3Y6M
-4Y 257 15.9 170 15.7 △0.2 246 15.2 181 15.0 △0.2
4Y
-4Y6M 258 16.8 203 16.6 △0.2 275 16.4 175 16.0 △0.4
4Y6M
-5Y 280 17.9 193 17.8 △0.1 253 17.2 193 17.0 △0.2
5Y
-5Y6M 286 18.7 182 18.5 △0.2 286 18.4 197 18.2 △0.2
5Y6M
-6Y 293 20.0 199 19.9 △0.1 296 19.3 191 19.6 0.3
Table 4. The mean body height of residents aged
-7
-15 years old who had lived in the evacuation zone in 2011 and 2012.
(years) Age
male female
2011 2012
(b)
-(a)
2011 2012
(b)
-(a)
n means
(cm) (a) n means
(cm) (b) n means
(cm) (a) n means
(cm) (b)
6 584 116.6 383 116.6 0.0 533 115.6 391 115.6 0.0
7 630 122.8 459 123.0 0.2 611 121.5 401 121.6 0.1
8 692 128.1 424 128.5 0.4 623 127.5 381 127.9 0.4
9 633 133.4 460 133.9 0.5 652 133.6 424 133.9 0.3
10 682 139.3 433 139.4 0.1 675 140.4 438 140.0 △0.4
11 721 145.5 488 145.8 0.3 641 146.9 440 147.4 0.5
12 662 153.2 438 153.3 0.1 641 152.2 389 152.1 △ 0.1
13 568 160.1 386 160.6 0.5 645 154.6 400 154.9 0.3
14 621 165.3 327 165.7 0.4 610 156.4 357 156.4 0.0
15 512 168.4 223 168.2 △0.2 563 157.0 225 157.3 0.3
Table 5. The mean body weight of residents aged
-7
-15 years old who had lived in the evacuation zone in 2011 and 2012.
(years) Age
male female
2011 2012
(b)
-(a)
2011 2012
(b)
-(a)
n means
(kg) (a) n means
(kg) (b) n means
(kg) (a) n means
(kg) (b)
6 584 22.1 383 21.5 △0.6 533 21.7 391 21.1 △0.6
7 632 24.8 459 24.8 0.0 611 24.1 401 24.0 △0.1
8 692 28.4 424 28.0 △0.4 623 27.4 381 27.2 △0.2
9 633 32.6 460 32.2 △0.4 652 31.0 424 31.3 0.3
10 682 36.0 433 35.9 △ 0.1 675 35.7 438 34.8 △ 0.9
11 721 40.5 488 40.7 0.2 641 40.5 440 40.7 0.2
12 662 46.9 438 45.4 △1.5 641 45.8 389 44.0 △1.8
13 568 51.2 386 51.5 0.3 645 48.5 400 47.4 △1.1
14 621 56.1 327 56.1 0.0 610 51.8 357 50.7 △1.1
15 512 60.0 223 58.7 △1.3 563 53.5 225 51.7 △1.8
group in 2012 was lower than that in male and fe- male residents in 2011.
3) Peripheral blood data for residents aged 15 years or under who had lived in the evacuation zone (Table 7 and 8)
In 2011, the prevalence of anemia in the male residents was 24.5% in the 0
-6 Y and 3.8% in the 7
-15 Y age group, while that in the female residents was 3.1% in the 0
-6 Y, and 1.6% in the 7
-15 Y age group. Similarly, the prevalence of anemia in the male residents in 2012 was 25.3% in the 0
-6 Y and 3.2% in the 7
-15 year age group, while that in fe- male residents was 3.2% in the 0
-6 Y and 1.0% in the 7
-15 year age group. There were no differenc- es in the prevalence of anemia, peripheral WBC counts, including neutrophils and lymphocytes, or platelet counts among age groups or between males
and females in both 2011 and 2012.
4) Biochemical laboratory findings for residents aged 15 years or under who had lived in the evacuation zone (Table 9, 10, and 11)
With regard to lipid function, the prevalence of high LDL
-C or high TG values in the male residents in 2011 was 3.3% and 7.7%, respectively, in the 7
-15 Y age group, and 3.6% and 6.3%, respectively, in the 7
-15 Y age group in females. In 2012, the preva- lence of high LDL
-C or high TG values was 3.2%
and 7.7%, respectively, in the 7
-15 Y age group in males, and 3.6% and 6.5%, respectively, in the 7
-15 Y age group in females. There were no significant differences in the prevalence of high LDL
-C and high TG values in the 7
-15 year age group in both males and females between 2012 and 2011 (Table 9).
In terms of liver function, the prevalence of Table 6. lood pressure in residents aged
-7
-15 years old who had lived in the evacuation zone in 2011 and 2012.
Systolic BP (mmHg) Diastolic BP (mmHg)
n means ≥140 n means ≥90
2011 male 5,728 108.6 0.9% 5,727 62.6 0.8%
female 5,686 106.3 0.2% 5,684 62.2 0.4%
2012 male 3,778 106.2 0.4% 3,778 61.2 0.4%
female 3,601 104.1 0.1% 3,601 60.6 0.3%
Table 7. RBC counts, Hg, Hct, and platelet counts in residents aged
-0
-15 years old who had lived in the evacuation zone.
Age (years)
Sex RBC counts (106/μl) Hb (g/dL) Hct (%) Platlet counts (103/μl)
male n means≤3.69 ≤3.99 ≥5.80
n means≤12.0 ≤13.0 ≥18.0
n means≤35.9 ≤37.9 ≥55.0
n means ≤89 ≤129 ≥370 ≥450 female ≤3.39 ≤3.69 ≥5.50 ≤11.0 ≤12.0 ≥16.0 ≤28.9 ≤32.9 ≥48.0
2011 0-6 male 3,253 4.72 0.0% 0.6% 0.2% 3,253 12.5 24.5% 74.2% 0.0% 3,253 37.2 28.4% 64.4% 0.0% 3,251 321.2 0.3% 0.5% 22.3% 6.4%
female 3,175 4.68 0.1% 0.1% 0.9% 3,175 12.6 3.1% 23.8% 0.0% 3,175 37.4 0.2% 2.1% 0.0% 3,172 322.5 0.2% 0.4% 22.7% 5.7%
2012 0-6 male 2,166 4.72 0.0% 0.9% 0.4% 2,166 12.6 25.3% 71.4% 0.0% 2,166 37.6 24.1% 56.6% 0.0% 2,164 321.1 0.1% 0.3% 22.8% 6.0%
female 2,176 4.67 0.0% 0.0% 0.9% 2,176 12.6 3.2% 23.1% 0.0% 2,176 37.9 0.1% 1.4% 0.0% 2,172 325.4 0.3% 0.6% 24.0% 6.7%
2011 7-15 male 5,765 7.91 0.0% 0.3% 1.1% 5,765 13.8 3.8% 24.9% 0.0% 5,765 40.9 5.2% 19.0% 0.0% 5,763 277.4 0.0% 0.1% 7.2% 1.0%
female 5,709 4.69 0.0% 0.1% 0.8% 5,710 13.3 1.6% 7.6% 0.1% 5,710 39.8 0.2% 0.9% 0.1% 5,708 273.5 0.1% 0.3% 5.6% 0.8%
2012 7-15 male 3,809 4.90 0.0% 0.3% 0.7% 3,809 13.8 3.2% 21.9% 0.0% 3,809 41.3 2.8% 12.9% 0.0% 3,807 276.3 0.0% 0.3% 6.1% 0.6%
female 3,626 4.70 0.0% 0.1% 0.6% 3,626 13.4 1.0% 6.2% 0.2% 3,626 40.4 0.0% 0.4% 0.2% 3,624 273.6 0.0% 0.1% 5.7% 0.5%
Table 8. WBC counts, including neutrophil counts, lymphocyte counts, basophil counts, monocyte counts, and eosinophil counts, in residents aged
-0
-15 years old who had lived in the evacuation zone in childhood.
(years)Age Sex WBC counts (103/μl) Neutrophils counts
(/μl) Lymphocyte counts
(/μl) Basophils
counts (/μl) Monocyte
counts (/μl) Eosinophils counts (/μl) n means ≤2.9 ≤3.9 ≥9.6 ≥11.1 n means ≤500 n means ≤500 n means n means n means 2011 0-6 male 3,253 8.5 0.1% 0.7% 28.3% 12.9% 3,247 3,683 0.0% 3,247 4,055 0.0% 3,247 38 3,247 454 3,247 250
female 3,176 8.5 0.1% 0.4% 27.9% 13.0% 3,171 3,649 0.1% 3,171 4,214 0.0% 3,171 35 3,171 426 3,171 195 2012 0-6 male 2,166 8.6 0.0% 0.3% 29.3% 13.2% 2,158 3,555 0.1% 2,158 4,202 0.0% 2,158 40 2,158 460 2,158 316 female 2,176 8.6 0.1% 0.5% 29.0% 13.5% 2,162 3,521 0.0% 2,162 4,321 0.0% 2,162 37 2,162 431 2,162 261 2011 7-15 male 5,765 6.5 0.2% 3.4% 6.0% 2.1% 5,762 3,321 0.0% 5,762 2,533 0.1% 5,762 433 5,762 366 5,762 244 female 5,710 6.5 0.2% 4.0% 5.7% 1.8% 5,708 3,425 0.0% 5,708 2,514 0.1% 5,708 29 5,708 343 5,708 185 2012 7-15 male 3,809 6.5 0.2% 2.7% 6.5% 2.2% 3,806 0.0% 0.0% 3,806 2,582 0.0% 3,806 36 3,806 362 3,806 304 female 3,626 6.5 0.2% 2.5% 5.4% 1.8% 3,623 3,341 0.0% 3,623 2,569 0.0% 3,623 30 3,623 337 3,623 226