福島県立医科大学 学術機関リポジトリ
This document is downloaded at: 2021-11-08T00:08:36Z
Title Myocardial Infarction Induces Sympathetic Nervous Remodeling in Intermediolateral Nucleus( 本文 )
Author(s) 野寺, 穣
Citation
Issue Date 2018-03-21
URL http://ir.fmu.ac.jp/dspace/handle/123456789/742
Rights This is the pre-peer reviewed version. Published version
"Neurosci Lett. 2018 Oct 15;685:114-123. doi:
10.1016/j.neulet.2018.08.004. © 2018 Elsevier B.V."
DOI
Text Version ETD
Myocardial Infarction induces Sympathetic Nervous Remodeling in Intermediolateral Nucleus
Minoru Nodera, MD
Department of Cardiovascular Medicine, Fukushima Medical University
論 文 内 容 要 旨
学位論文題名 心筋梗塞後の脊髄中間外側核における交感神経リモデリング現象についての検討
(背景)心筋梗塞後の交感神経活性亢進には星状神経節(SG)の”neural remodeling”と いう形態学的変化を伴う神経活動亢進が関与していると考えられている。この現象が交感神 経系において SG のみならず他の部位でも認められるのかは明らかにはされていない。
(方法)生後 10〜13 週齢の雄ラットの左冠動脈前下行枝を結紮し、心筋梗塞モデルを作成 した。その1週間後、あるいは2週間後に脊髄中間外側核(IML: intermediolateral nucleus) が局在する Th2 レベルの胸髄と SG を摘出した。SG 及び IML の neural remodeling について は免疫組織染色で評価を行なった。また、リアルタイム PCR 法や蛍光免疫染色により brain-derived neurotrophic factor (BDNF)、tropomyosin-related kinase receptor B (TrkB) の mRNA 及びタンパク発現の検討を行なった。
(結果)心筋梗塞2週間後の SG は Sham 群と比較して神経細胞体の大きさの有意な増加が認 められた。同様に IML においても心筋梗塞群で神経細胞体の大きさ及び軸索密度の有意な増 加が認められた。次に心筋梗塞1週間後の胸髄における神経成長因子の一つ BDNF およびその 受容体 TrkB の mRNA の発現は、sham 群に比して有意に増加していた。免疫蛍光染色による検 討によっても、IML における BDNF および TrkB のタンパク発現が心筋梗塞群において有意に 増加していることが示された。最後に IML における BDNF-TrkB の発現の増加に伴い、細胞内 の 成 長 シ グ ナ ル が 亢 進 し て い る か 否 か を 確 認 す る た め に 、 ERK ( Extracellular signal-regulated kinase)の活性を免疫蛍光染色により検討した。リン酸化 ERK、すなわち 活性化 ERK 陽性細胞の割合は心筋梗塞群において有意に高値であった。
(考察)心筋梗塞後の IML の neural remodeling を神経細胞体の腫大と軸索増生により初め て明らかにした。SG のみならず IML も neural remodeling をきたすことから、心筋梗塞後に は交感神経系全体において neural remodeling が生じることにより活性の亢進が持続する可 能性がある。IML において BDNF 及び TrkB の発現増加及び ERK 活性の亢進が認められたこと から、IML の neural remodeling は BDNF/TrkB 経路を介する現象と推察される。胸髄におけ る BDNF の mRNA の発現増加については、その局在は明らかではないが、BDNF の mRNA は IML の位置する脊髄中間層にのみ局在することを考慮すると、IML で増加していた BDNF の由来は IML の細胞体による autocrine、あるいはグリア細胞からの paracrine の可能性が考えられる。
(結論)心筋梗塞後においては SG のみならず IML も neural remodeling をきたす。IML の neural remodeling には BDNF/TrkB 経路の活性化が関与していることが示唆される。
Abstract
Background: Several studies have shown that neural remodeling in stellate ganglia (SG) is induced
by myocardial infarction (MI). It remains unclear whether neural remodeling after MI is limited in
SG within the sympathetic nervous system.
Methods: MI was induced in a rat model by ligation of the left anterior descending artery. Neural
remodeling in the intermediolateral nucleus (IML) and SG was assessed by immunohistochemistry 2
weeks after MI. The mRNA and protein expressions of brain-derived neurotrophic factor (BDNF),
tropomyosin-related kinase receptor (TrkB) and extracellular signal-regulated kinase (ERK) were
measured by quantitative RT-PCR, immunohistochemistry and Western blotting 1 week after MI.
Results: The neuronal size and axonal density of IML were increased after MI compared to sham
(193.5±16.0 vs. 169.1±8.5 µm
2, P<0.01; 60587±21767 vs. 31380±17026 µm
2/mm
2, P<0.05,
respectively). The density of growth-associated protein-43, a protein upregulated in axons
undergoing nerve sprouting, was increased after MI compared to sham. The fluorescence intensity of
BDNF and TrkB in IML were significantly higher in the MI group than in the sham group
(54750±20047 vs. 28668±12717 µm
2/mm
2, P<0.05). In addition, mRNA expression of BDNF and
TrkB in the spinal cord at the Th2 level was increased after MI (1.8±0.9-fold change vs. sham,
P<0.01; 1.3±0.2-fold change vs. sham, P<0.05, respectively). Finally, the percentage of
phospho-ERK-immunoreactive neurons in IML was significantly higher in the MI group than in the
sham group.
Conclusions: Neuronal remodeling in IML as well as in SG is induced after MI probably via
activation of the BDNF-TrkB axis. Morphological remodeling throughout the sympathetic nervous
system may be involved in sustained activation of sympathetic tone after MI.
Keywords: neural remodeling, myocardial infarction, sympathetic nervous system, stellate ganglion,
intermediolateral nucleus, brain-derived neurotrophic factor, tropomyosin-related kinase receptor B
Abbreviation
BDNF brain-derived neurotrophic factor ChAT choline acetyltransferase
GAP43 growth-associated protein-43 IML intermediolateral nucleus
MI myocardial infarction
NGF nerve growth factor
pERK phospho-extracellular signal-regulated kinase
SG stellate ganglion
SNS sympathetic nervous system
TH tyrosine hydroxylase
Trk tropomyosin-related kinase receptor
Introduction
Recent studies have shown that myocardial infarction (MI) induces neural remodeling in stellate
ganglion (SG) (2, 15, 20, 21, 26, 39), where most postganglionic sympathetic neurons that project to
the heart exist (24, 25). Neural remodeling is accompanied by morphological remodeling in the form
of cellular hypertrophy and nerve sprouting. Neural remodeling occurs as a result of a regenerative
process of disrupted sympathetic innervation in the infarct area to recover control of cardiac
performance, but heterogeneous reinnervation triggers abnormal sympathetic excitement that is
associated with the development of fatal ventricular tachyarrhythmia and sudden cardiac death (3, 9,
10, 29, 40). It is possible that neural remodeling of the whole SNS may cause further sympathetic
excitement, and if so, elucidation of pathophysiological mechanisms of neural remodeling
throughout the SNS may lead to a novel therapeutic approach for suppressing abnormal sympathetic
excitement after MI. The intermediolateral nucleus (IML), where preganglionic sympathetic neurons
exist, is located upstream of SG in the SNS. IML exists between dorsal and ventral horns at a lateral
position in gray matter of the thoracic spinal cord. The sympathetic nerve in IML expresses
tropomyosin-related kinase receptor B (TrkB), which is a receptor of brain-derived neurotrophic
factor (BDNF) (5, 18, 30). In the present study, we examined whether MI induced neuronal
remodeling of IML, and if so, investigated the underlying mechanism, with special focus on the
BDNF-TrkB axis.
Methods
Ethical statements
We conformed to the Guide for the Care and Use of Laboratory Animals, published by the US
National Institutes of Health (NIH publication, 8th Edition, 2011). Our research protocol was
approved by the Fukushima Medical University Animal Research Committee. All animal
experiments were performed in accordance with the guidelines of the Fukushima Medical University
Animal Research Committee.
Rat MI model
Adult Sprague Dawley rats (10–13 weeks of age) were used in the experiments. The rats were
anaesthetized by intra-peritoneal injection with medetomidine (0.1 mg/kg), midazoram (2.0 mg/kg)
and butorphanol (2.5 mg/kg). Intubation was performed with a 20-gauge polyethylene catheter, and
ventilated using a rodent ventilator (Shinano Manufacturing, Tokyo, Japan). MI was induced by
ligation of the left anterior descending coronary artery (LAD) with 6-0 prolene sutures. Induction of
MI was confirmed by the change of the anterior wall color to pale. Sham rats underwent the same
operation but without a ligation of the coronary artery.
Protocol of immunohistochemistry
Both MI and sham rats were euthanized randomly 1 or 2 weeks after surgery (1 week MI group:
N=15, 2 weeks MI group: N=30, sham group: N=51). Bilateral SGs and the spinal cord collected
from 4% paraformaldehyde perfused rats were cryoprotected and frozen in Tissue-Tek O.C.T for
immunohistochemistry. Every 100 µm longitudinal sections (10 µm thickness) of the SGs and every
300
µm coronal sections (20 µm thickness) of the spinal cord were mounted on glass microscopeslides. The mounted frozen sections were incubated with a solution of 0.5% Triton-X, 5% bovine
serum albumin (Sigma-Aldrich, St. Louis, Missouri, U.S.A.) at room temperature for 30 minutes,
and then incubated overnight at 4℃ in the primary antibody. SGs collected at 2 weeks after surgery
were incubated in rabbit anti-tyrosine hydroxylase (TH) antibody (MAB 318-AF 555, 1:100, EMD
Millipore, Billerica, Massachusetts, U.S.A.), mouse anti-growth-associated protein-43 (GAP43)
antibody (MAB 347, 1:100, EMD Millipore), or mouse anti-choline acetyltransferase (ChAT)
antibody (MAB 305, 1:100, EMD Millipore). Spinal cords at 2 weeks after surgery were incubated
in goat anti-ChAT antibody (AB 144P, 1:100, EMD Millipore), and spinal cord at 1 week after
surgery were incubated in a cocktail of goat anti-ChAT antibody (1:100) with rabbit
anti-brain-derived neurotrophic factor (BDNF) antibody (AB1779SP, 1:100, EMD Millipore), rabbit
anti-TrkB antibody (sc-12, 1:200, Santa Cruz Biotechnology, Santa Cruz, California, U.S.A.) or
rabbit anti-phospho-extracellular signal-regulated kinase (pERK) (Thr202/Tyr204) antibody (#4370,
1:100, Cell Signaling Technology, Danvers, Massachusetts, U.S.A.). Following a series of rinses
with 1% PBS, the sections were incubated for one hour at room temperature in the appropriate
secondary antibodies (Alexa 488 donkey anti-mouse, Alexa 488 donkey anti-rabbit, Alexa 594
donkey anti-goat, all at 1:1000, Abcam, Cambridge, U.K.), which were diluted in 1% PBS. As a
control, tissues were processed with the omission of the primary antibodies. All images were
captured using a BZ-X 700 microscope (Keyence, Osaka, Japan) and analyzed using BZ-X analyzer
software (Keyence)
Analysis of immunohistochemistry
BZ-X analyzer software was used to determine the neuronal sizes and nerve densities of SGs and
IMLs. The neuronal size was automatically measured by the color of the immunohistochemical
stains and then calculated as the pixel area of the nerves. The positive nerve densities were expressed
as the total area of all counted nerve fibers divided by the total area examined (µm
2/mm
2). The
average fluorescence intensity within each cell was measured for the evaluation of the expression of
BDNF and TrkB. Background intensity, defined as an area without cells, was measured, and the
value was subtracted from the average fluorescence intensity of the cells. The percentage of pERK
positive cells was carefully distinguished between negative and positive staining while comparing
with the control images. A single blinded investigator randomly selected three fields for each section
and averaged measured values on the selected fields.
mRNA analysis
Spinal cords at the Th2 level, collected from 0.9% saline perfused rats (1 week MI group: N=5, sham
group: N=6), were immediately frozen in liquid nitrogen and stored in -80
℃for further processing.
Total RNA was extracted using TRIZOL reagent (Invitrogen, Waltham, Massachusetts, U.S.A.)
according to the manufacturer’s protocol. The concentrations in all RNA samples were determined
spectrophotometrically. A cDNA was produced from total RNA using the ReverTra Ace qPCR RT
Master Mix (ToYoBo Co., Ltd., Osaka, Japan) according to the manufacturer’s instructions. The
expression levels of candidate genes were measured by real-time quantitative RT-PCR (qRT-PCR)
using SYBR Green PCR Master mix (Applied Biosystems, Waltham, Massachusetts, U.S.A.) and
primers specific for rat on a CFX Connect (Bio-Rad Laboratories, Hercules, California, U.S.A.)
according to the manufacturer’s protocol. In each assay, β-actin was determined as internal control
along with a target gene in each sample. The mRNA levels of each gene were calculated with the
relative standard curve method and normalized against corresponding β-actin mRNA levels, and then
expressed as relative change over control±SD. A single dissociation peak was detected in each
reaction by a dissociation curve. Primers were designed based on the GenBank sequences. Table 1
shows the primer sequences and amplicon size of the selected genes.
Western blotting
The tissue samples of spinal cords at the Th2 level were obtained from the each group (1 week MI
group: N=7, sham group: N=8). The total protein was extracted from the snap-frozen spinal cord
using Cell Lysis Buffer (Cell Signaling Technology) with Protease Inhibitor Cocktail (BD
Biosciences, San Jose, California, U.S.A.). The protein concentration of the sample was determined
by protein assay (DC protein assay kit, Bio-Rad Laboratories, Hercules, California, U.S.A.). Equal
amounts (20 µg) of the protein samples were subjected to electrophoresis onto sodium dodecyl
sulfate polyacrylamide gel electrophoresis (SDS-PAGE, 10%) and transferred onto polyvinylidene
difluoride membranes (ATTO Co., Tokyo, Japan). Membranes were blocked in Tris-buffered saline
Tween 20 (TBST) containing 5% bovine serum albumin at room temperature for 60 minutes and
were incubated overnight at 4℃ with the following primary antibodies: rabbit anti-pERK
(Thr202/Tyr204) antibody (#9101, 1:1000, Cell Signaling Technology) and rabbit anti-ERK
(Thr202/Tyr204) antibody (#9102, 1:1000, Cell Signaling Technology). Membranes were then
washed in TBST, and incubated at room temperature for 60 minutes with the anti-rabbit horseradish
peroxidase-linked secondary antibody (NA 934-100UL, 1:10000, GE healthcare, Chicago, Illinois,
U.S.A.). The signals from the immunoreactive bands were visualized by an Amersham ECL system
(Amersham Pharmacia Biotech UK Ltd., Buckinghamshire, U.K.) The relative intensities of the
protein bands were quantified using NIH Image J, version (1.48) (Scion Image, NIH, Bethesda,
Maryland, U.S.A.).
Statistical analysis
All data are presented as mean±SD. Unpaired Student’s t-test was used to compare the means for
independent samples. On the other hands, paired Student’s t-test was used to compare the means for
paired samples. A value of P<0.05 was considered statistically significant. All analyses were
performed using a statistical software package (SPSS ver. 23.0, IBM, Armonk, New York, U.S.A.).
Results
The neural remodeling in SG and IML after MI
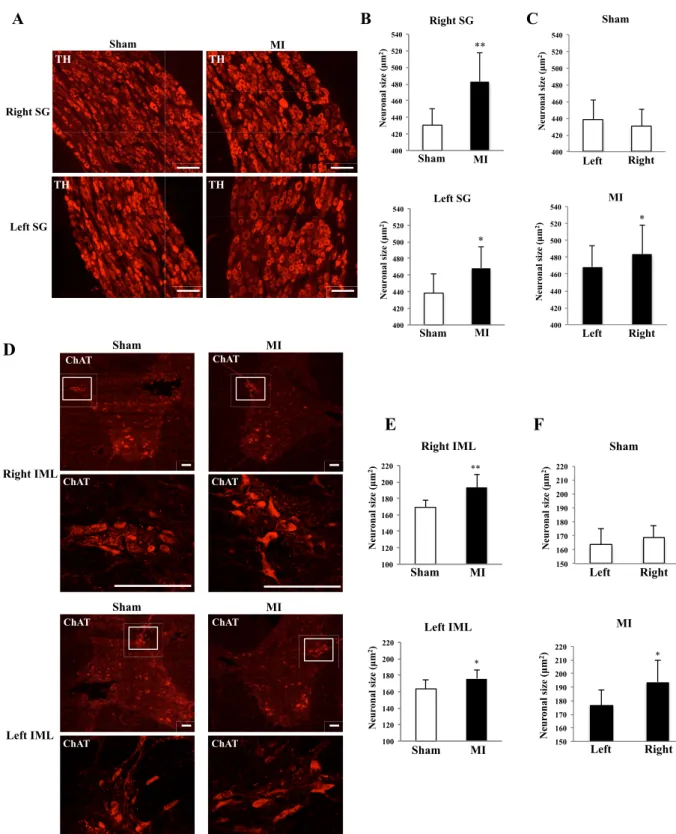
In order to confirm neural remodeling in postganglionic sympathetic neurons after MI, the neuronal
size was measured in SG. The size of TH-immunoreactive cell bodies in both right and left SGs was
increased 2 weeks after MI compared to sham (Right 483.1±34.2 vs. 430.5±20.0 µm
2, P<0.01; Left
468.6±25.4 vs. 438.3±23.1 µm
2, P<0.05, respectively) (Fig.1, A and B). Next, the neuronal size in
IML was examined after MI. ChAT-immunoreactive cell bodies, i.e. preganglionic sympathetic
neurons, in both right and left IMLs were increased 2 weeks after MI compared to sham (Right
193.5±16.0 vs. 169.1±8.5 µm
2, P<0.01; Left 176.1±10.7 vs. 163.4±11.5 µm
2, P<0.05, respectively)
(Fig. 1, D and E). The neuronal size in both SG and IML was not different between the right and left
sides in the sham group, whereas the right side neuronal size in both SG and IML was larger than the
left side in the MI group (Fig.1, C and F).
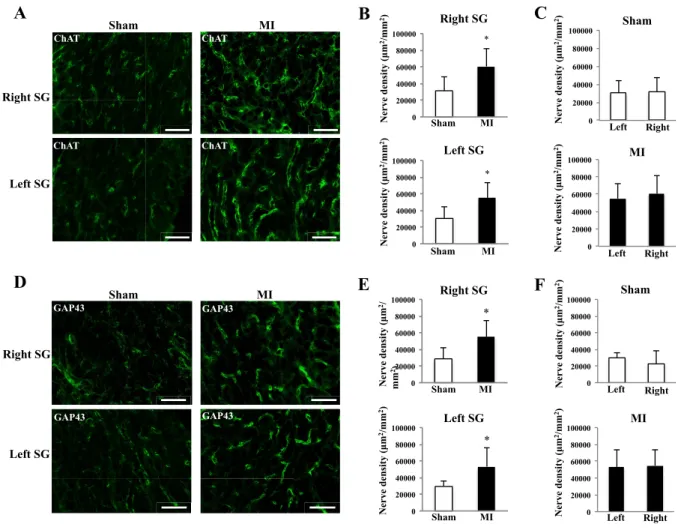
Fig. 2 shows the density of axons derived from preganglionic sympathetic neurons projecting to
bilateral SGs. Consistent with the increased neuronal size in IML, the densities of
ChAT-immunoreactive axons in the bilateral SGs were increased 2 weeks after MI compared to
sham (Right 60587±21767 vs. 31380±17026 µm
2/mm
2, P<0.05; Left 55096±18265 vs. 30443±14537
µm
2/mm
2, P<0.05, respectively) (Fig. 2, A and B). The densities of ChAT-immunoreactive axons in
SG were not different between the right and left sides in both the sham and MI groups (Fig. 2, C). In
addition, the densities of GAP43-immunoreactive nerve, a marker of nerve sprouting, in bilateral
SGs were increased 2 weeks after MI compared to sham (Right 54750±20047 vs. 28668±12717
µm
2/mm
2, P<0.05; Left 53216±23186 vs. 29386±7033 µm
2/mm
2, P<0.05, respectively) (Fig. 2, D
and E). The densities of GAP43-immunoreactive axons in SG were no different between the right
and left sides in both the sham and MI groups (Fig. 2, F).
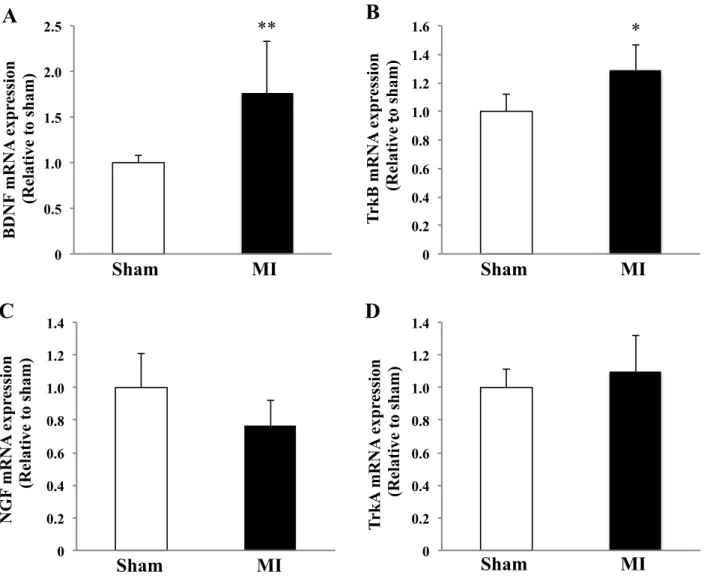
The mRNA expression of BDNF and TrkB in spinal cord
We next examined mRNA expression levels of the neurotrophic factors and their receptors in the
spinal cord after MI. The mRNA expression of BDNF was increased 1 week after MI (1.8±0.9-fold
change vs. sham, P<0.01) (Fig. 3A). The mRNA expression of TrkB, a receptor for BDNF, was also
increased after MI (1.3±0.2-fold change vs. sham, P<0.05) (Fig. 3B). On the other hand, the mRNA
expression of nerve growth factor (NGF) and its receptor TrkA was unchanged after MI
(0.8±0.2-fold change vs. sham, P=N.S.; 1.1±0.2-fold change vs. sham, P=N.S.) (Fig. 3, C and D).
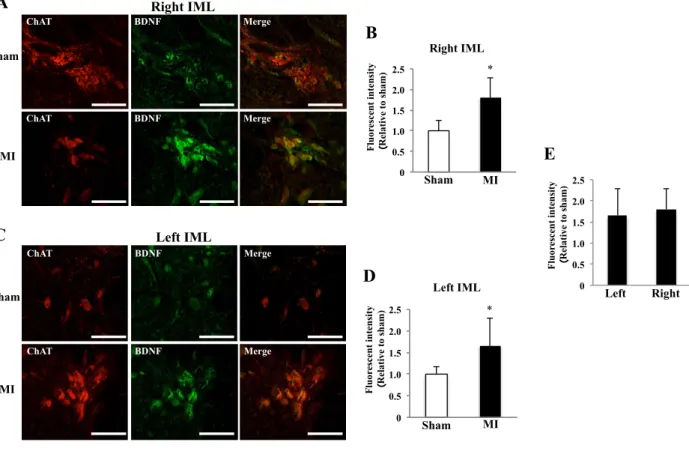
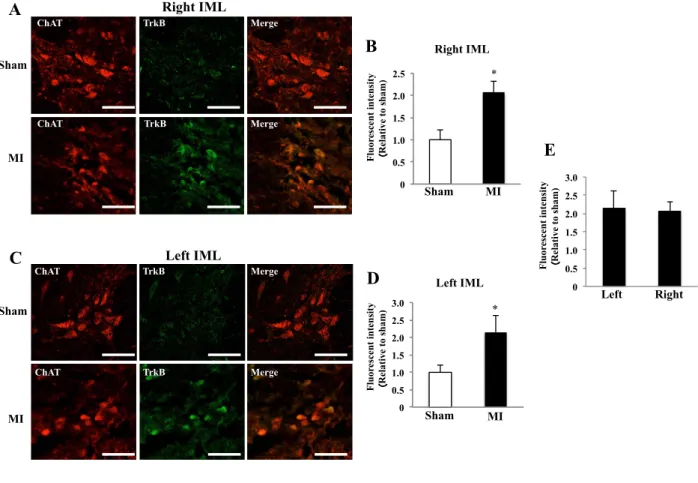
The fluorescence intensity of BDNF and TrkB in IML
Consistent with the increased expression of mRNA in the spinal cord, the fluorescence intensity for
BDNF in bilateral IMLs was significantly higher in the MI group than in the sham group (Fig. 4, A,
B, C and D). Similarly, the fluorescence intensity for TrkB in bilateral IMLs was also significantly
increased in MI compared to sham (Fig. 5, A, B, C and D). The fluorescence intensity for both
BDNF and TrkB in IML was not different between the right and left sides in the MI group (Fig. 4E
and 5E).
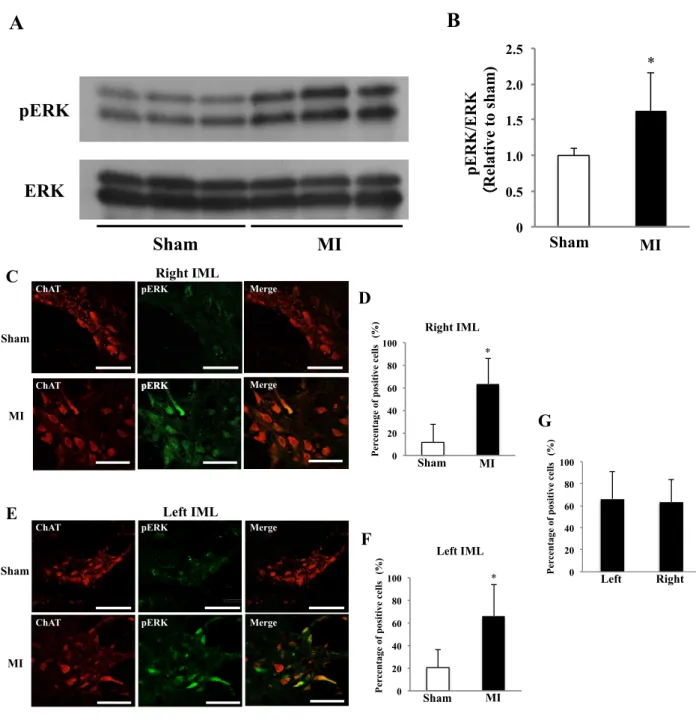
The activation of ERK in the spinal cord
We examined whether increased expressions of BDNF and TrkB resulted in activation of
intracellular trophic signals in IML neurons. Western blot analysis showed that ERK was
significantly activated after MI in the spinal cord at Th2 level (Fig. 6, A and B). Next,
pERK-immunoreactive neurons were counted in IML 1 week after MI. The pERK was detected in
both cytoplasm and nuclei, and the percentage of pERK-immunoreactive neurons in bilateral IMLs
was significantly higher in the MI group than in the sham group (Fig. 6, C, D, E and F). The
percentage of pERK-immunoreactive neurons in IML was not different between the right and left
sides in the MI group (Fig. 6G).
Discussion
The major findings of the present study are as follows: 1) neural remodeling was induced by MI as
demonstrated by increased neuronal size in IML and GAP43 positive axonal density in SG, and
2)mRNA expression of BDNF and its receptor TrkB in the spinal cord was increased, and the
fluorescence intensity of BDNF, TrkB in IML were higher after MI, and 3) phosphorylation activity
of ERK and the percentage of pERK-immunoreactive neurons in IML were higher after MI. These
results support our hypothesis that MI induces sympathetic nervous remodeling of IML via
activation of the BDNF-TrkB axis.
Several studies have shown that neural remodeling of SG is induced after MI (2, 15, 20, 21, 26, 39).
In contrast, little is known about the neural remodeling at the upper level of the sympathetic SNS for
the heart. The present study demonstrated that neuronal size in IML and density of ChAT-,
GAP43-positive axons in SG were increased after MI. These findings indicate that neuronal
hypertrophy in IML and nerve sprouting from IML to SG, that is, neural remodeling of IML occurs
after MI. To our knowledge, this is the first study to show that MI induces neuronal hypertrophy in
IML.
Neurotrophic factors regulate differentiation, maintenance and survival of nerve cells through
binding to Trk receptors (11, 33, 37). BDNF and its receptor TrkB are widely distributed in the
central nervous system (11, 22, 33, 37). In the present study, fluorescence intensity for TrkB protein
in IML and TrkB mRNA in the spinal cord at the corresponding level were increased after MI,
suggesting that TrkB expression is increased in IML after MI. Similarly, fluorescence intensity for
BDNF protein, the most specific ligand for TrkB, in IML and BDNF mRNA in the spinal cord at the
corresponding levels were increased after MI, but these findings do not necessarily prove that the
expression of BDNF in IML is increased. It is possible that BDNF is produced and secreted by other
types of cells, bound to TrkB and internalized into neurons in IML. A previous study by Conner et al.
demonstrated that BDNF mRNA in the spinal cord is expressed only in the intermediate zone, where
IML is located (7). Therefore, up-regulated BDNF in IML may be derived from preganglionic
neurons inside IML by an autocrine mechanism and/or from glial cells surrounding the neurons
inside or near IML by a paracrine mechanism.
The expression of BDNF is regulated by various transcriptional factors including cAMP response
element binding protein (CREB), the nuclear factor of T cells, and the nuclear factor κB (16). TrkB
expression was also regulated by CREB in neuronal cells (8, 13). A previous report showed that
angiotensin II increased the expression of BDNF in rostral ventrolateral medulla(RVLM)via the
phosphorylation of CREB (6). Ano ther study by Iskra et al. showed that tumor necrosis factor-α
(TNF-α) activated CREB via the p38 mitogen-activated protein kinase pathway, resulting in
increased expression of BDNF in trigeminal ganglion neurons (12) . Thus, several lines of evidence
clarified the mechanisms of upregulating BDNF and TrkB in central or peripheral nervous system,
but the mechanisms in IML are still lacking. Plasma angiotensin II signals to the brain through
circumventricular organs, which lack a tight blood brain barrier, in normal conditions (28). However,
Biancardi et al. reported that increased angiotensin II can access to the paraventricular nucleus of the
hypothalamus and RVLM parenchyma via disruption of blood brain barrier in hypertensive
condition (4), suggesting that circulating angiotensin II can affect directly sympathoexcitatory
centers in pathological state. Considering the following reports that angiotensin type 1 receptor
expresses in IML neurons (1), and angiotensin II activated microglia resulting in increased
proinflammatory cytokines including TNF-α and nuclear factor
κB (32), it might be possible thatpathologically increased levels of angiotensin II can access to IML neurons and/or microglia, leading
to enhance the expression of BDNF and TrkB in IML.
Trk family members are receptor tyrosine kinases, activated by the binding of neurotrophic factors,
which are autophosphorylates themselves, and thereby triggers various trophic signals including
Ras-ERK axis, Src, phosphoinositide 3-kinase-Akt axis, and phospholipase C-γ. These signal events
are involved in sprouting, migration and hypertrophy of neurons. We showed that ERK is activated
in preganglionic neurons in IML after MI. As mentioned earlier, BDNF and TrkB expressions were
increased after MI. In contrast to BDNF and TrkB expression in IML, we could not detect a
significant increase in NGF and its receptor TrkA after MI. NGF and its receptor TrkA are mainly
distributed in the peripheral nervous system and restricted to defined areas of the central nervous
system. Michael et al. reported that there were no TrkA-immunoreactive neurons in IML (19). Other
studies have showed that preganglionic neurons did not respond to NGF (23, 31), probably because
TrkA was not expressed in preganglionic neurons. Thus, the NGF-TrkA axis may exclusively be
involved in neural remodeling of SG after MI, which belongs to the peripheral nervous system (15,
20, 21, 39). In addition, we could not detect TrkC in IML (unpublished data). Therefore, it is likely
that activation of ERK after MI is due to increased expression of the BDNF-TrkB axis in IML,
which leads to neuronal hypertrophy of IML and sprouting into SG.
In our study, the right side neuronal size in SG after MI was larger than the left side. Several studies
have shown that the right side SG innervates predominantly the anterior aspect of the left ventricle
(LV), whereas the left side SG innervates predominantly the posterior aspect of the LV (27, 36, 38).
In addition, NGF released from the infarct site and retrogradely transported to SG causes neural
remodeling of SG (15, 20, 21, 39). Because we created MI in the anterior aspect of LV, the amount
of NGF in the right side might be larger than in the left side, resulting in right side dominant
neuronal hypertrophy of SG. Right side dominant neuronal hypertrophy was also observed in IML. It
has been shown that TNF-α was released from mainly the infarct site after MI (34). Lin et al.
reported expressions of BDNF and TrkB in the spinal dorsal root ganglion (DRG) was upregulated
by TNF-α released from the inflammatory area and retrogradely transported to the DRG (14).
Because cardiac afferent nerves are also distributed in IML, TNF-αreleased from the infarct site
may retrogradely transported to IML, involving in increased expressions of BDNF and TrkB. On the
other hands, axonal density of IML, BDNF, TrkB protein expressions and ERK activity in IML were
not different between the right and left sides. These results were conflicting with the above
mechanisms. In this study, these experiments were performed by the immunohistochemistry. There
is a possibility that the capability of the immunohistochemistry was not enough to detect subtle
differences between the right and left sides.
Until recently, sympathetic nervous remodeling in MI has been well documented in the context of
sympathetic efferent regeneration to repair disrupted sympathetic nerve innervation between infarct
myocardium and SG. In the present study, we first demonstrated the evidence of neural remodeling
in both IML and SG, suggesting a novel concept that neural remodeling may involve whole SNS. It
seems reasonable to hypothesize that sympathetic neuronal hypertrophy is a compensatory response
to overcome acute heart failure by means of sustained activation of sympathetic tone. However,
sustained over-activation of the SNS causes the worsening of heart failure in the chronic phase and
development of fatal ventricular tachyarrhythmia (16, 34). Thus, further studies are needed to
elucidate the pathophysiological mechanisms of neural remodeling throughout the SNS, which may
lead to provide a novel approach for suppressing abnormal sympathetic excitement after MI.
Conclusion
We demonstrated that neuronal remodeling in IML probably via activation of the BDNF-TrkB axis
after MI. The morphological remodeling throughout the SNS may be involved in its sustained
activation after MI.
Disclosures None.
Acknowledgments
We thank Drs. Masayoshi Oikawa, Ryoji Fukabori, Shigeki Kato, Naoki Tomikawa, Takafumi
Ishida, Kazuto Kobayashi and Yasuchika Takeishi for their valuable comments on the present study,
and Ms. Tomiko Miura for her excellent technical assistance.
References
1. Ahmad Z, Milligan CJ, Paton JF, Deuchars J. Angiotensin type 1 receptor immunoreactivity
in the thoracic spinal cord. Brain Res 985: 21-31, 2003.
2. Ajijola OA, Yagishita D, Reddy NK, Yamakawa K, Vaseghi M, Downs AM, Hoover DB,
Ardell JL, Shivkumar S. Remodeling of stellate ganglion neurons following spatially targeted
myocardial infarction: neuropeptide and morphologic changes. Heart Rhythm 12: 1027-1035,
2015.
3. Billman GE. A comprehensive review and analysis of 25 years of data from an in vivo canine
model of sudden cardiac death: implications for future anti-arrhythmic drug development.
Pharmacol Ther 111: 808-835, 2006.
4. Blancardi VC, Son SJ, Ahmadi S, Filosa JA, Stem JE. Circulating angiotensin II gains access
to the hypothalamus and brain stem during hypertension via breakdown of the blood-brain barrier.
Hypertension 63: 572-579, 2014.
5. Causing CG, Gloster A, Aloyz R, Bamji SX, Chang E, Fawcett J, Kuchel G, Miller FD.
Synaptic innervation density is regulated by neuron-derived BDNF. Neuron 18: 257-267, 1997.
6. Chan SH, Wu CW, Chang AY, Hsu KS, Chan. JY. Transcriptional upregulation of
brain-derived neurotrophic factor in rostral ventrolateral medulla by angiotensin II significance in
superoxide homeostasis and neural regulation of arterial pressure. Circ Res 107: 1127-1139,
2010.
7. Conner JM, Lauterborn JC, Yan Q, Gall CM, Varon S. Distribution of brain-derived
neurotrophic factor (BDNF) protein and mRNA in the normal adult rat CNS: evidence for
anterograde axonal transport. J Neurosci 1: 2295-2313, 1997.
8. Deogracias R, Espliguero G, Iglesias T, Pena AR. Expression of the neurotrophin receptor
trkB is regulated by the cAMP/CREB pathway in neurons. Mol Cell Neurosci 26: 470-480, 2004.
9. Du XJ, Dart AM. Role of sympathoadrenergic mechanisms in arrhythmogenesis. Cardiovasc
Res 43: 832-834, 1999.
10. Han S, Kobayashi K, Joung B, Piccirillo G, Maruyama M, Vinters HV, March K, Lin SF,
Shen C, Fishbein MC, Chen PS, Chen LS. Electroanatomic remodeling of the left stellate
ganglion after myocardial infarction. J Am Coll Cardiol 59: 954-961, 2012.
11. Huang EJ, Reichardt LF. Neurotrophins: Roles in neuronal development and function. Annu
Rev Neurosci 24: 677-736, 2001.
12. Iskra EB, Schmaedick AV, Balkowiec A, Sorkin LS. Tumor necrosis factor-α increases BDNF
expression in trigeminal ganglion neurons in an activity-dependent manner. Neuroscience 180:
322-333, 2011.
13. Lei L, Parada LF. Transcriptional regulation of Trk family neurotrophin receptors. Cell Mol
Life Sci 64: 522-532, 2007.
14. Lin YT, Ro LS, Wang HL, Chen JC. Up-regulation of dorsal root ganglia BDNF and trkB
receptor in inflammatory pain: an in vivo and in vitro study. J Neuroinflammation 8: 126, 2011.
15. Li Z, Wang M, Zhang Y, Zheng S, Wang X, Hou Y. The effect of the left stellate ganglion on
sympathetic neural remodeling of the left atrium in rats following myocardial infarction. Pace
38: 107-114, 2015.
16. Lymperopoulos A, Rengo G, Koch WJ. The adrenergic nervous system in heart failure:
pathophysiology and therapy. Circ Res 113: 759-763, 2013.
17. Lyons MR, West AE. Mechanisms of specificity in neuronal activity-regulated gene
transcription. Prog Neurobiol 94: 259–295, 2011.
18. McCartney AM, Abejuela L, Isaacson LG. Characterization of trkB immunoreactive cells in
19. Michael GJ, Kaya E, Averill S, Rattray M, Clary DO, Priestley JV. TrkA immunoreactive
neurons in the rat spinal cord. J Comp Neurol 385: 441-455, 1997.
20. Nguyen BL, Li H, Fishbein MC, Lin SF, Gaudio C, Chen PS, Chen LS.
Acute myocardial
infarction induces bilateral stellate ganglia neural remodeling in rabbits. Cardiovasc Pathol 21:
143-148, 2012.
21. Oh YS, Jong AY, Kim DT, Li H, Wang C, Zemljic–Harpf A, Ross RS, Fishbein MC, Chen
PS, Chen LS. Spatial distribution of nerve sprouting after myocardial infarction in mice. Heart
Rhythm 3: 728-736, 2006.
22. Okada S, Yokoyama M, Toko H, Tateno K, Moriya J, Shimizu I, Nojima A, Ito T, Yoshida
Y, Kobayashi Y, Katagiri H, Minamino T, Komuro I. Brain-derived neurotrophic factor
protects against cardiac dysfunction after myocardial infarction via central nervous
system-mediated pathway. Arterioscler Thromb Vasc Biol 32: 1902-1909, 2012.
23. Oppenheim R.W, Maderdrut, JL, Wells DJ. Cell death of motoneurons in the chick embryo
spinal cord. VI. Reduction of naturally occurring cell death in the thoracolumbar column of Terni
by nerve growth factor. J Comp Neurol 210: 174-189, 1982.
24. Pardini BJ, Lund DD, Schmid PG. Organization of the sympathetic postganglionic innervation
of the rat heart. J Auton Nerv Syst 28: 193-201, 1989.
25. Pardini BJ, Lund DD, Schmid PG. Innervation patterns of the middle cervical-stellate ganglion
complex in the rat. Neurosci Lett 117: 300-306, 1990.
26. Rajendran PS, Nakamura K, Ajijola OA, Vaseghi M, Armour JA, Ardell JL, Shivkumar K.
Myocardial infarction induces structural and functional remodeling of the intrinsic cardiac
nervous system. J Physiol 594: 321-341, 2016.
27. Ramirez RJ, Ajijola OA, Zhou W, Holmstrom B, Luning H, Laks MM, Shivkumar K,
Mahajan A. A new electrocardiographic marker for sympathetic nerve stimulation: modulation
of repolarization by stimulation of stellate ganglia. J Electrocardiol 44: 694–699, 2011.
28. Roig E, Perez-Villa F, Morales M, Jimenez W, Orus J, Heras M, Sanz G.
Clinical implications of increased plasma angiotensin II despite ACE inhibitor therapy in patients
with congestive heart failure. Eur Heart J 21: 53-57, 2000.
29. Rubart M, Zipes DP. Mechanisms of sudden cardiac death. J Clin Invest 115: 2305-2315, 2005.
30. Schober A, Wolf N, Kahane N, Kalcheim C, Krieglstein K, Unsicker K. Expression of
neurotrophin receptors trkB and trkC and their ligands in rat adrenal gland and the
intermediolateral column of the spinal cord. Cell Tissue Res 296: 271-279, 1999.
31. Schwab ME, Thoenen H. Selective trans-synaptic migration of tetanus toxin after retrograde
axonal transport in peripheral sympathetic nerves: A comparison with nerve growth factor. Brain
Res 122: 459-474, 1977.
32. Shi P, Diez-Fieier C, Jun JY, Qi Y, Katovich MJ, Li Q, Sriamula S, Francis J, Sumners C,
Raizada MK. Brain microglial cytokines in neurogenic hypertension. Hypertension 56: 297-303,
2010.
33. Skaper SD. The neurotrophin family of neurotrophic factors: an overview. Methods Mol Biol
846: 1-12, 2012.
34. Tian M, Yuan YC, Li JY, Gionfriddo MR, Huang RC. Tumor necrosis factor-αand its role
as a mediator in myocardial infarction: A brief review. Chronic Dis Transl Med 1: 18-26, 2015.
35. Triposkiadis F, Karayannis G, Giamouzis G, Skoularigis J, Louridas G, Butler J. The
sympathetic nervous system in heart failure physiology, pathophysiology, and clinical
implications. J Am Coll Cardiol 54: 1747-1762, 2009.
36. Ueda H, Yanai Y, Murao S, Harumi K, Mashima S, Kuroiwa A, Sugimoto T, Shimomura D.
Electrocardiographic and vectorcardio- graphic changes produced by electrical stimulation of the
cardiac nerves. Jpn Heart J 28: 359 –372, 1964.
37. Wiesmann C, de Vos AM. Nerve growth factor: structure and function. Cell Mol Life Sci 58:
748-759, 2001.
38. Yanowitz F, Preston JB, Abildskov JA. Functional distribution of right and left stellate
innervation to the ventricles. Production of neurogenic electrocardiographic changes by unilateral
alteration of sympathetic tone. Circ Res 18: 416 –428, 1966.
39. Zhou S, Chen LS, Miyauchi Y, Miyauchi M, Kar S, Kangavari S, Fishbein MC, Sharifi B,
Chen PS. Mechanisms of cardiac nerve sprouting after myocardial infarction in dogs. Circ Res
95: 76-83, 2004.
40. Zhou S, Jung B-C, Tan AY, Trang VQ, Gholmieh G, Han SW, Lin SF, Fishbein MC, Chen
PS, Chen LS. Spontaneous stellate ganglion nerve activity and ventricular arrhythmia in a canine
model of sudden death. Heart Rhythm 5: 131-139, 2008.
Table.1 Primer sequence and amplicon size of genes evaluated by qRT-PCR
Gene Name Primer sequence Amplicon size, bp
�-actin
F: 5’-GGAGATTACTGCCCTGGCTCCTA-3’
150 R: 5’-GACTCATCGTACTCCTGCTTGCTG-3’
BDNF F: 5’-CAGCGCGAATGTGTTAGTGTTA-3’
112 R: 5’-CAGTGGACAGCCACTTTGTTTCA-3’
TrkB F: 5’-GTGGATTCCGGCTTAAAGTTTGTG-3’
126 R: 5’-CAAGTCAAGGTGGCGGAAATG-3’
NGF
F: 5’-TGCCAAGGACGCAGCTTTC-3’
171 R: 5’-TGAAGTTTAGTCCAGTGGGCTTCAG-3’
TrkA F: 5’-TGCTCAACAAATGTGGACAGAGG-3’
98 R: 5’-TGTCA GAAGTGTAGGGACATGG-3’
BDNF, brain-derived neurotrophic factor; TrkB, tropomyosin receptor kinase B; NGF, nerve growth factor;
TrkA, tropomyosin receptor kinase A.
Fig. 1. Neuronal cell body hypertrophy in SG and IML 2 weeks after MI.
A: Images of TH-immunofluorescence staining sections of bilateral SGs in sham and MI rats (scale bar: 100 µm). B:
Comparison of TH-immunoreactive neuronal size in bilateral SGs between sham and MI rats. C: Comparison of TH-immunoreactive neuronal size between right and left SGs in sham and MI rats. D: Images of ChAT-immunofluorescence staining sections of bilateral IMLs of sham and MI rats (scale bar: 100 µm). E: Comparison of ChAT-immunoreactive
400 420 440 460 480 500 520 540
A
Right SG
Left SG
Sham MI
TH TH
TH TH
B
400 420 440 460 480 500 520 540
Neuronal size (µm2)
Sham MI
**
Right SG
400 420 440 460 480 500 520 540
Sham MI
*
Neuronal size (µm2)
Left SG
400 420 440 460 480 500 520 540
Left Right Sham
Neuronal size (µm2)
MI
Left Right
Neuronal size (µm2) *
C
Sham MI Left Right
MI ChAT
ChAT
ChAT
ChAT
ChAT
ChAT
ChAT
ChAT
100 120 140 160 180 200 220
Sham MI Right IML
**
Neuronal size (µm2)
100 120 140 160 180 200 220
Left IML
Sham MI
*
Neuronal size (µm2)
Sham MI
Sham MI
Right IML
Left IML
E D
150 160 170 180 190 200 210 220
Left Right Neuronal size (µm2)
Sham
F
150 160 170 180 190 200 210 220
Left Right Neuronal size (µm2)
MI
*
Fig. 2. The density of axons derived from preganglionic sympathetic neuron projecting to SG 2 weeks after MI.
A: Images of ChAT-immunofluorescence staining sections of bilateral SGs in sham and MI rats (scale bar: 100 µm). B:
Comparison of ChAT-immunoreactive nerve density in bilateral SGs between sham and MI rats. C: Comparison of ChAT-immunoreactive nerve density between right and left SGs in sham and MI rats. D: Images of GAP43-immunofluorescence staining sections of bilateral SGs in sham and MI rats (scale bar: 100 µm). E: Comparison of GAP43-immunoreactive nerve density in bilateral SGs between sham and MI rats. F: Comparison of GAP43-immunoreactive nerve density between right and left SGs in sham and MI rats. *P < 0.05 vs. sham. N=10 or 11 in each group.
0 20000 40000 60000 80000 100000 0 20000 40000 60000 80000
100000 Right SG
0 20000 40000 60000 80000 100000 0 20000 40000 60000 80000 100000
MI Right SG
Left SG
Right SG
Left SG
Sham 100µ
m
ChAT ChAT
ChAT ChAT
Sham MI
GAP43 GAP43
GAP43 GAP43
Sham MI
Sham
*
Nerve density (µm2/mm2) Right SG
Left SG
MI Sham
*
Nerve density (µm2/mm2)
A B
D
MI Sham
*
MI Sham
* Nerve density (µm2/ mm2) Nerve density (µm2/mm2)
Left SG
E
0 20000 40000 60000 80000 100000
Nerve density (µm2/mm2)
0 20000 40000 60000 80000 100000
Nerve density (µm2/mm2)
Left Right Sham
MI
C
0 20000 40000 60000 80000 100000
0 20000 40000 60000 80000 100000 Nerve density (µm2/mm2) Nerve density (µm2/mm2)
Sham
MI
F
Left Right
Left Right Left Right
0 0.2 0.4 0.6 0.8 1.0 1.2 1.4 0 0.2 0.4 0.6 0.8 1.0 1.2 1.4 1.6
0 0.5 1.0 1.5 2.0 2.5
Sham MI Sham MI
BDNF mRNA expression (Relative to sham) TrkB mRNA expression (Relative
o sham)
A B
** *
Sham MI Sham MI
NGF mRNA expression (Relative to sham) TrkA mRNA expression (Relative to sham)
C D
0 0.2 0.4 0.6 0.8 1.0 1.2 1.4
Fig. 3. Gene expressions of BDNF (A), TrkB (B), NGF (C), and TrkA (D) in spinal cord 1 week after MI. *P <
0.05, **P < 0.01 vs. sham. N=5 or 6 in each group.
Fig. 4. Fluorescence intensity of BDNF in IML 1 week after MI
A: Images of double immunofluorescence staining (ChAT and BDNF) sections of right IML of sham and MI rats (scale bar: 50 µm). B: Comparison of immunofluorescence intensity of BDNF in right IML between sham and MI rats. C:
Images of double immunofluorescence staining (ChAT and BDNF) sections of left IML of sham and MI rats (scale bar:
50 µm). D: Comparison of immunofluorescence intensity of BDNF in left IML between sham and MI rats. E:
Comparison of immunofluorescence intensity of BDNF between right and left IMLs in MI rats. *P < 0.05 vs. control.
N=5 or 6 in each group.
0 0.5 1.0 1.5 2.0 2.5
Sham MI Right IML
Fluorescent intensity Relative to sham)
*
B
0 0.5 1.0 1.5 2.0 2.5
Sham MI
Left IML
*
Fluorescent intensity Relative to sham)
D
Sham
MI
ChAT BDNF Merge
ChAT BDNF Merge
A
Sham
MI
ChAT BDNF Merge
ChAT BDNF Merge
C
Right IML
Left IML
0 0.5 1.0 1.5 2.0 2.5
Fluorescent intensity Relative to sham)
E
Left Right
Fig. 5. Fluorescence intensity of TrkB in IML 1 week after MI
A: Images of double immunofluorescence staining (ChAT and TrkB) sections of right IML of sham and MI rats (scale bar: 50 µm). B: Comparison of immunofluorescence intensity of TrkB in right IML between sham and MI rats. C: Images of double immunofluorescence staining (ChAT and TrkB) sections of left IML of sham and MI rats (scale bar: 50 µm). D:
Comparison of immunofluorescence intensity of TrkB in left IML between sham and MI rats. E: Comparison of immunofluorescence intensity of TrkB between right and left IMLs in MI rats. *P < 0.05 vs. control. N=5 or 6 in each group.
0 0.5 1.0 1.5 2.0 2.5
B
Sham MI Right IML
*
Fluorescent intensity Relative to sham)
0 0.5 1.0 1.5 2.0 2.5 3.0
D
Sham MI Left IML
*
Fluorescent intensity Relative to sham) Sham
MI
Sham
MI
A
C
ChAT TrkB Merge
ChAT TrkB Merge
ChAT TrkB Merge
ChAT TrkB Merge
Right IML
Left IML
0 0.5 1.0 1.5 2.0 2.5 3.0
Fluorescent intensity Relative to sham)
E
Left Right
0 20 40 60 80 100
Percentage of positive cells(%)
D
Sham MI Right IML
*
Percentage of positive cells(%)
0 20 40 60 80 100
MI
F
Sham Left IML Sham *
MI
E
ChAT pERK Merge
ChAT pERK Merge
Sham
C
MI
ChAT pERK Merge
ChAT pERKRight IML Merge
Left IML
pERK
0 20 40 60 80 100
Percentage of positive cells(%)
Left Right
G
Fig. 6. The activation of ERK in the spinal cord 1 week after MI
A: Representative Western blot of pERK and total ERK in the spinal cord of sham and MI rats. B: Comparison of pERK/ERK ratio in the spinal cord between sham and MI rats. *P < 0.05 vs. sham. N=7 or 8 in each group. C: Images of double immunofluorescence staining (ChAT and pERK) sections of right IML of sham and MI rats (scale bar: 50µm).
D: Comparison of the percentage of pERK positive neurons in right IML between sham and MI rats. E: Images of double immunofluorescence staining (ChAT and pERK) sections of left IML of sham and MI rats (scale bar: 50µm). F:
Comparison of the percentage of pERK positive neurons in left IML between sham and MI rats. G: Comparison of the percentage of pERK positive neurons between right and left IMLs in MI rats. *P < 0.05 vs. sham. N=5 or 6 in each group.
pERK
ERK
MI Sham
pERK / ERK
Sham MI
A B
pERK/ERK Relative to sham)
0 0.5 1.0 1.5 2.0
2.5 *
Sham MI