High-molecular-weight adiponectin levels in healthy, community-dwelling, elderly Japanese volunteers: a 5-
year prospective observational study
日本大学医学部内科学系総合内科・総合診療医学分野 大塚 博雅
申請年 2017年 指導教員 相馬 正義
ORIGINAL ARTICLE
High-molecular-weight adiponectin levels in healthy, community- dwelling, elderly Japanese volunteers: a 5-year prospective
observational study
Hiromasa Otsuka
1· Mitsuru Yanai
1· Hiroki Kobayashi
2· Akira Haketa
2· Motohiko Hara
3· Kaoru Sugama
4· Kimitoshi Kato
1· Masayoshi Soma
1Received: 24 August 2017 / Accepted: 3 October 2017
© The Author(s) 2017. This article is an open access publication
follow-up in women (7.7, 4.8–11.2 μg/mL; p < 0.001), but not in men. In the multiple regression analysis, high-density lipoprotein cholesterol levels and body weight were inde- pendent predictors of HMW adiponectin levels. The rate of change in HMW adiponectin levels was inversely correlated with the rates of change in body weight, body mass index, and knee leg extension strengths, and positively correlated with rates of change in high-density lipoprotein cholesterol and one-leg standing time. There were no significant differ- ences in HMW adiponectin levels among SNPs.
Discussion Decreasing HMW adiponectin levels might lead to an increased risk of cardiovascular diseases in elderly women.
Conclusion HMW adiponectin levels significantly decreased over a 5-year period in community-dwelling elderly Japanese women.
Keywords Body weight · High-molecular-weight adiponectin · Prospective study · Muscle strength
Introduction
Adiponectin is an adipose tissue-derived specific protein encoded by the adiponectin gene (ADIPOQ) located on chromosome 3q27 in a region identified as a susceptibility locus for metabolic syndrome [1]. Serum levels of adiponec- tin have been associated with glucose intolerance, diabetes mellitus, and cardiovascular diseases (CVD) [2, 3]. Common single-nucleotide polymorphisms (SNPs) at the ADIPOQ locus (SNP + 45T/G and SNP + 276G/T) have also been associated with low adiponectin levels, insulin resistance, and diabetes mellitus in a Japanese population [4].
Several studies have demonstrated that serum total adiponectin levels increase with age [5, 6]. Moreover, Abstract
Background Serum adiponectin levels are associated with frailty and cardiovascular diseases. Longitudinal changes in adiponectin levels might enhance our understanding of age- related conditions and diseases.
Aims This prospective observational study aimed to: (1) elucidate age-related changes in high-molecular-weight (HMW) adiponectin levels; and (2) identify variables pre- dictive of elevated HMW adiponectin levels and the associa- tion with well-known adiponectin single-nucleotide poly- morphisms (SNPs) in healthy, elderly Japanese participants.
Methods Healthy elderly volunteers (n = 196; 55 men and 141 women; median age 72.0 years; range 69.0–75.0 years) underwent anthropometric and physical function measure- ments, as well as laboratory tests at baseline and the 5-year follow-up.
Results HMW adiponectin levels were significantly higher in women than in men (8.4, 5.3–11.9 vs. 5.7, 3.1–9.0 μg/
mL; p < 0.001) at baseline and decreased significantly at
Hiromasa Otsuka and Mitsuru Yanai equally contributed.
* Mitsuru Yanai
1 Division of General Medicine, Department of Internal Medicine, Nihon University School of Medicine, Oyaguchikamimachi 30-1, Itabashi-ku, Tokyo, Japan
2 Division of Nephrology, Hypertension and Endocrinology, Department of Internal Medicine, Nihon University School of Medicine, Tokyo, Japan
3 Department of Nursing, School of Health and Social Services, Saitama Prefectural University, Tokyo, Japan
4 Division of Cell Regeneration and Transplantation, Department of Functional Morphology, Nihon University School of Medicine, Tokyo, Japan
1 3
cross-sectional studies have reported higher circulating total adiponectin levels in older adults compared to those in younger adults [7]. Conversely, in a recent analysis of older Korean adults, age was associated with total adiponectin levels in males but not females [8], suggesting the sex-asso- ciated differences. According to these reports, age and sex should be considered in the evaluation of plasma adiponec- tin levels. Although serum adiponectin levels are associated with the incidence of physical disability, CVD, and mor- tality in the elderly [3, 9], the association between serum adiponectin levels and healthy elderly individuals is yet to be reported. Therefore, longitudinal changes in adiponectin levels may be useful to understand healthy aging and age- related diseases and/or conditions. However, no studies to date have prospectively evaluated the changes in adiponectin levels and the related genetic impact over time in a healthy elderly population.
To this end, we conducted a prospective observational study to assess whether high-molecular-weight (HMW) adi- ponectin levels changed over a period of 5 years in elderly Japanese individuals. We identified variables predictive of elevated HMW adiponectin levels and investigated the asso- ciation between plasma HMW adiponectin levels and SNPs in ADIPOQ.
Methods Study design
The Ogano study is an ongoing prospective observational study initiated in 2004 as an investigation of longevity in healthy adults in Ogano-machi, a town of approximately 12,000 residents located in the Saitama Prefecture in Japan.
The recruitment of healthy volunteers was conducted using pamphlets annually disseminated throughout the city. Annual participant evaluations were conducted at the Ogano assembly hall and included standardized question- naires, anthropometric measurements, as well as physical function and laboratory tests, including the collection of blood samples for the measurement of HMW adiponectin levels. We conducted health assessment interviews for all participants. Participants who had mobility limitations, severe health conditions, or injuries within 3 months before the study and those with motor dysfunctions, mental disor- ders, or cognitive impairments, were excluded. By 2008, 718 residents (men n = 244; women n = 474) had participated in the original study. We sent postal mail to recruit participants for whom 5 years had passed since the first study visit to perform follow-up evaluations. By 2013, 222 of the original 718 participants (30.9%) had been followed up for 5 years.
We conducted the same health assessments at the follow-up.
We used the participants who were followed up to evaluate
changes in HMW adiponectin levels in the elderly. The par- ticipants who were followed up were excluded because their age was < 65 years, and 26 participants were excluded for being < 65 years old. Finally, 196 participants (men n = 55;
women n = 141) were enrolled and analyzed in the current study.
Data collection
The participants were asked to answer a standard question- naire regarding their current smoking status, regular exer- cise habits, medical history (treatment for hypertension and diabetes mellitus), and family history. Questions were asked face-to-face by trained interviewers to ensure the qual- ity and accuracy of the answers. Height and body weight measurements were conducted with the participants wear- ing light clothing and no shoes. Body mass index (BMI) was calculated using the following formula: weight (kg)/
height (m
2). Waist circumference was defined as the small- est girth midway between the lowest rib and the iliac crest at the end of normal expiration. To stabilize blood pressure in a seated position, the participants rested for 5 min before their blood pressure was measured twice from the right arm with a standard mercury sphygmomanometer, and the mean of these two measurements was recorded as the blood pres- sure value.
Measures of physical function
Physical function measurements included hand grip strength, knee extension strength, and one-leg standing time.
Participants were guided by trained instructors before each examination to learn the procedures. Hand grip strength was measured for each hand with a dynamometer adjusted to fit the participant’s hand size, and the test was performed in a standing position. Knee extension strength was measured in two maximum knee extension efforts against a bilaterally positioned force sensor while the participant was seated. The one-leg standing time was measured using a stopwatch, for both legs and with eyes open. These measurements were performed once, and the means of each recorded value were used for the analyses of hand grip strength and knee exten- sion strength. The better time was used for the analyses of one-leg standing time, unless the participants performed the test incorrectly.
HMW adiponectin, biochemical marker, and bone mineral density measurements
•
Blood samples were obtained from all participants from
the cubital vein while non-fasting and at rest and stored
at −80 °C until the analysis. Measured laboratory param-
eters included serum HMW adiponectin, serum total cholesterol levels, and serum high-density lipoprotein (HDL) cholesterol levels. HMW adiponectin levels were determined via a chemiluminescent enzyme immunoas- say using a Lumipulse
®ƒ analyzer (Fujirebio, Tokyo, Japan). Intra-assay and inter-assay coefficients of varia- tion were 5.2–6.9 and 2.8–4.5%, respectively [10]. The total cholesterol was measured using a cholesterol ester hydrolase–cholesterol dehydrogenase-ultraviolet method [11]. The direct measurements of HDL cholesterol [12]
was conducted at a central laboratory (SRL Inc., Tokyo, Japan). Non-HDL cholesterol levels were expressed as the total cholesterol levels minus HDL cholesterol lev- els. Bone mineral density was determined at the calca- neus with a pulse-echo ultrasound method using a bone density measuring instrument (CM-100, Canon Lifecare Solutions Inc., Osaka, Japan).
Single-nucleotide polymorphism analysis
Genomic DNA was extracted from peripheral blood leu- kocytes via the phenol–chloroform method [13]. Genotyp- ing was performed using the TaqMan
®SNP genotyping assay (Applied Biosystems, Foster City, CA, USA) [14].
Three ADIPOQ SNPs, namely + 276G/T (rs1501299) and + 349A/G (rs2241767) in an intron and + 45T/G (rs2241766) in an exon, were selected after careful review of the literature, and were included in the current study based on their significant association with serum adiponectin lev- els [4].
The TaqMan
®SNP genotyping assays used were C_7497299_10 (rs1501299), C_26426076_10 (rs2241767), and C_26426077_10 (rs2241766). PCR amplification was performed with a 5 μL final reaction volume containing 2.5 μL TaqMan
®universal master mix, 2 ng DNA, 2.375 μL ultrapure water, 0.079 μL Tris–EDTA buffer (1 ×), and 0.046 μL TaqMan
®SNP genotyping assay mix (40 ×) con- taining the primers (final concentration 331.2 nmol/L) and probes (final concentration 73.6 nmol/L). Thermal cycling was performed using the GeneAmp 7700 system (Applied Biosystems, Foster City, CA, USA) under the following con- ditions: 50 cycles of 50 °C for 2 min and 95 °C for 10 min and 50 cycles of 95 °C for 15 s and 60 °C for 1 min. Each 96-well plate contained 80 DNA samples of an unknown genotype and four reaction mixtures containing reagents without DNA as controls, which were a necessary part of the 7700-signal processing system, as outlined in the TaqMan
®Allelic Discrimination Getting Started Guide (Applied Bio- systems, Foster City, CA, USA). The plates were read on an ABI Prism 7700 sequence detection system in endpoint analysis mode (version 1.6.3; Applied Biosystems, Foster City, CA, USA). Genotypes were determined visually based
on the dye component fluorescent emission data depicted on X–Y scatter plots by the sequence detection system soft- ware. Genotypes were also determined automatically by the software’s signal processing algorithms. The results of each scoring method were saved in separate output files for sub- sequent comparisons [15].
Statistical analysis
All statistical analyses were performed using SPSS ver- sion 22.0 for Windows (SPSS, Japan Inc., Tokyo, Japan).
Continuous variables were expressed as the mean ± stand- ard deviation or median (25th–75th percentile), for normal and non-normal distributions, respectively. Categorical data were expressed as percentages, and χ
2or Fisher’s exact tests were used to compare men and women. The distribution of variables was tested using the Kolmogorov–Smirnov test, and differences in the continuous variables between the first and 5-year follow-up visits were analyzed using paired Student’s t tests or paired Wilcoxon signed-rank tests.
Baseline values and rates of change for all variables were assessed to determine their association with serum HMW adiponectin levels using the univariate correlation test and Spearman’s rank correlation coefficient (r
s). Moreover, a multiple regression analysis was performed using the step- wise method to determine independent predictors of serum HMW adiponectin levels. HMW adiponectin levels were natural logarithm transformation. We adjusted for age, sex, body weight, waist circumference, hand grip strength, knee extension strength, one-leg standing time, bone mineral den- sity, HDL cholesterol, and history of diabetes mellitus. We also analyzed the rate of change in the HMW adiponectin levels using a multiple regression analysis. Moreover, all analyses were performed separately for each sex, and the differences between men and women were analyzed using a Mann–Whitney U test. Differences in the serum HMW adiponectin levels among the ADIPOQ SNPs were evaluated via a Kruskal–Wallis H test. The consistency of genotype distribution with the Hardy–Weinberg equilibrium was cal- culated using a χ
2test. All tests were two-tailed, and p values of less than 0.05 were considered statistically significant.
Results
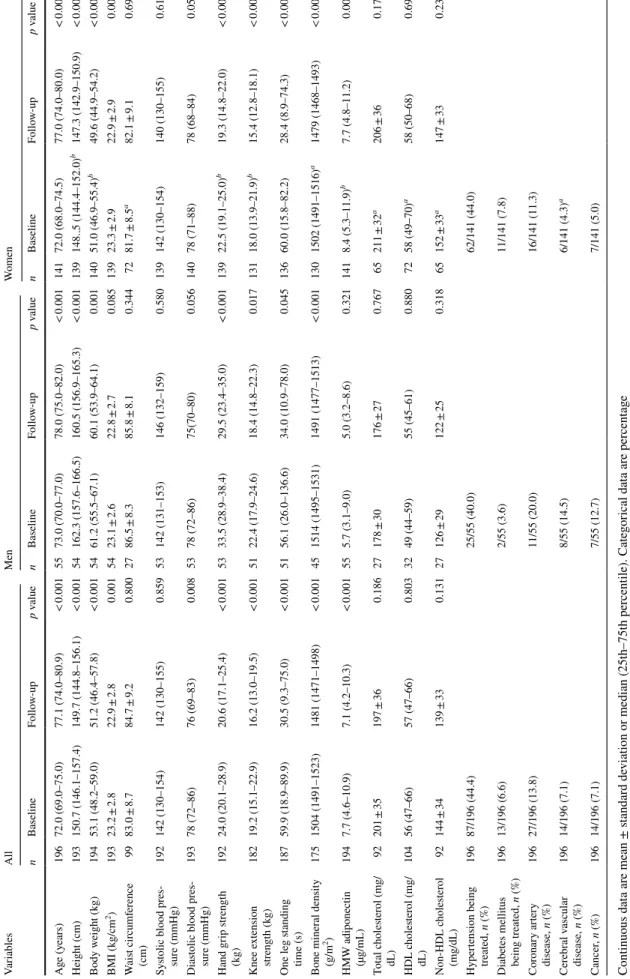
Table 1 presents the baseline and follow-up characteristics
of all participants, as well as those for men and women
separately. The proportion of current smokers and regu-
lar exerciser comprised 10 and 15.9% of the participants,
respectively. Among all participants, the median HMW
adiponectin and bone mineral density values, as well as all
measured physical functions were significantly decreased
at the 5-year follow-up. Height, body weight, and BMI
1 3
Table 1 Baseline and 5-year follow-up characteristics of the study subjects Continuous data are mean ± standard deviation or median (25th–75th percentile). Categorical data are percentage BMI body mass index, HMW high-molecular-weight, HDL high-density lipoprotein a p < 0.05 men vs. women at baseline bp < 0.001 men vs. women at baseline
VariablesAllMenWomen nBaselineFollow-upp valuenBaselineFollow-upp valuenBaselineFollow-upp value Age (years)19672.0 (69.0–75.0)77.1 (74.0–80.9)< 0.0015573.0 (70.0–77.0)78.0 (75.0–82.0)< 0.00114172.0 (68.0–74.5)77.0 (74.0–80.0)< 0.001 Height (cm)193150.7 (146.1–157.4)149.7 (144.8–156.1)< 0.00154162.3 (157.6–166.5)160.5 (156.9–165.3)< 0.001139148..5 (144.4–152.0)b147.3 (142.9–150.9)< 0.001 Body weight (kg)19453.1 (48.2–59.0)51.2 (46.4–57.8)< 0.0015461.2 (55.5–67.1)60.1 (53.9–64.1)0.00114051.0 (46.9–55.4)b49.6 (44.9–54.2)< 0.001 BMI (kg/cm2)19323.2 ± 2.822.9 ± 2.80.0015423.1 ± 2.622.8 ± 2.70.08513923.3 ± 2.922.9 ± 2.90.007 Waist circumference (cm)9983.0 ± 8.784.7 ± 9.20.8002786.5 ± 8.385.8 ± 8.10.3447281.7 ± 8.5a82.1 ± 9.10.691 Systolic blood pres- sure (mmHg)192142 (130–154)142 (130–155)0.85953142 (131–153)146 (132–159)0.580139142 (130–154)140 (130–155)0.610 Diastolic blood pres- sure (mmHg)19378 (72–86)76 (69–83)0.0085378 (72–86)75(70–80)0.05614078 (71–88)78 (68–84)0.053 Hand grip strength (kg)19224.0 (20.1–28.9)20.6 (17.1–25.4)< 0.0015333.5 (28.9–38.4)29.5 (23.4–35.0)< 0.00113922.5 (19.1–25.0)b19.3 (14.8–22.0)< 0.001 Knee extension strength (kg)18219.2 (15.1–22.9)16.2 (13.0–19.5)< 0.0015122.4 (17.9–24.6)18.4 (14.8–22.3)0.01713118.0 (13.9–21.9)b15.4 (12.8–18.1)< 0.001 One leg standing time (s)18759.9 (18.9–89.9)30.5 (9.3–75.0)< 0.0015156.1 (26.0–136.6)34.0 (10.9–78.0)0.04513660.0 (15.8–82.2)28.4 (8.9–74.3)< 0.001 Bone mineral density (g/m2)1751504 (1491–1523)1481 (1471–1498)< 0.001451514 (1495–1531)1491 (1477–1513)< 0.0011301502 (1491–1516)a1479 (1468–1493)< 0.001 HMW adiponectin (µg/mL)1947.7 (4.6–10.9)7.1 (4.2–10.3)< 0.001555.7 (3.1–9.0)5.0 (3.2–8.6)0.3211418.4 (5.3–11.9)b7.7 (4.8–11.2)0.001 Total cholesterol (mg/ dL)92201 ± 35197 ± 360.18627178 ± 30176 ± 270.76765211 ± 32a206 ± 360.173 HDL cholesterol (mg/ dL)10456 (47–66)57 (47–66)0.8033249 (44–59)55 (45–61)0.8807258 (49–70)a58 (50–68)0.699 Non-HDL cholesterol (mg/dL)92144 ± 34139 ± 330.13127126 ± 29122 ± 250.31865152 ± 33a147 ± 330.238 Hypertension being treated, n (%)19687/196 (44.4)25/55 (40.0)62/141 (44.0) Diabetes mellitus being treated, n (%)19613/196 (6.6)2/55 (3.6)11/141 (7.8) Coronary artery disease, n (%)19627/196 (13.8)11/55 (20.0)16/141 (11.3) Cerebral vascular disease, n (%)19614/196 (7.1)8/55 (14.5)6/141 (4.3)a Cancer, n (%)19614/196 (7.1)7/55 (12.7)7/141 (5.0)
were also significantly decreased for all participants. In contrast, there was no significant change in the mean waist circumference and non-HDL cholesterol levels. HMW adi- ponectin levels at baseline were inversely correlated with height (r
s= − 0.291; p < 0.001), body weight (r
s= − 0.338;
p < 0.001), BMI (r
s= − 0.190; p = 0.008), hand grip strength (r
s= − 0.234; p = 0.001), and knee extension strength (r
s= − 0.177; p = 0.014). Conversely, HDL cholesterol levels were positively correlated with baseline HMW adiponectin levels (r
s= 0.400; p < 0.001).
At baseline, the men and women significantly differed regarding several parameters, including height, body weight, waist circumference, hand grip strength, knee extension strength, bone mineral density, HMW adiponectin levels, total cholesterol levels, HDL cholesterol levels, non-HDL cholesterol levels, and cerebral vascular disease. At the 5-year follow-up, serum HMW adiponectin levels were sig- nificantly decreased in the women but not in men. Both men and women exhibited decreased height and body weight, and similar decreases in hand grip and knee extension strength were observed for both sexes at the 5-year follow-up. In contrast, the waist circumference and non-HDL cholesterol levels did not change. Furthermore, the rate of change in the HMW adiponectin levels in women was significantly inversely correlated with the rates of change in body weight (r
s= − 0.334; p < 0.001), BMI (r
s= − 0.295; p < 0.001), and knee extension strength (r
s= − 0.187; p = 0.032). Con- versely, the rates of change in HMW adiponectin levels were positively correlated with the rates of change for the one- leg standing time and HDL cholesterol (r
s= 0.231; p < 0.007 and r
s= 0.273; p = 0.021, respectively). None of the exam- ined variables were significantly correlated with the rate of change in the HMW adiponectin levels in men.
The multiple regression analysis revealed HDL choles- terol and body weight as independent predictors of serum HMW adiponectin levels (Table 2). Additionally, the rate of change in HMW adiponectin levels was significantly inversely correlated with rates of change in body weight (r
s= − 0.292; p < 0.001), BMI (r
s= − 0.267; p < 0.001) and knee extension strength (r
s= − 0.183; p = 0.014). In contrast,
the rate of change in HMW adiponectin levels was signifi- cantly positively correlated with the rates of change for the one-leg standing time (r
s= 0.220; p = 0.003) and HDL cho- lesterol (r
s= 0.205; p = 0.037). In the multiple linear regres- sion analysis, rates of change in body weight and HDL cho- lesterol were independent predictors of the rate of change in HMW adiponectin levels.
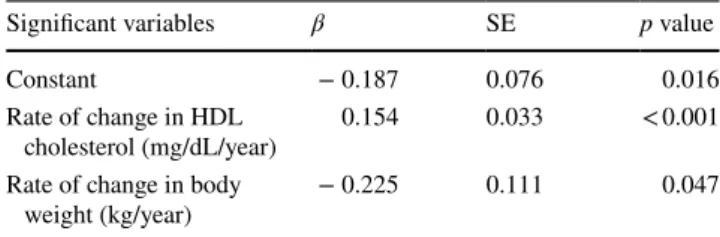
Table 3 presents the rates of change in body weight and HDL cholesterol as independent predictors of the rate of change for HMW adiponectin levels in women. In contrast, no independent variables were found to be predictive of the rate of change in HMW adiponectin levels in men.
Table 4 displays the difference in HMW adiponectin levels among SNPs. At baseline, no significant differences were noted in the SNPs. Men and women were also analyzed separately, and the dominant and recessive model, as well as the allelic models were evaluated. However, the results revealed no significant association in any of the SNPs at baseline (data not shown). At the 5-year follow-up, HMW adiponectin levels among SNPs (Table 4) did not differ sig- nificantly, and the same findings were obtained in the domi- nant, recessive, and allelic models (data not shown).
Discussion
In this study, we determined that the HMW adiponectin levels were significantly decreased in women but not men during the 5-year follow-up period, and body weight and HDL cholesterol as predictors of HMW adiponectin levels.
Previous studies have also reported that body weight and HDL cholesterol were correlated with adiponectin levels, consistent with our results [5, 16]. However, longitudinal HMW adiponectin levels were significantly lower, despite the decreased body weight and inverse correlation between body weight and change in HMW adiponectin levels. The proportion of body weight reduction observed in this study was low compared to that observed in other studies. There- fore, a reduction in body weight might have had a weak
Table 2 Multiple regression analysis for log-transformed high- molecular-weight adiponectin at baseline (n = 196)
Independent variables = age, sex, body weight, waist circumference, hand grip strength, knee extension strength, one-leg standing time, bone mineral density, HDL cholesterol, and medical history of dia- betes mellitus
HDL high-density lipoprotein
Significant variable β SE p value
Constant 2.237 0.626 0.001
Body weight (kg) − 0.017 0.008 0.037
HDL cholesterol (mg/dL) 0.011 0.005 0.044
Table 3 Multiple regression analysis for the rate of change in high- molecular-weight adiponectin in women (n = 141)
Independent variables = rates of change in body weight, knee exten- sion strength, HDL cholesterol, and medical history of diabetes mel- litus
HDL high-density lipoprotein
Significant variables β SE p value
Constant − 0.187 0.076 0.016
Rate of change in HDL
cholesterol (mg/dL/year) 0.154 0.033 < 0.001 Rate of change in body
weight (kg/year) − 0.225 0.111 0.047
1 3
effect of the HMW adiponectin levels in the current study.
Since body weight reduction in healthy elderly individu- als is low, it might be unrelated to longitudinal changes in adiponectin levels.
The proportion of HMW adiponectin to total adiponec- tin varies by age [17] and sex [18], with women exhibiting higher proportions of HMW adiponectin than that in men, as found in the present study. A reduction in HMW adiponectin levels was observed in women but not men at the 5-year follow-up in the current study. The failure of the decrease in HMW adiponectin levels to reach statistical significance among men might be partially due to the small number of male participants included in the study.
Waist circumference was found to be an independent pre- dictor of visceral fat [19]. In addition, a decrease in muscle mass was shown to be associated with a decrease in muscle strength [20]. In the present study, waist circumference was unchanged at the follow-up; whereas muscle strength had decreased. These results might reflect an increase in visceral or intramuscular fat compared with the levels at baseline.
Moreover, HMW adiponectin levels were recently shown to be inversely correlated with visceral fat mass [21]. We speculate that the longitudinal changes in HMW adiponectin levels observed in the women from the current study were associated with a gain in visceral and/or intramuscular fat mass rather than any changes in bodyweight.
Although the cause of the longitudinal reduction in female HMW adiponectin levels observed in the current study is unclear, such reduction might be associated with an increased risk of CVD in elderly post-menopausal women [22] because there was a low proportion of healthy elderly that were current smokers, the levels of non-HDL choles- terol remained unchanged, and adiponectin levels are asso- ciated with endothelial dysfunction [23]. Future studies are
necessary to elucidate the clinical significance and mecha- nism by which HMW adiponectin levels were reduced in elderly women.
Recent studies have revealed the presence of an inverse relationship between the total adiponectin levels and muscle strength in Japanese females [24]. Such findings contradict our current findings, demonstrating that both HMW adi- ponectin levels and knee extension strength decreased at the 5-year follow-up in women. The discrepancy in the relation- ship between adiponectin levels and muscle strength might be due to the women in previous studies being younger than those in our study by as much as 20 years. Distinct mecha- nisms might affect the relationship between adiponectin levels and muscle strength during different stages of life.
Kizer et al. observed that the total adiponectin levels were inversely correlated with body weight in the univariate and multivariate analyses and demonstrated that the total adi- ponectin levels increased with age [5]. Although a reduction in physical ability with age was also observed in that study (consistent with the results of the current study), HMW adi- ponectin levels were decreased in the current study. Kizer et al. study observed that approximately one-third of the participants developed new difficulties with activities of daily living during the follow-up period; however, our study sample consisted of healthy elderly participants who lived independently. Therefore, this discrepancy might have been due to a difference in adiponectin levels, since the plasma adiponectin levels were positively correlated with the sever- ity of frailty [25]. Therefore, changing adiponectin levels might be used to distinguish frail from the healthy elderly.
We also determined that the ADIPOQ SNPs included in the current study were not associated with the longitudinal HMW adiponectin levels. Most genetic studies to date have observed associations between certain ADIPOQ SNPs and
Table 4 High-molecular weight adiponectin levels at baseline and 5-year follow-up for adiponectin single-nucleotide polymorphisms (SNPs)
Data are median (25th–75th percentile)
MAF minor allele frequency, HWE Hardy–Weinberg equilibrium
Variants n = 196 Baseline p value Follow-up p value Minor allele MAF HWE (p value)
+ 276G/T (rs1501299) T 0.186 0.504
GG 123 7.0 (3.9–10.7) 0.115 6.2 (3.8–10.3) 0.396
GT 61 8.1 (5.5–11.2) 7.5 (5.4–10.1)
TT 12 9.2 (7.2–12.0) 8.1 (4.7–11.6)
+ 349A/G (rs2241767) G 0.319 0.535
AA 71 7.2 (4.3–10.3) 0.443 6.6 (4.0–8.9) 0.195
AG 100 8.3 (4.9–11.2) 7.5 (4.3–11.0)
GG 25 6.7 (4.2–12.0) 7.3 (4.1–11.9)
+ 45T/G (rs2241766) T 0.314 0.782
TT 26 7.0 (4.5–12.0) 0.574 7.7 (4.2–11.9) 0.181
TG 97 8.1 (4.7–11.6) 7.4 (4.3–11.2)
GG 73 7.6 (4.5–10.4) 6.6 (4.0–8.9)
the total adiponectin levels [4]. Here, we investigated the longitudinal association between HMW adiponectin con- centrations and SNPs; however, we could not demonstrate any correlation between these two factors. Thus, in con- trast to the total adiponectin levels, the longitudinal HMW adiponectin levels might be affected to a greater extent by pathophysiological and environmental determinants, (e.g., sex hormone levels [26] and diet [27]) than by genetic factors.
The present study had several limitations. First, we did not measure the total adiponectin levels. Therefore, we could not compare our findings regarding HMW adiponectin levels to those previously published on total adiponectin levels, nor could we examine the potential longitudinal associa- tion between the two forms of adiponectin. However, the total and HMW adiponectin have similar utilities in terms of assessing the adiponectin levels in the blood [28]. There- fore, the HMW adiponectin levels can act as a proxy for the total adiponectin levels. Second, we could not measure the fasting plasma glucose or glycosylated hemoglobin levels at baseline or follow-up. Therefore, we could not adjust our results for the presence of potential confounders, such as glucose intolerance or pre-diabetes. However, after reana- lyzing the data following the exclusion of participants with diabetes mellitus at baseline, longitudinal HMW adiponectin levels remained significantly decreased in all participants and in only women. This finding indicates that the small percentage of participants with diabetes mellitus did not significantly affect the results. Third, information regarding cholesterol-lowering medication taken by the participants was not recorded; thus, the use of these medications may have confounded our findings. However, notwithstanding these limitations, our results which demonstrate HMW adiponectin levels significantly decreased longitudinally, despite being correlated with body weight and HDL choles- terol, are significant and novel.
Conclusion
Therefore, the plasma HMW adiponectin levels were lon- gitudinally and significantly decreased in elderly Japanese women. These findings may indicate an increased risk of CVD in elderly women. Further studies are necessary to determine the underlying mechanisms of age- and sex- related changes in adiponectin levels and their association with CVD and frailty in elderly populations.
Compliance with ethical standards
Funding This work was partially supported by a grant from the Stra- tegic Research Base Development Program for Private Universities, subsidized by the Ministry of Education, Culture, Sports, Science and
Technology (MEXT) in Japan (2011), and by a generous donation from Saitama Prefectural University.
Conflicts of interest statement The authors declare no conflict of interest.
Statement of human participants and/or animals All procedures performed in studies involving human participants were in accordance with the ethical standards of the Research Committee of Nihon Uni- versity School of Medicine and with the 1964 Helsinki declaration and its later amendments or comparable ethical standards.
Informed consent Written informed consent was obtained from all individual participants included in the study.
Open Access This article is distributed under the terms of the Creative Commons Attribution 4.0 International License (http://crea- tivecommons.org/licenses/by/4.0/), which permits unrestricted use, distribution, and reproduction in any medium, provided you give appro- priate credit to the original author(s) and the source, provide a link to the Creative Commons license, and indicate if changes were made.
References
1. Kissebah AH, Sonnenberg GE, Myklebust J et al (2000) Quan- titative trait loci on chromosomes 3 and 17 influence pheno- types of the metabolic syndrome. Proc Natl Acad Sci USA 97:14478–14483
2. Weyer C, Funahashi T, Tanaka S et al (2001) Hypoadiponectine- mia in obesity and type 2 diabetes: close association with insu- lin resistance and hyperinsulinemia. J Clin Endocrinol Metab 86:1930–1935
3. Dekker JM, Funahashi T, Nijpels G et al (2008) Prognostic value of adiponectin for cardiovascular disease and mortality. J Clin Endocrinol Metab 93:1489–1496
4. Hara K, Boutin P, Mori Y et al (2002) Genetic variation in the gene encoding adiponectin is associated with an increased risk of type 2 diabetes in the Japanese population. Diabetes 51:536–540 5. Kizer JR, Arnold AM, Strotmeyer ES et al (2010) Change in
circulating adiponectin in advanced old age: determinants and impact on physical function and mortality. The Cardiovascular Health Study All Stars Study. J Gerontol A Biol Sci Med Sci 65:1208–1214
6. Cnop M, Havel PJ, Utzschneider KM et al (2003) Relationship of adiponectin to body fat distribution, insulin sensitivity and plasma lipoproteins: evidence for independent roles of age and sex. Dia- betologia 46:459–469
7. Isobe T, Saitoh S, Takagi S et al (2005) Influence of gender, age and renal function on plasma adiponectin level: the Tanno and Sobetsu study. Eur J Endocrinol 153:91–98
8. Song HJ, Oh S, Quan S et al (2014) Gender differences in adi- ponectin levels and body composition in older adults: Hallym aging study. BMC Geriatr 14:8
9. Hozawa A, Sugawara Y, Tomata Y et al (2012) Relationship between serum adiponectin levels and disability-free survival among community-dwelling elderly individuals: the Tsurugaya project. J Gerontol A Biol Sci Med Sci 67:530–536
10. Oritsu M, Komatsu J, Hiyoshi T (2009) Fundamental evaluation of high molecular weight adiponectin by chemiluminescent enzyme immunoassay using Lumipulse and Lumipulse Presto II. Med Pharm 62:891–898 (Japanese)
1 3
11. Sakurai T (1998) Fundamental study on measurement of total cholesterol by ultraviolet-end (UV-End) method using cholesterol dehydrogenase (CDH). Jpn J Med Technol 47:747–752 (Japanese) 12. Nakai T, Ito K, Sekine K (1995) The basic study of Cholestest N
HDL, HDL cholesterol measurement reagent, and the measure- ment of specific samples. Jpn J Clin Med 53:617–622 (Japanese) 13. Nakayama T, Soma M, Rahmutula D (2001) Isolation of the
5′-flanking region of genes by thermal asymmetric interlaced polymerase chain reaction. Med Sci Monit 7:345–349
14. Sano M, Kuroi N, Nakayama T et al (2005) Association study of calcitonin-receptor-like receptor gene in essential hypertension.
Am J Hypertens 18:403–408
15. Livak KJ, Marmaro J, Todd JA (1995) Towards fully automated genome-wide polymorphism screening. Nat Genet 9:341–342 16. Yamamoto Y, Hirose H, Saito I et al (2002) Correlation of the
adipocyte-derived protein adiponectin with insulin resistance index and serum high-density lipoprotein-cholesterol, independent of body mass index, in the Japanese population. Clin Sci (Lond) 103:137–142
17. Kato K, Osawa H, Ochi M et al (2008) Serum total and high molecular weight adiponectin levels are correlated with the sever- ity of diabetic retinopathy and nephropathy. Clin Endocrinol (Oxf) 68:442–449
18. Pajvani UB, Hawkins M, Combs TP et al (2004) Complex dis- tribution, not absolute amount of adiponectin, correlates with thiazolidinedione-mediated improvement in insulin sensitivity. J Biol Chem 279:12152–12162
19. Janssen I, Heymsfield SB, Allison DB et al (2002) Body mass index and waist circumference independently contribute to the prediction of nonabdominal, abdominal subcutaneous, and vis- ceral fat. Am J Clin Nutr 75:683–688
20. Goodpaster BH, Park SW, Harris TB et al (2006) The loss of skeletal muscle strength, mass, and quality in older adults: the health, aging and body composition study. J Gerontol A Biol Sci Med Sci 61:1059–1064
21. Kelly KR, Navaneethan SD, Solomon TP et al (2014) Lifestyle- induced decrease in fat mass improves adiponectin secretion in obese adults. Med Sci Sports Exerc 46:920–926
22. Kannel WB, Hjortland MC, McNamara PM et al (1976) Meno- paused and risk of cardiovascular disease: the Framingham study.
Ann Internal Med 85:447–452
23. Shimabukuro M, Higa N, Asahi T et al (2003) Hypoadiponectine- mia is closely linked to endothelial dysfunction in man. J Clin Endocrinol Metab 88:3236–3240
24. Huang C, Niu K, Momma H et al (2014) Inverse association between circulating adiponectin levels and skeletal muscle strength in Japanese men and women. Nutr Metab Cardiovasc Dis 24:42–49
25. Tsai JS, Wu CH, Chen SC et al (2013) Plasma adiponectin lev- els correlate positively with an increasing number of compo- nents of frailty in male elders. PLoS One. doi:10.1371/journal.
pone.0056250
26. Miyatani Y, Yasui T, Uemura H et al (2008) Associations of cir- culating adiponectin with estradiol and monocyte chemotactic protein-1 in postmenopausal women. Menopause 15:536–541 27. Chen JH, Ouyang C, Ding Q et al (2015) A moderate low-carbo-
hydrate low-calorie diet improves lipid profile, insulin sensitivity and adiponectin expression in rats. Nutrients 7:4724–4738 28. Van Andel M, Drent ML, Van Herwaarden AE et al (2017) A
method comparison of total and HMW adiponectin: HMW/total adiponectin ratio varies versus total adiponectin, independent of clinical condition. Clin Chim Acta 465:30–33