MONGOLIA’s Pre-1990 ECONOMY:
An Extended Overview
ENKHBAYAR Shagdar
Senior Research Fellow, Research Division, ERINA
March 2020
Niigata, Japan
ECONOMIC RESEARCH INSTITUTE FOR NORTHEAST ASIA
ERINA Discussion Paper No.2002
1
MONGOLIA’s Pre‐1990 ECONOMY: An Extended Overview Enkhbayar Shagdar
Senior Research Fellow, Research Division, ERINA Abstract
Mongolia, the second socialist country in the world, pursued non-capitalist and socialist paths of development and practiced a centrally planned economic system under the rule of one political party up to 1990. During this course, Mongolia was successful in transforming from a poor, pastoral livestock based agrarian economy into a dynamic, industry-driven economy. Former CMEA members were its donors and development partners, where the FSU played a dominant role.
Owing to its manufacturing industry development based on the country’s abundant livestock-origin raw materials, Mongolia could achieve relatively high and sustained economic growth. Rapidly expanding manufacturing industries and economy-wide increases in productivity drove overall improvements in the country’s living standards.
Social sectors, such as health, social security, education, culture and sports, maintained a stable share of total budget expenditure. There were no unemployment or income inequalities during this period.
However, Mongolia continued to rely on foreign sources for its investments and foreign loans as the share of primary revenues grew. Also, per capita real growth was lower than that of the overall economy. Despite population growth, population income as a share of final expenditure and household consumption share of total use decreased, whereas that of administration expenditures increased. Overall, investments into tangible assets were preferred over boosting intangible assets or human capital incentives. This situation might have triggered dissatisfaction among the population and led to the demands for change that eventually put an end to the planned economy and socialist system practiced in Mongolia for nearly 70 years.
Keywords: Mongolian economic history, Mongolian economic study, socialist systems.
JEL Codes: N15, O53, P20.
Content
1. Introduction ... 2
2 Mongolia’s Economic Development Prior to 1990 ... 4
2.1POPULATION ... 4
2.2MACRO ECONOMY ... 6
2.3SUPPLY AND USE STRUCTURES ... 13
2.4LABOR FORCE AND PRODUCTIVITY ... 16
2.5STATE BUDGET ... 19
2.6AGRICULTURAL OUTPUT ... 22
2.7INDUSTRIAL OUTPUT ... 27
2.8INVESTMENT AND FOREIGN AID ... 30
2.9FOREIGN TRADE ... 38
3. Conclusion ... 45
References ... 47
2
1. Introduction
Mongolia, being the second socialist country in the world, pursued non-capitalist (1921-1923) and socialist (1924-1989) paths of development and practiced a centrally planned economic system for almost 50 years (1941-1989), all the while power was concentrated in the hands of one political party. The victory of the people’s revolution led by the Mongolian People’s Party (MPP)1 in 1921 was a crucial turning point in the country’s recent history and its economic development course. Mongolia began transiting towards a market economy in 1990 and its first free elections were held in 1990. The first democratic constitution, approved in 1992, pronounced a multi-party parliamentary system and the country’s name was changed to Mongolia from the former Mongolian People’s Republic (MPR).
Historically, the establishment of the Great Mongolian State in 1206, 17 years after Temuujin (Chinggis Khaan) became the King of Khamag Mongols (All Mongolians) in 1189, “…put an end to the strife of Mongolian tribes and ensured favorable conditions of the nation’s formation. Opportunities were provided for further development of nomadic civilization, including the Mongolian language, culture and customs” (MONTSAME, 2008, p.23).
The Mongolian economy prior to 1921 was characterized by the feudal system, which found its origins since the early 13th century. Although concrete data on the economic development processes of the Mongolian Empire is lacking, many historical literatures note that during the periods of Mongolian Great Khans (Kings), the largest land empire in human history, conditions were favorable for the world economy to develop, especially for trade and technologies. However, after 162 years of rule, the Mongolian Empire came to end in 1368, and the so-called “Small Khans’ Period” continued to 1634, during which time 22 Khans were in power. Due to internal conflicts, various parts of Mongolia2 came under Manchu3 rule, and later in July 1755, the Manchu began to govern all of Mongolia and continued to do so until 1911. Religion (Tibetan Buddhism) was strongly encouraged during Manchurian rule to contain Mongols, with almost one-third of Mongolian adult males becoming Buddhist monks, who were limited to engage in productive labor.
Therefore, despite the fact Buddhist temples and shrines were strengthened economically, the entire economy was weakened (Boldbaatar, J and Lundeejantsan, D, 1997).
1 Founded on 1 March 1921 and was renamed as the Mongolian People’s Revolutionary Party (MPRP) in 1925;
2 Inner Mongolia in 1636, Ar (Outer) Mongolia in 1691, and Zuungar (West Mongolia) in 1755;
3 An ethnic minority in China whose predecessors established and ruled the Qing dynasty (1936- 1912);
3
As a result of continuous uprisings against foreign rule, Mongolia declared its independence on 29 December 1911 and the Bogd Khan was proclaimed as the country’s head. But with widespread instability, Chinese military commanders and White Russian soldiers were permitted to interfere in the country’s affairs from 1915 to 1921.
Influenced by the “October” Revolution under the leadership of Lenin, V.I. Ulyanov in Russia, a revolution led by the MPP was successful in 1921 with the backing of Russian communists. Mongolia established its first diplomatic relations with the Former Soviet Union (FSU) on 5 November 1921. Between 1921 and 1924, Mongolia exercised a form of theocratic state headed by the Bogd Khan, whose rights were limited to religious aspects of governing. After Bogd Khan’s death in 1924, a non-capitalist path of development was chosen, with the First Constitution proclaiming the Mongolian People’s Republic (MPR) adopted on 26 November 19244. A parliamentary system of governance was established by the First Constitution, abolishing the monarchial theocracy system.
Also, an economic advisory consul was established in 1924 under the government. The Mongolian Commercial and Industrial Bank was founded on 2 June 1924 and the national currency, Mongolian to’grog (MNT), was first issued on 9 December 1925 along with the start of financial reforms throughout the country. In 1940, the 10th Mongolian People’s Revolutionary Party (MPRP) Congress declared an end to the “democratic” stage of revolution in the country and the commencement of a socialist stage, which was practiced in the country until 1990. Despite the presence of a parliamentary system, the country’s development was led by one political party, the MPP. (MAS, 1990; Sanders, Alan J.K., 2003; Boldbaatar, J and Lundeejantsan, D, 1997).
In 1940 and 1960, the Second and Third Constitutions were adopted, taking the FSU Constitution as a model. Mongolia began to practice a centrally planned economic system in 1941, and annual economic development plans were adopted. Soon after World War II, economic development planning was shifted to a five-year planning system. More detailed annual plans based on these five-year plans were also prepared. The first five- year plan for 1948-1952 was adopted in 1947 and a total of 8 five-year plans were implemented up to 19905, except for a three-year plan spanning 1958-1960 as part of an interim plan to shift to a more convenient interval. Also, long-term development forecasts for 10- to 20-year periods were established based on these plans, titled the “General Scheme” and “Targeted Program”. These plans were carried out by the State Planning Committee, which was established in 1945. Mongolia sought to join the United Nations
4 The Constitution of 1992 proclaimed the country’s name as Mongolia;
5 i.1948-1952; ii.1953-1957 (a three-year plan: 1958-1960); iii.1961-1965; iv.1966-1970;
v.1971-1975; vi.1976-1980; vii. 1981-1985; viii. 1986-1990);
4
as early as 1946 but was not made a full-pledged member until 27th October 1961. In June of 1962, it joined the CMEA6.
Starting from the mid-1980s, the overly centralized nature of government planning began to weaken and direct state orders for the production and sales of more than 2,000 items were abolished, except for 20 export items and those considered as necessities for the population. The production and sales of the remaining products were then regulated by market demands and contracts between producers and suppliers (Namjim, 2000a). An annual fair for producers and suppliers was organized at the former Central Exhibition Hall in Ulaanbaatar.
Although various literatures and studies, including periodicals issued by multinational development banks and institutions, portray Mongolia’s economy since the transition in 1990, research on the country’s economic structure and development trends prior to then remain scarce. Thus, this paper provides an overview of Mongolia’s economic development until 1990, focusing on the planned economy period, i.e. 1940-1990. In particular, the country’s macro-economic trends, economic structure, labor force, state budget, agricultural and industrial outputs, and investment, foreign aid and foreign trade issues are analyzed. Although most of the analyses provided in this paper cover the periods of the MPR, the country’s current name – Mongolia – is used throughout.
2 Mongolia’s Economic Development Prior to 1990
2.1 Population
A research group led by Russian scholar, I.M. Maiskii, carried out the first population census in Mongolia in 1918. Records show that the total resident population in Outer Mongolia was 647,500, of which 317,300 were females, and more than 15% were Chinese or Russian nationals. As was noted by the research team, the census was incomplete.
However, after evaluating the other historical data available in the Mongolian archive, it became the country’s official baseline data (NSO, 2003a, Namjim, 2000a).
According to the National Statistical Office of Mongolia, Mongolia’s population was 636,700 in 1900 and the annual population growth rate was 0.1% - the lowest growth in the country’s recent history. Sex ratio or the number of males per 100 females averaged 104.1 until 1935. These figures were associated with high infant and maternal mortality rates during that time. As documents indicate, more than 50% of newborn babies died
6Council for Mutual Economic Assistance (Economic Union established on 5-8 January 1949 and dissolved on 28 June 1991. The member states were Bulgaria, Cuba, former Czechoslovakia, former East Germany, Hungary, Mongolia, Poland, the FSU (included 15 Republics) and Vietnam.
5
before reaching 1-year old and 13.2% of mothers died while giving birth. Population growth accelerated after the people’s revolution in 1921, along with Mongolia beginning its social-oriented path of development and the emergence of its first health care system.
According to the population census in 1935, Mongolia’s population totaled 738,200, growing at 0.8% per annum since the previous census in 1918. However, population growth slowed to 0.3% per annum thereafter due to impacts of the mass repressions carried out in the country in the late 1930s and war times (The Second World War (WWII) and conflicts at Khalkh River). Especially, the number of males failed to grow during the period of 1935-1944, and consequently, the sex ratio dropped to 95.7 in 1944. Moreover, the populations aged 18 to 45 and over 45 had decreased by 4.9% and 6.7% respectively from their levels in 1935 (NSO, 2003a, Table 2.1.1).
Table 2.1.1 Selected Indicators of Mongolia’s Population 1911-1944 Indicators Population Census Years 1944/1935
1900 1918 1935 1944 (% change) Population, 1,000 persons 636.7 647.5 738.2 759.1 2.8%
Male 324.7 330.2 370.8 371.3 0.1%
Female 312.0 317.3 367.4 387.8 5.6%
Age Groups,
% of total 0-7 N/A N/A 13.8 16.6 20.3%
8-17/18 N/A N/A 18.3 19.3 5.5%
18/19-45 N/A N/A 42.7 40.6 -4.9%
46+ N/A N/A 25.2 23.5 -6.7%
Sex Ratio (#M/100F) 104.1 104.1 100.9 95.7 -5.2%
Periods 1900-1918 1918-1935 1935-1944 Inter-census
Annual Growth, %
Both Sexes - 0.1 0.8 0.3
Male - 0.1 0.7 0.0
Female - 0.1 0.9 0.6
Source: Compiled from NSO, 2003a, 2011.
Mongolia’s population growth accelerated thereafter supported by the country’s path of social-oriented development. The population grew 0.9% per annum during the period of 1944-1956 but increased to 2.7% from 1956-1963, surpassing 1 million in 1963.
Further, population growth accelerated at 2.9% per annum from 1969-1979, and although it slightly slowed to 2.5% during 1979-1989, Mongolia’s population doubled in the 26 years between 1963 and 1989, hitting 2.044 million in 1989. Overall, the period of 1956- 1989 is regarded as Mongolia’s “baby-boom”, a time when sex ratio and age distribution
6
of the population stayed relatively stable. However, population growth slowed to 1.4%- 1.5% per annum after 1990, when the country began its transition towards a market- oriented economy (Table 2.1.2).
As a result of the baby-boom, Mongolia’s population continued to be young, and the median age was less than 19 during 1969-1989. Dependency ratio or the number of dependents per working age person was highest during this period, equaling 101.8 in 1969, when 44.4% of total population were under 15 years of age. Life expectancy at birth in 1979 was 63.02 and it had slightly increased to 63.29 by 1989. Mongolia’s urban population share rose steadily from 21.6% in 1956 to 57% in 1989, similar to the global trend (Table 2.1.2).
Table 2.1.2 Selected Indicators of Mongolia’s Population 1956-2015
Indicators Population/Population and Housing Census Years
1956 1963 1969 1979 1989 2000 2010 Population, thousand
persons 845.5 1,017 1,198 1,595 2,044 2,374 2,755
% of total
Male 49.7 49.9 49.9 50.1 49.9 49.6 49.5 Female 50.3 50.1 50.1 49.9 50.1 50.4 50.5 Urban 21.6 40.2 44.0 51.2 57.0 56.6 49.5 Rural 78.4 59.8 56.0 48.8 43.0 43.4 50.5 Age
Group,
% of total
0-4 12.6 16.8 16.6 16.5 15.9 10.4 10.6 5-14 17.8 22.3 27.8 27.7 26.0 25.4 16.7 15-64 63.4 54.7 49.6 50.8 54.1 60.8 69.0
65+ 6.2 6.3 6.0 5.0 4.0 3.5 3.7
Median age 26.7 22.8 18.6 17.5 18.8 21.6 25.8 Sex Ratio 98.8 99.8 99.5 100.4 99.7 98.5 98.1 Dependency Ratio, % 57.8 82.8 101.8 96.9 84.8 64.6 45.0 Life Expectancy N/A N/A N/A 63.02 63.29 63.76 68.05 Density per sq.km 0.65 0.77 1.02 1.31 1.52 1.7
Periods 1944-
1956 1956-
1963 1963-
1969 1969-
1979 1979-
1989 1989-
2000 2000- 2010 Inter-census annual
growth, % 0.9 2.7 2.8 2.9 2.5 1.4 1.5
Source: Compiled from NSO, 2003a, 2011.
2.2 Macro Economy
As in the former USSR (Union of Soviet Socialist Republics, further the FSU) and other CMEA (or COMECON) countries, gross social product (GSP) and net material product (NMP) were the key macroeconomic indicators for monitoring economic growth
7
of Mongolia prior to 1990. The NMP equals to the GSP net of cost of materials (NMP = GSP - Cost of Materials), representing the value-added components. The counterparts of GSP and NMP are output and GDP in the System of National Accounts (SNA). NMP was a special core indicator for development planning in former socialist bloc countries. In fact, the GDP counterpart was named “National Income” in these countries. However, it covered goods and services related to the production and distribution of only tangible goods and products, with many non-tangible services, such as housing, passenger transport, health care, education, sciences and general administration not included in NMP estimations. Therefore, in order to distinguish this indicator from the GNI (Gross National Income) in the SNA, the term NMP was introduced at international level (Khomenko, Tatiana A., 2006).
Mongolia’s GSP in 1919 was tiny, totaling MNT 300 million evaluated at constant 1986 prices, where NMP accounted for MNT 244.7 million and the cost of materials equaled MNT 55.3 million. Agriculture or pastoral livestock rearing was the foremost economic activity in 1919, accounting for 86% of the country’s total NMP (Table 2.2.1).
Table 2.2.1 NMP (at constant 1986 prices, MNT Million)
Sectors 1919 1940 1950 1960
Agriculture 210.5 421.8 522.3 846.1
Industry 0.1 38.7 54.4 200.9
Construction 0.0 4.8 11.4 160.1
Trade, Materials and Technical Supply 0.0 46.9 77.6 692.6
Transport 2.5 3.2 44.1 143.7
Communication 0.0 0.3 4.8 3.7
Other 31.6 38.3 47.9 50.0
Total 244.7 554.0 762.5 2,097.1 Source: Compiled from NSO, 2011.
Mongolia’s experienced moderate economic development until 1950, impacted by internal and global instabilities such as the Great Repressions of the 1930s in Mongolia, the worldwide Great Depression, World War II and its aftermaths. But economic growth accelerated after 1950 and the economy had increased in size more than 11-fold by 1989 in real terms on its level in 1950. Industry sector development was the major driving force behind this growth, as the share of industry increased to 34.3% of total NMP in 1989 from a mere 7.1% in 1950. Also, trade, materials and technical supply emerged as the next largest component of NMP by increasing its share to 29.5% in 1989 from 10.2% in 1950.
The transport, construction and communication sectors also experienced surges during
8
this period. As a result, the NMP share of agriculture shrank to 18.4% in 1989 from 68.5%
in 1950 (Figure 2.2.1).
Figure 2.2.1 NMP Trend and Its Composition (At constant 1986 prices)
Source: Compiled from NSO, 2011 and personal communications.
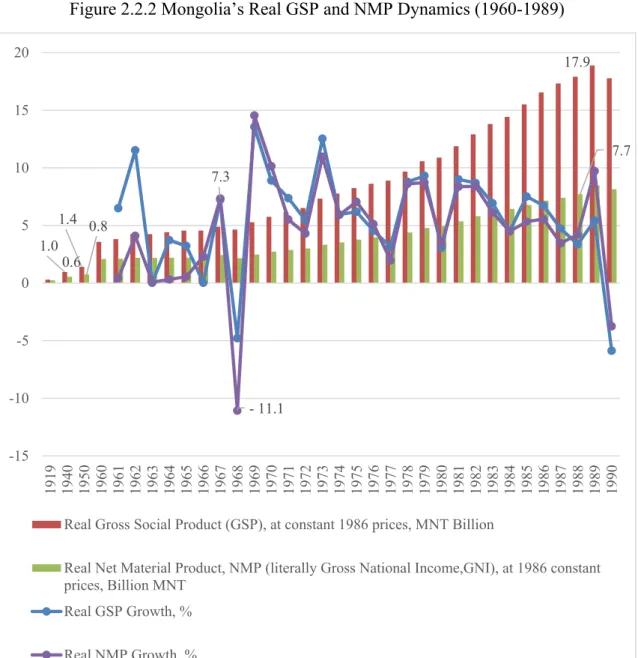
Mongolia’s economy continued to expand, except in 1968 when the country suffered from the phenomenon called “dzud”, in which massive livestock losses result from extreme weather. The country’s real gross agricultural output dropped by 23% in 1968, resulting in an 11.1% contraction of the real economy. During the dzud or so-called
“Monkey-year dzud” of 1967-1968 which continued for 165 days from 11 November 1967 to 30 March 1968, 20% of total livestock (4.4 million head) were lost. However, the following year saw economic revival and the real NMP grew by 14.5% - the highest rate ever attained prior to 1990. The NMP evaluated at constant 1986 prices equaled MNT 8.5 billion in 1989, while the real GSP was MNT 18.9 billion. These represented 13.4-fold and 11.1-fold increases from the respective values of GSP and NMP in 1950 (Figures 2.2.2; 2.2.3).
0 1,000 2,000 3,000 4,000 5,000 6,000 7,000 8,000 9,000
1919 1940 1950 1960 1970 1980 1989
MNT Million Other
Communication Transport
Trade, Materials and Technical Supply Construction Industry Agriculture
9
Figure 2.2.2 Mongolia’s Real GSP and NMP Dynamics (1960-1989)
Source: Compiled from NSO, 2011 and personal communications.
1.0 1.4
17.9
0.6 0.8
7.7 7.3
- 11.1 -15
-10 -5 0 5 10 15 20
1919 1940 1950 1960 1961 1962 1963 1964 1965 1966 1967 1968 1969 1970 1971 1972 1973 1974 1975 1976 1977 1978 1979 1980 1981 1982 1983 1984 1985 1986 1987 1988 1989 1990
Real Gross Social Product (GSP), at constant 1986 prices, MNT Billion
Real Net Material Product, NMP (literally Gross National Income,GNI), at 1986 constant prices, Billion MNT
Real GSP Growth, % Real NMP Growth, %
10
Figure 2.2.3 Gross Agricultural Output, 1967-1968 (At constant 1993 prices, MNT Million)
Source: Compiled from NSO, 1996
The period of 1970-1989 was the “golden era” of Mongolian economic development.
The compound annual growth rate of real NMP more than doubled to over 6% during the 1970s and 80s from 2.7% in the 1960s. The industry and trade sectors were the major drivers behind these growths, followed by transport and construction. On average, the industry sector was responsible for almost half (45.7%) the growth during the 1970s and 80s, while trade, materials and technical supply gave rise to 35.6% of growth over these two decades. Further, the transport and construction sectors witnessed 7.8% and 5.7%
annual growths on average respectively over the same period (Table 2.2.2 and Figure 2.2.4).
Table 2.2.2 Compound Annual Growth Rates of Mongolia’s Real NMP by Sectors, % Sectors 1961-1970 1971-1980 1981-1989 1970-1989
Real NMP 2.7 6.1 6.2 6.3
Agriculture 0.7 1.1 5.0 3.5
Industry 10.3 11.4 7.0 9.4
Construction 1.3 6.5 5.0 5.7
Trade, Materials and Technical
Supply 1.8 5.1 6.9 6.0
Transport 2.5 10.1 4.5 7.8
Communication 16.3 12.1 8.5 10.2
Other 4.3 4.6 3.0 3.3
Source: Estimated from NSO, 2011 and personal communications.
48,366.7
37,194.2
12,471.9
9,649.9 60,838.6
46,844.1
0 10,000 20,000 30,000 40,000 50,000 60,000 70,000
1967 1968
MNT Million
Livestock Crops Total
11
Figure 2.2.4 Contributions to Real NMP Growth, 1961-1989, %
Source: Compiled from NSO, 2011 and personal communications.
Along with the rapid economic growth of the 1970s and 80s, overall living standards of the population improved. Mongolia’s per capita NMP annual growth equaled 3.8% and 2.8% in real terms respectively during these periods. The highest per capita level was attained in 1988, equaling MNT 3,962 at current prices and MNT 3,873 calculated at 1986 prices, which was 3.89-fold higher on its 1950 level. However, this was much lower compared to the overall economic growth of 11-fold during the same period as the population was also growing rapidly (Figure 2.2.5).
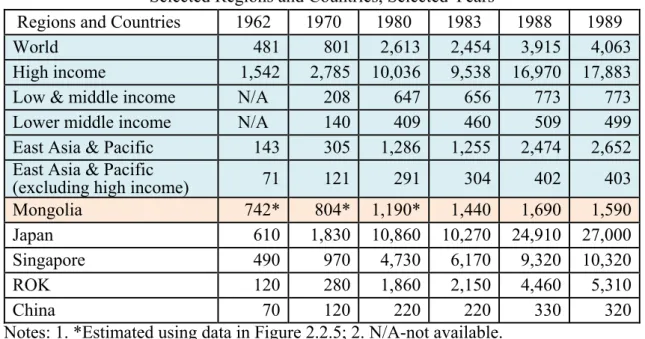
According to the World Bank Atlas method, Mongolia’s GNI per capita in 1988 was USD $1,690, placing it in the lower-middle income country group at the time, and it was the highest level attained prior to transition. Mongolia’s per capita GNI was higher than the world average and those of Japan and Singapore in 1962. Also, Mongolia’s per capita was almost 10-fold and 6-fold higher than those of China and the ROK respectively.
Although Mongolia performed much better than low and middle economies and East Asia
& Pacific, excluding high income countries, the country’s per capita growth was much slower than those observed in high income, capitalist economies. Mongolia’s per capita level had slid to the world average by 1970 and fallen behind Japan and Singapore, and the ROK by 1980. Also, the per capita income gap with China began to narrow in the 1970s as a result of China initiating reform and opening up its economy under an open- door policy in late-1978 (Figure 2.2.6).
-15 -10 -5 0 5 10 15
1961 1963 1965 1967 1969 1971 1973 1975 1977 1979 1981 1983 1985 1987 1989
% Other
Communication Transport Trade, Materials, Machinery &
EquipmentSupply Construction Industry Agriculture Real NMP Growth
12
Figure 2.2.5 Mongolia's Per Capita NMP Dynamics (1960-1989)
Source: Compiled from NSO, 2011 and personal communications.
Table 2.2.3 GNI per Capita, Atlas method (current US$), Selected Regions and Countries, Selected Years
Regions and Countries 1962 1970 1980 1983 1988 1989
World 481 801 2,613 2,454 3,915 4,063
High income 1,542 2,785 10,036 9,538 16,970 17,883 Low & middle income N/A 208 647 656 773 773
Lower middle income N/A 140 409 460 509 499
East Asia & Pacific 143 305 1,286 1,255 2,474 2,652 East Asia & Pacific
(excluding high income) 71 121 291 304 402 403
Mongolia 742* 804* 1,190* 1,440 1,690 1,590
Japan 610 1,830 10,860 10,270 24,910 27,000
Singapore 490 970 4,730 6,170 9,320 10,320
ROK 120 280 1,860 2,150 4,460 5,310
China 70 120 220 220 330 320
Notes: 1. *Estimated using data in Figure 2.2.5; 2. N/A-not available.
Source: Compiled from WB, 2020.
-20 -15 -10 -5 0 5 10 15 20
0 1,000 2,000 3,000 4,000 5,000 6,000
1940 1950 1960 1961 1962 1963 1964 1965 1966 1967 1968 1969 1970 1971 1972 1973 1974 1975 1976 1977 1978 1979 1980 1981 1982 1983 1984 1985 1986 1987 1988 1989
Per Capita NMP, at current prices, MNT (left scale) Per Capita Real NMP, at 1986 prices, MNT (left scale) Per Capita Nominal NMP growth, % (right scale) Per Capita Real NMP growth, % (right scale)
13 2.3 Supply and Use Structures
In line with the Soviet style national income account system practiced in the former socialist countries, a balance table of the production, consumption and savings of the GSP was compiled in Mongolia. Similar to the Supply-and-Use framework of the System of National Accounts SNA (System of National Accounts), this table provides information on the supply of goods and services by domestic production and imports and the use of goods and services for intermediate consumption and final use (consumption, gross capital formation and exports).
In 1965, domestically produced agricultural goods at basic prices accounted for 86.5%
of total supply and that of imports was equal to 0.4% of the total, while transport and trade margins accounted for 3.3% and 9.7% respectively. This structure did not change much over the examined periods. In terms of industrial products, a shift towards domestic production can be observed and the share of industrial products at basic prices increased to 52.1% of total supply in 1988 from 42.4% in 1965, while those of imports decreased to 21.7% of total supply in 1988 from 26.5% in 1965. Despite the fact that 43 construction materials plants were in operation throughout Mongolia as of 1985 and produced 10.8%
of the country’s gross industrial output (Namjim, T. 2000a), import dependence of the construction sector was highest, with its import share equaling 50.8% of total supply in 1985 but dropping to 33.8% in 1988. This indicates that the domestic production capacity of construction supplies was short of the booming demands during those periods. Also, the trade margin for industrial products was largest in 1965 at 27.5% of total supply but decreased by almost half to 13.6% in 1988. Although the transport margin for agricultural products experienced increases, while that of forestry and others decreased, the overall transport margin changed little, accounting for 6.6% of total supply over the periods (Table 2.3.1).
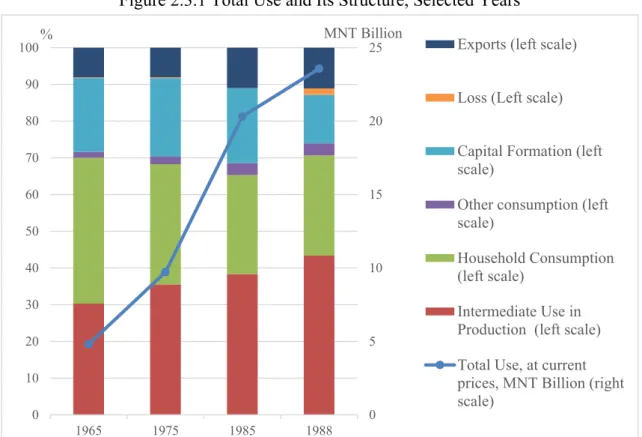
In terms of use structure, intermediate use of both agricultural and industrial products increased during 1965-1988. More than half of these products were used as production inputs in 1988, while their final consumption shares were shrinking. The household consumption share of agricultural products fell to 25.6% of the total in 1988 from 31.3%
in 1965, while those of industrial products dropped to 28.6% of the total in 1988 from 50.4% in 1965. However, export share of industrial goods increased to 14.1% in 1988 from just 2.8% of the total in 1965. At the same time, the share of capital formation of construction stayed relatively stable at over 80% of the total. Overall, in line with the growing industrial production, the share of intermediate use increased, while that of household consumption decreased over the periods (Table 2.3.2; Figure 2.3.1).
14
Table 2.3.1 Supply Structure Prior to 1990, Selected Years
Year Products by Sectors
Total Supply, at current
prices, MNT Million
Structure, % of total supply at current prices Domestic
Production at basic
prices
Imports at basic prices
Transport and Trade Margins Transport
Margin
Trade
Margin Total 1965
Agriculture 1 172.6 86.5 0.4 3.3 9.7 13.1 Industry 2 903.9 42.4 21.7 8.5 27.5 36.0 Construction 598.0 100.0 0.0 0.0 0.0 0.0 Communication 14.9 100.0 0.0 0.0 0.0 0.0 Forestry and others 114.9 82.9 0.0 5.2 11.9 17.1
Total 4 804.3 61.5 13.2 6.1 19.3 25.3 1975
Agriculture 1 851.2 82.1 0.8 4.7 12.5 17.2 Industry 6 290.4 48.8 18.8 8.8 23.6 32.4 Construction 1 409.6 50.8 49.2 0.0 0.0 0.0 Communication 39.2 100.0 0.0 0.0 0.0 0.0 Forestry and others 132.0 86.1 0.0 3.9 10.0 13.9
Total 9 722.4 56.2 19.4 6.6 17.8 24.4 1985
Agriculture 2 660.0 85.7 1.5 8.5 4.3 12.8 Industry 14 457.6 49.9 24.6 7.7 17.8 25.5 Construction 2 998.5 49.2 50.8 0.0 0.0 0.0 Communication 24.9 100.0 0.0 0.0 0.0 0.0 Forestry and others 172.2 84.6 0.0 3.9 11.5 15.4
Total 20 313.2 54.8 25.2 6.6 13.3 19.9 1988
Agriculture 3 303.6 86.2 1.5 7.9 4.4 12.3 Industry 16 419.4 52.1 26.5 7.9 13.6 21.4 Construction 3 144.6 66.2 33.8 0.0 0.0 0.0 Transport 308.6 100.0 0.0 0.0 0.0 0.0 Communication 219.8 100.0 0.0 0.0 0.0 0.0 Forestry and others 179.8 95.9 0.0 2.3 1.8 4.1
Total 23 575.8 60.2 23.1 6.6 10.1 16.7 Source: Compiled from NSO, 2011 and personal communications.
15
Table 2.3.2 Use Structure Prior to 1990, Selected Years
Year Products by Sectors
Structure, % of Total Use
Total Use, at current prices Intermediate Use in Production
Final Uses Final Consumption
Capital Formation Loss Export
Household Other
1965 Agriculture 1 172.6 36.6 31.3 0.1 7.3 0.6 24.0 Industry 2 903.9 31.4 50.4 2.4 13.0 0.0 2.8 Construction 598.0 8.8 6.2 1.0 84.1 0.0 0.0 Communication 14.9 100.0 0.0 0.0 0.0 0.0 0.0 Forestry and others 114.9 40.2 36.1 1.1 0.0 0.0 22.5
Total 4 804.3 30.3 39.7 1.6 20.1 0.2 8.1 1975 Agriculture 1 851.2 59.8 25.7 1.0 1.2 1.0 11.2
Industry 6 290.4 34.3 40.6 2.3 13.8 0.0 9.0 Construction 1 409.6 4.0 9.3 2.2 84.6 0.0 0.0 Communication 39.2 100.0 0.0 0.0 0.0 0.0 0.0 Forestry and others 132.0 72.7 18.6 0.0 0.0 0.0 8.7
Total 9 722.4 35.5 32.8 2.0 21.4 0.2 8.1 1985 Agriculture 2 660.0 56.2 28.5 1.2 4.6 0.2 9.4
Industry 14 457.6 42.1 30.9 3.8 9.6 0.0 13.5 Construction 2 998.5 2.2 7.5 2.6 87.7 0.0 0.0 Communication 24.9 100.0 0.0 0.0 0.0 0.0 0.0 Forestry and others 172.2 70.6 11.3 0.0 0.0 0.0 18.1
Total 20 313.2 38.4 26.9 3.3 20.4 0.0 11.0 1988 Agriculture 3 303.6 52.9 25.6 1.2 7.7 4.5 8.1
Industry 16 419.4 50.2 28.6 3.9 1.7 1.6 14.1 Construction 3 144.6 2.8 11.5 3.4 82.3 0.0 0.0 Transport 308.6 0.0 100.0 0.0 0.0 0.0 0.0 Communication 219.8 14.2 85.8 0.0 0.0 0.0 0.0 Forestry and others 179.8 64.8 21.1 0.0 0.0 0.0 14.0 Total 23 575.8 43.4 27.3 3.3 13.2 1.7 11.1
Source: Compiled from NSO, 2011 and personal communications.
16
Figure 2.3.1 Total Use and Its Structure, Selected Years
Source: Compiled from NSO, 2011 and personal communications.
2.4 Labor Force and Productivity
In accordance with the economic structure, the agriculture sector provided 86.6% of total employment in 1940. Although its share began to decrease following the emergence of other economic activities, agriculture remained Mongolia’s largest employment provider. The number of persons employed in agriculture equaled 247,100 or 32.3% of the total in 1989, and it increased further to 258,800 or 33% in 1990. Industry was the second largest employment provider, with its share increasing from 5% of the total in 1950 to 16.1% in 1989 and 16.8% in 1990. The construction sector employed 65,200 persons or an 8.5% share of the total in 1989. At the same time, employment in the service sectors increased rapidly, especially since the 1960s. Numbers employed in the education sector were 86,800 in 1990, which was a more than 5-fold rise on its 1960 level. Also, employment in trade, transportation, communication, healthcare and social services increased about 4-fold during the period from 1960 to 1990. Overall, Mongolia witnessed a substantial rise in its workforce during the 1980s as the baby boomers first entered the labor market. At the same time, numbers of workers in public adminitration as a share of total employment almost doubled to 4.1% in 1990 from 2.1% in 1970 and 2.2% in 1980 (Figure 2.4.1; Table 2.4.1).
0 5 10 15 20 25
0 10 20 30 40 50 60 70 80 90 100
1965 1975 1985 1988
MNT Billion
% Exports (left scale)
Loss (Left scale)
Capital Formation (left scale)
Other consumption (left scale)
Household Consumption (left scale)
Intermediate Use in Production (left scale) Total Use, at current prices, MNT Billion (right scale)
17
Figure 2.4.1 Employment by Sectors, Selected Years
Source: Compiled from NSO, 2011.
Table 2.4.1 Persons in Employment, Selected Years, Period end, 1,000 Persons Sectors 1940 1950 1960 1970 1980 1990 Agriculture, hunting and forestry 210.4 229.2 254.2 222.3 203.0 258.8 Industry, total 13.7 14.0 50.4 60.6 85.4 131.6
Construction 28.9 23.7 32.7 66.1
Wholesale and retail trade, repair of
household goods 7.3 8.6 14.7 23.7 34.5 54.6 Transportation, communication and
storage 1.4 5.8 15.4 24.1 37.4 57.7
Financial and lending organizations 0.2 0.6 1.8 1.9 3.9 Public administration 4.9 8.1 19.1 8.8 11.6 32.1
Education 2.8 6.9 17.1 29.6 57.9 86.8
Health and social services 2.0 4.6 11.6 20.1 31.3 49.2 Social and private services - 1.0 2.7 8.2 14.4 33.9
Other 0.3 1.0 3.3 5.8 5.9 8.9
Total 242.8 279.4 418.0 428.7 516.0 783.6 Source: Compiled from NSO, 2011.
0.0 100.0 200.0 300.0 400.0 500.0 600.0 700.0 800.0 900.0
1940 1950 1960 1970 1980 1989 1990
Other
Construction
Industry
Agriculture, hunting and forestry
Total
18
Labor productivity, which is a measure of technological development and living standards in a country, also improved in the period before 1990, with its growth accelerating fastest when Mongolia experienced intensive industrial development in the 1970s. Although the labor productivity level was highest in the trade, materials and technical supply sector, the industry sector was the main source of labor productivity growth. The annual average growth of labor productivity in industry equaled 8.5% during the 1960s and 70s, while it was 2.5% and 5.9% on a national level respectively. But in the 1980s labor productivity growth on a national level slowed to 2.3% per annum, while it was 2.8% per annum in the industry sector (Table 2.4.2; Figure 2.4.2;).
Table 2.4.2 Annual Growth of Labor Productivity, Period Average, % Periods National Agriculture Industry Construction
Trade, Materials, Equipment
Supply
Transport, Communication
1961-1989 3.6 3.0 6.5 2.4 -0.1 1.9
1961-1969 2.5 2.1 8.5 4.2 -3.4 -2.6
1970-1979 5.9 4.7 8.5 3.1 1.7 6.7
1980-1989 2.3 1.9 2.8 0.3 1.2 1.2
Source: Estimated from NSO, 2011 and personal communications.
Figure 2.4.2 Labor Productivity by Sectors (at constant 1986 prices, MNT)
Source: Compiled from NSO, 2011 and personal communications.
Industry Trade, Materials and
Equipment Supply
0 5,000 10,000 15,000 20,000 25,000 30,000 35,000 40,000 45,000 50,000
1940 1950 1960 1961 1962 1963 1964 1965 1966 1967 1968 1969 1970 1971 1972 1973 1974 1975 1976 1977 1978 1979 1980 1981 1982 1983 1984 1985 1986 1987 1988 1989 1990
MNT
National Agriculture
Industry Construction
Trade, Materials and Equipment Supply Transport and Communication
19 2.5 State Budget
Mongolia’s state budget prior to 1990 was relatively well-balanced. Since the 1960s, the state budget income and expenditure shares made up around 55% of total NMP. Such a high share was not out of place for a country applying a socialist and centrally planned economic system. Further, balance of the state budget was positive, totaling 1%-3% of NMP during the period 1960-1985, except in 1962-1963. The largest state budget deficits over the period occurred in 1962 and 1963, equaling 2% and 3.1% of total NMP respectively (Figure 2.5.1).
The state budget plays an essential role in the financial system of socialism and a considerable part of national income or NMP is distributed through the budget. A large proportion of the budget was allocated to fund research and development and social services, such as education, health, pensions, etc., which were provided free of charge to the population.
Accordingly, in addition to economic development, Mongolia achieved remarkable progress in social development during this period. For example, Mongolia’s adult literacy rate increased to 81.5% in 1969 and further to 96.5% in 1989 after climbing from a mere 2% in 1918 (NSO, 2011).
Figure 2.5.1 Mongolia’s State Budget, at current prices, 1940-1985
Source: Compiled from NSO, 2011 and personal communications.
-4 -3 -2 -1 0 1 2 3 4
0 1,000 2,000 3,000 4,000 5,000 6,000 7,000
1940 1950 1960 1961 1962 1963 1964 1965 1966 1967 1968 1969 1970 1971 1972 1973 1974 1975 1976 1977 1978 1979 1980 1981 1982 1983 1984 1985
% MNT Million
Budget Income (left scale) Budget Expenditure (left scale) Balance Share of NMP (right scale)
20
As described in the Economics Institute of the UAS (2020), “the State Budget occupies a leading place in the financial system of socialism. Thanks to the predominance of social ownership of the means of production, the State Budget under socialism is closely connected with the whole national economy, and is an instrument for the planned development of socialist economy and rational use of productive resources in all branches of the national economy”. Also, socialist production serves as the material basis of the financial system, which rests on the growth of industry and agriculture and the extension of trade. With its help, the gross social product is distributed in a monetary form among the sectors of socialist production, as well as between the society as a whole and its members. The financial system must ensure the most rational use of all resources of a socialist economy and increase profitability of production (Economics Institute of the UAS, 2020).
According to the balance table of primary revenues and redistributed final consumption expenditures of Mongolia’s GSP, industry was the largest source of such primary revenues, followed by agriculture, and trade, procurement, public catering. The combined share of these sectors accounted for about 70% of total revenues in the 1960s and 1970s, but it decreased to 64% total in 1988 owing to expansions of the construction, transport and communication sectors. At the same time, foreign sources of total primary revenues jumped to 16% in 1988 from 6.6% in 1965. This trend indicates that Mongolia’s budget dependence on foreign sources or aid increased over time. On the expenditure side, the material production sectors held the largest share and accounted for more than half of total expenditures, while positive balances were maintained for all sectors. This implies that all material production sectors were not subsidized during these years. At the same time, population income (or salary) as a share of final expenditure decreased over the period, falling from 37.5% of the total in 1965 to 23.1% in 1985 (Table 2.5.1).
Total expenditures on non-material production or services, such as dwelling, urban, community and household services, culture, education, health, social security, sports, science and scientific services, administration and other non-production services, were maintained at less than 20% of the total. Along with Mongolia’s growing population and the government’s goal to improve the social environment, the number of housing, schools, hospitals, kindergartens and crèches increased in each of the consecutive 5-year planning periods. For example, the total amount of housing buildings put into operation increased to 2.3 million sq. m during 1985-1990 from 645,000 in 1971-1975. Further, whereas more than 90% of housing was owned by the state or cooperatives until 1985, the share of privately owned housing increased to 19% of the total during 1985-1990. Around 120 new schools were built during the 5-year periods with a total capacity of approximately 50,000 seats, while the number of kindergarten and crèche beds tripled between the 1971-
21
1975 and 1985-1990 periods. Also, the number of hospital beds made available increased to 3,635 during 1985-1990 from 2,235 during 1971-1975. At the same time, administration expenditures as a share of the total increased (Tables 2.5.1; 2.5.2).
Table 2.5.1 GSP Primary Revenues and Redistributed Final Expenditure Balance
Revenue and Expenditure Items 1965 1975 1985 1988
GSP Total, current prices, MNT Billion 4.5 8.9 18.1 21.6 Primary Revenue Structure, % 100 100 100 100 Domestic Production Revenues, total 93.4 87.6 85.8 84.0
Industry 27.6 34.4 39.8 39.7
Agriculture 22.7 17.0 12.6 13.2 Trade, Procurement, Public Catering 20.7 19.3 14.9 11.0
Construction 13.4 8.0 8.1 9.7
Transport, Communication 6.9 7.6 9.6 9.7
Forestry 0.2 0.4 0.3 0.2
Other 2.0 0.9 0.5 0.6
Foreign Sources 6.6 12.4 14.2 16.0 Final Expenditure Structure, % 100 100 100 100
Material Production, total 48.8 55.0 59.3 57.5
Industry 22.3 26.7 33.2 30.5
Agriculture 9.1 9.8 9.2 11
Trade, Procurement, Public Catering 7.8 5.7 3 0.5
Construction 4.8 6.3 7.8 8.2
Transport, Communication 4.5 6.4 5.9 7
Forestry 0.1 0 0 0
Other 0.2 0.1 0.1 0.2
Non-material Production (Services), total 13.7 16 17.6 19 Dwelling, urban, community and
household services 7.1 7.1 7.5 5.9
Culture, education 2.6 3.3 3.5 3.5
Health, social security, sports 1.8 2.6 2.1 2.1 Science and scientific services 0.3 0.6 0.5 0.5 Finance, insurance 0 0.1 -0.4 3.3
Administration 1.5 2.3 4.4 3.8
Other non-production sectors 0.3 0.1 - -
Population 37.5 29.0 23.1 23.5
Source: Compiled from NSO, personal communications.
22
Table 2.5.2 Selected Social Indicators Items Put into Operation Unit 1971-
1975 1976-
1980 1981-
1985 1985- 1990 Housing buildings, total
1,000 sq.
m
645.0 1,207.9 1,513.7 2,265.8
State and cooperative
owned 610.5 1,154.3 1,419.9 1,836.4
Private owned 34.5 53.6 93.8 429.4 Schools:
Units number 124 103 124 122
Capacity 1,000
seats 47.7 39.1 53.1 49.5
Kindergartens, crèches 1,000 beds 4.5 10.7 15.2 15.0
Hospitals beds 2,235 2,780 2,595 3,635
Source: Compiled from NSO, 1991
2.6 Agricultural Output
The favorable natural environmental conditions of Mongolia, well-suited to rearing domestic livestock, was the major reason for the development of the livestock sector as the country’s first productive sector, although, as in other countries across the globe, the first economic activity undertaken by early humans living on Mongolia’s plateau was hunting. The initial process of domesticating wild animals began in Mongolia between the 8th and 3rd centuries B.C. and became the focus of productive activity after the latter half of the 2nd century B.C. Traditionally, commonly raised domestic livestock in Mongolia were sheep, goats, cattle, horses and camels, while pigs, hens and other birds were seldom reared. Horses were the first animal to be domesticated in Mongolia (Baasanjav et.al., 1999).
The harsh continental climate of Mongolia, which is characterized by significant changes in the weather during the four seasons, as well as differences in the grassland available in different areas, cause the Mongolian people to lead a nomadic lifestyle based on pastoral animal husbandry. Research suggests that this was economically more effective than conventional agriculture (i.e. planting). Therefore, the classic Mongolian form of animal husbandry is considered an efficient production activity in terms of labor, economic payoffs and ecological considerations. The term “classic” denotes the original pastoral animal husbandry methods that have developed over time during the course of the nomadic lifestyle, and which have been passed down from generation to generation.
Livestock in Mongolia is considered a part of the nation’s wealth and is subject to state protection under the country’s constitution.
Between the 13th and 14th centuries, herder-settlements – groups of herder households forming small nomadic settlements – became the first major labor division of herders.
However, after nationwide campaigns calling for the establishment of cooperatives began
23
in 1950, the herder-settlement system of labor division that had been practiced for more than 700 years in Mongolia was abandoned in favor of cooperatives. According to the NSO (1991), in 1960 there were 354 agricultural cooperatives throughout the country in addition to 25 state farms engaged in conventional agriculture, i.e. crop and vegetables planting, dairy and meat farming, and 17 inter-farm enterprises. Numbers of agricultural cooperatives fell to 255 in 1990, while the figure for state farms increased to 53. Also, farms specializing in fodder supply were established in the 1960s, and there were 20 such farms in 1990. But with the beginning of the transition from a centrally-planned command economy to a market-oriented one in 1991, a massive privatization process got underway and livestock ownership was transferred back to the people free of charge, mainly to the cooperatives’ own members; all the cooperatives were thus dissolved (Enkhbayar, Sh., 2002).
As above, the livestock sector accounted for most agricultural production in Mongolia.
Gross agricultural production increased by 2.6% per annum in real terms during the period 1960-1990, whereas livestock output accounted for almost 80% of total agricultural output until the early 1980s. Livestock output share then dropped to about 70% during the 1980s as crop production surged. In fact, crop output doubled in the decade prior to 1989 (Figures 2.6.1).
Largescale land cultivation in Mongolia began in 1959, and two crop missions were implemented before 1980. Their aim was to increase land areas for cultivation and improve crop productivity by introducing technological and technical advancements along with human resource development in the agriculture sector. As a result, the sown area increased to 690,210 ha in 1989 from only 249,710 ha in 1960. Wheat is the main crop in Mongolia, and its cultivation accounted for almost 80% of the total. Peak crop production was achieved in 1985, when 886,171 tons of cereals where harvested, 688,462 tons of which were wheat. Production of potato and vegetables grew during the period 1960-1989 as well, with and 155,500 tons of potato and 59,500 tons of vegetables harvested in 1989 (Figure 2.6.2).
24
Figure 2.6.1 Agricultural Production; 1960-1990 (Constant 1993 prices, MNT Million)
Source: Compiled from NSO, 1996.
Figure 2.6.2 Production of Major Agricultural Products (Cereals); 1960-1990
Source: Compiled from NSO, 2020.
886.2
249.71
690.21
0 100 200 300 400 500 600 700 800 900 1,000
0 20 40 60 80 100 120 140 160 180
1960 1962 1964 1966 1968 1970 1972 1974 1976 1978 1980 1982 1984 1986 1988 1990
Potato, 1,000 tons (left scale) Vegetables, 1,000 tons (left scale) Crops, 1,000 tons (right scale) Sown area, total, 1,000 ha (left scale) 0
20,000 40,000 60,000 80,000 100,000 120,000
1960 1962 1964 1966 1968 1970 1972 1974 1976 1978 1980 1982 1984 1986 1988 1990
Livestock Crops
Gross agricultural output
25
The number of livestock ranged between 22.7 million and 26.2 million during the period 1930-1990. Sheep accounted for almost 60% of the total, followed by goats at around 20%, while cattle and horses each made up about 10% of all livestock. The number of camels ranged between 0.5 million and 0.9 million during this period (Figure 2.6.3).
The livestock sector provides a stable food supply for the country’s population and the main inputs for livestock-origin raw materials processing industries. Manufacturing industries based on these raw materials developed significant capacity in Mongolia since the mid-1930s and as of the late 1970s and early 1980s, almost all of the livestock-origin raw materials, such as meat, milk, wool, cashmere, hair, hides and skin, were processed domestically, supplying various food and other finished products to domestic and foreign markets.
The annual amount of raw materials supplied by the livestock sector increased to 6 million pieces during the 1980s from 4 million in the 1970s. A peak quantity of 6.6 million hides and skin procurement was achieved in 1986. Sheepskin accounted for 70% of the total, followed by goat skin, which was equal to 20%. The remainder consisted of cattle, horse and camel hides (Figure 2.6.4).
Figure 2.6.3 Number of Livestock (1930-1990)
Source: Compiled from Mongolian Statistical Yearbook, various issues.
1930 1940 1950 1960 1970 1980 1990
Goats 4.1 5.1 5.0 5.6 4.2 4.6 5.1
Sheep 15.7 15.4 12.6 12.1 13.3 14.2 15.1
Cattle 1.9 2.7 2.0 1.9 2.1 2.4 2.8
Horses 1.6 2.4 2.3 2.5 2.3 2.0 2.3
Camels 0.5 0.6 0.8 0.9 0.6 0.6 0.5
Total 23.7 26.2 22.7 23.0 22.6 23.8 25.9 0
5 10 15 20 25
30Million Heads