Li-ion 電池負極( II )
ハードカーボン系負極
素子材料特論
第3授業
Performances Factors Capacity • Sites for Li incorporation Potential for charge
and discharge
• Reversibility of charge and discharge
• Over potential
• Non-electrochemical reaction charge and discharge rate • Diffusivity of Li
Non-dischargeable charge
• Reactivity of electrolyte
• Reactivity of anode, hetero atomic groups, terminal C-H, edge carbon
• Irreversible sites for Li incorporation Cycle ability • Irreversible charge in structure
Safety
• Stability of charged Li
• Li-Carbon intercalation
• Thermal stability of SEI
• Reactivity of electrolyte
Anodic performance and their related factors
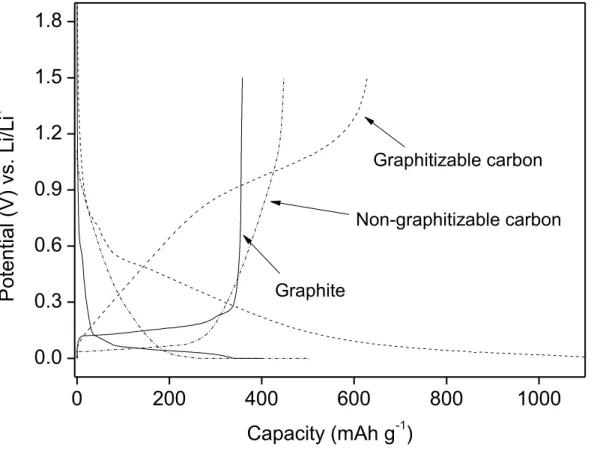
Figure 1-4. Charge-discharge profiles of representative carbon materials
0 200 400 600 800 1000
0.0 0.3 0.6 0.9 1.2 1.5 1.8
Potential (V) vs. Li/Li+
Capacity (mAh g-1)
Non-graphitizable carbon Graphitizable carbon
Graphite
Charge-Discharge Curves of Various Carbon Materials
J. R. Dahn,* Tao Zheng, Yinghu Liu, J. S. Xue SCIENCE, 270, 27 OCTOBER 1995
Mechanisms for Lithium Insertion in Carbonaceous Materials
Figure 1-5. (a) Plot of reversible capacity for Li vs. HTT for a variety of carbon samples ( □
hard carbon, ■ soft carbon), (b) Charge capacity as a function of the height of stacking
(Lc002)
Precursor Advantages Disadvantages
Graphite (over 2800
oC)
Natural graphite Artificial graphite MCMB
Needle cokes VGCF
Low discharge potential (around 0.2V)
Long cycle life
Low discharge capacity (372 mAh/g)
High cost
Graphitizable carbon
(600~800
oC)
MCMB
Meso phase pitch Green cokes
High capacity (700~1000mAh/g) Low cost
High discharge potential (around 1.0V)
High irreversible capacity Poor cycle stability
Non-
graphitizable carbon
(1000~1400
oC)
Thermosetting polymer Glassy carbon
Coal
Organic material
Stabilized isotropic pitch
High capacity (400~700mAh/g)
Low discharge potential (around 0.1V)
Low cost
High irreversible capacity
Characteristics of various materials
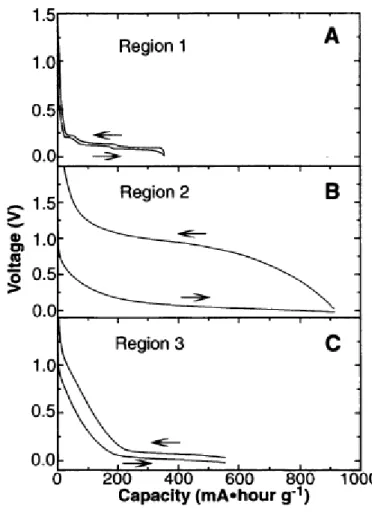
Fig. 2. Plots of voltage versus reversible capacity for the second charge-discharge cycle of representative carbon
samples from regions 1, 2, and 3 of Fig. 1. (A) Synthetic graphite (Johnson-Matthey); (B) petroleum pitch (Crowley Tar
Co.) heated to 550
0C; (C) resole resin (Occidental Chemical Co.) heated to 1 000
0C. Arrows designate the directions
the curves are traversed as Li is added to (to the right) or removed from (to the left) the carbon samples.
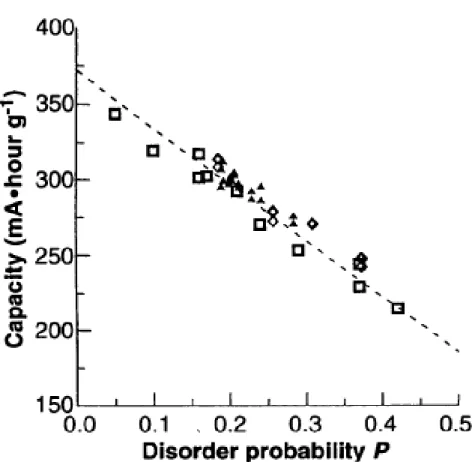
Fig. 3. Reversible capacity of region 1 carbons plotted as a function of the probability P of turbostratic disorder
between adjacent carbon sheets. The line is the relation 0 = 372(1 - P), where Q is the capacity. For the purposes of
this plot, samples corresponding to different symbols are equivalent.
ハードカーボンの製造
•
原料:難黒鉛化性前駆体
- Biomass: Husk, Cellulose, Sugar, Rignin, Tree, Crab
(Chichin), …
- Polymer: Phenol Resin, Unsaturated Resin, Epoxy Resin
- Pitch:
Isotropic Pitch and Coke
•
熱処理温度
-
800~1400℃•
構造
-
難黒鉛化性カーボンハードカーボンの構造
(a) Non-Graphitizing (Isotopic) (b) Partially Graphitizing (c) Graphitizing
Domain
Microdomain
Cluster
2次元的構造
3次元的構造
10
活性炭素繊維の微細構造
OG7A-800H OG20A-800H
In order to remove oxygen containing functional groups for removing the heterogeneous effect of STM, OG7A and OG20A were heat-treated at 800
OC in a hydrogen atmosphere ( H
2/ He =1/4).
Vacant spaces between the two domains of OG20A are larger than that of OG7A.
Domain size of OG20A is a little smaller than that of OG7A.
Slit type pores were observed in domains of OG7A and OG20A.
It can be presumed that almost pores larger than 2nm nucleated by the inter-particle mechanism.
5nm 25nm 5nm 25nm
Slit shaped pore (Intra-particle)
Slit shaped pore (Intra-particle)
Channeling pore
(Inter-particles)
11
ガラス炭素の微細構造
ハードカーボンの長所と短所
• 長所
- 高容量が可能 - 安価( ? )
- 資源が豊富( ? ) - High rate property - Hybrid 系材料が可能 - 低温特性がよい。
- 電解液の PC 使用可能
• 短所 - 低密度
- 放電プロフィルが Non-platten - 不純物の除去が困難
- 低1 st cycle Coulombic efficiency - 低 Cycle 性
- …
14
10 20 30 40 50
0 200 400 600 800 1000
Intensity
2 theta
IM700 IM800 IM900 IM1000
Elemental analysis (wt%) S.A.
(m2/g)
C H N O Ash
IM 70.6 3.6 0.38 23.7 1.7 -
IM 700 89.4 1.0 0.72 582 3.1 318
IM 800 90.0 0.8 0.74 5.5 3.0 19
IM 900 91.0 0.6 1.17 4.3 3.0 3
IM 1000 91.5 0.5 1.13 4.0 2.9 54
Hard Carbon from Indonesian Mangrove Char
XRD
Elemental analysis & Surface area STM image of IM1000
Microstructure of carbon derived from mangrove charcoal and its application in Li-ion batteries, Liu, Tao; Luo, Ruiying; Qiao, Wenming; Seong-Ho Yoon, et al., ELECTROCHIMICA ACTA, 55, 1696-1700, 2010
“Li+ storage sites in non-graphitizable carbons prepared from methylnaphthalene-derived isotropic pitches(MNIP)”, Carbon, 38, 995 - 1001 (2000), C. W. Park, S. I. Lee, S.H. Yoon, S. M. Oh
Li-NMR of Various Carbons
-100 -50 0 50 100 150 200 250
-100 -50 0 50 100 150 200 250
-100 -50 0 50 100 150 200 250
-100 -50 0 50 100 150 200 250
-100 -50 0 50 100 150 200 250
-100 -50 0 50 100 150 200 250
-100 -50 0 50 100 150 200 250
-100 -50 0 50 100 150 200 250
-100 -50 0 50 100 150 200 250
-100 -50 0 50 100 150 200 250
ppm
IMA700(CCCV charge to 0V)
IMA1000(CCCV charge to 0V) IMV2400(CCCV charge to 0V)
a b u n d a n c e
IMV1000(CCCV charge to 0V)
MAG(CCCV charge to 0V)
ハードカーボンの充放電機構
Low-crystallized carbon materials for lithium-ion secondary batteries, Hayato Higuchi, Keiichiro Uenae, Akira Kawakami
JOURNAL OF POWER SOURCES, 68, 1997
19
Condition Ch (mAh/g)
Dis (mAh/g)
Efficiency (1cy, %)
Cap.irrev.
(mAh/g)
IM
Ar 1000 628 469 74.7 159
Vac 1000 503 453 90.1 50
0 100 200 300 400 500 600
0.0 0.5 1.0 1.5 2.0
Ar 1000 Vac 1000
Potential (V) vs. Li/Li+
Capacity (mAh/g)
Ch-Dis Profile
IM V1000 showed the better initial efficiency than that of IM Ar1000
Hard Carbon from Indonesian Mangrove Char
理想的なハードカーボン
• 高密度: 1.9g/cm3 以上
• 高容量: 650mAh/cc
• 高レート性: 90% 以上(5 C/0.2C: Half cell, 20 C/0.2C:Single cell )
• Low Impurity: 100ppm 以下
• 安価: 800 円 /Kg 以下
• 高 1st Coumbic efficiency
• 高低温特性
• 高サイクル性
• 豊富な原料からの調製
• マイルドな炭化条件
• Hybrid 系が可能な材料: SnOx または Si とのハイブリッド化⇒高容量化
⇒ 達成するためには、各々因子に対応する原因把握が要求。
⇒ まだ、原因解明が明らかになっていない。
⇒ 今後の研究に期待する。
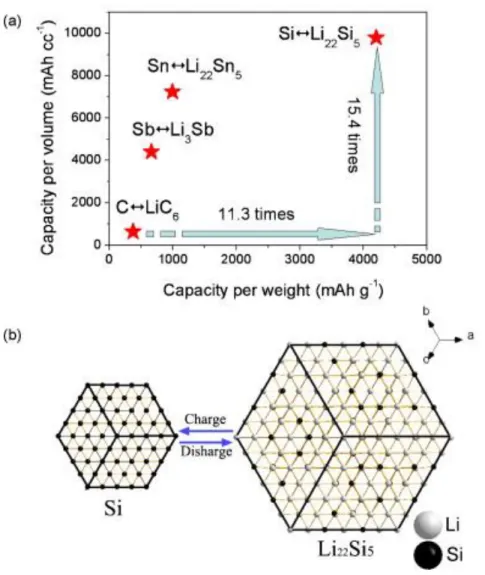
Figure 1-15. Typical high performance materials as anode ; (a) Comparison of graphite, Si, Sn and Sb
(b) Volume expansion model of Si during charge
22
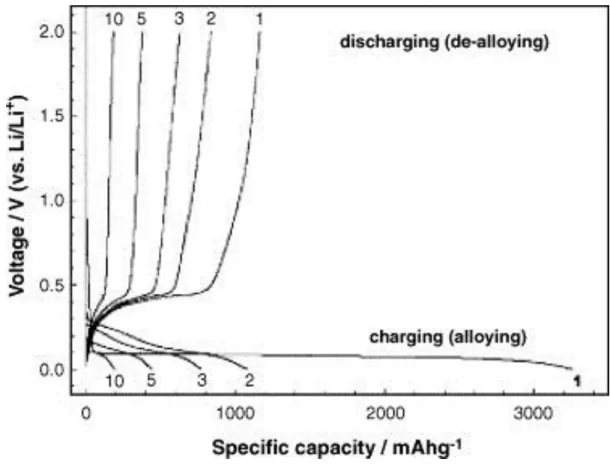
SiO, Si and Sn (SiO 2100, Si 4200, Sn 931 mAh/g) are very promising materials as anodic materials of LIB for their large theoretical capacities, however, they have poor cycle performances because of internal crack in particles caused by large volumetric expansion in charge process.
High performance material & their problems
Li-Si system
Compound Structure Unit cell vol.
(A
3)
Vol. / Si atom (A
3)
Si Cubic 160.2 20.0
Li
12Si
7Orthorhombic 243.6 58.0 Li
14Si
6Rhombohedral 308.9 51.5 Li
13Si
4Orthorhombic 538.4 67.3
Li
22Si
5Cubic 659.2 82.4
Volume expansion (over 400%)
Ref. : A. John Appleby and et al., J Power Sources 163 (2007) 1003-1039
Ref.) J. Power Sources 192 (2) (2009) 644-651
Fig. 2. Galvanostatic charge–discharge profiles for micro-Si (10 μm) anode.
J.H. Ryu, J.W. Kim, Y.-E. Sung, S.M. Oh
Electrochem. Solid State Lett., 7 (2004), p.
A306
Cycling behavior of SiO
xwith different oxygen content and particle size
J. Yang, Y. Takeda, N. Imanishi, C. Capiglia, J.Y. Xie, O. Yamamoto
Solid State Ionics, 152–153 (2002), p. 125
Specific capacity vs. cycle number for nano-crystalline Si and nano-amorphous Si thin film anodes prepared by thermal vapor deposition. Specific capacity of graphite and bulk-
silicon anodes also shown J. Graetz, C.C. Ahn, R. Yazami, B. Fultz
Electrochem. Solid-State Lett., 6 (2003), p. A194
SEM morphology of 250 nm a-Si film on Cu cycled at C/2.5 for (a) 1 cycle, and (b) 30 cycles
J.P. Maranchi, A.F. Hepp, A.G. Evans, N.T. Nuhfer, P.N. Kumta
J. Electrochem. Soc., 153 (2006), p. A1246
Cycling performance of carbon-coated silicon anodes in 1 M LiPF
6EC:DMC (1:2) at different water contents present in the electrolyte. In all cases, the ‘exhaustion point’ (last extraction peak) is centered around 1000 mA h/g
Electrochimica Acta
Volume 48, Issue 11, 15 May 2003, Pages 1579–1587
Long/thick CNF Short/thin CNF SiO particle
Figure Schematic model of cocoon shaped composite of silicon monoxide and surficial carbon nanofiber (SiO-CNF composite)
(a) (b)
SiO Catalyst
(a)
Pyrolytic carbon(b)
(c)
108 106 104 102 100 98
Relative intensity
Binding energy (eV)
(a) (b) (c)
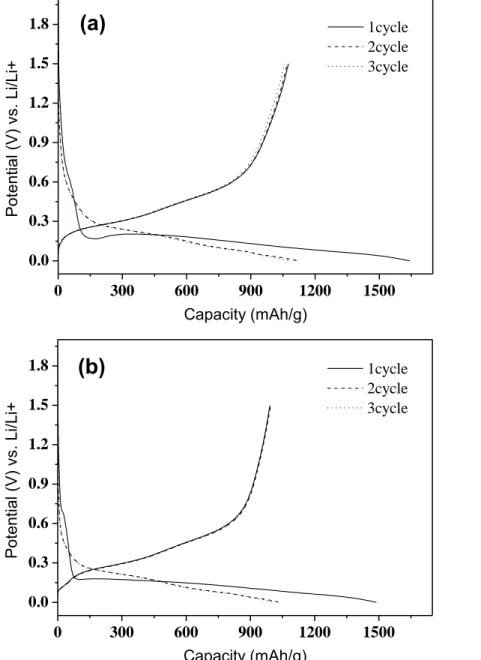
0 300 600 900 1200 1500 0.0
0.3 0.6 0.9 1.2 1.5
1.8 1cycle
2cycle 3cycle
Potential (V) vs. Li/Li+
Capacity (mAh/g)
(a)
0 300 600 900 1200 1500
0.0 0.3 0.6 0.9 1.2 1.5
1.8 1cycle
2cycle 3cycle
Potential (V) vs. Li/Li+
Capacity (mAh/g)
(b)
Figure Cycle performances with SiO-CNF composite until 3 cycles according to the various amount of CNFs
with Ni (a) or Fe catalyst (b).
30
0 300 600 900 1200 1500
38.1 52.0 61.9 65.8
769 450
825 826
1479
1253 1180
Coulombic efficiency Discharge capacity
Capacity (mAh g-1 )
Charge capacity 1335
50 100 150
Coumombic efficiency at 1 st cycle
Mixture (CNF) Composite
(Fe cat.)
Composite
(Ni cat.)
Mixture (KB)
At 1
stcycle
Superiority of the CNF composite
High discharge capacity and coulombic efficiency at 1
stcycle
Excellent cycle performance
Lower volume expansion
⇒ CNF growth provides spaces to relieve volume
expansion and conductivities to improve performances
0 5 10 15 20 25
0 300 600 900
Discharge capacity (mAh g-1 )
Cycle
Composite (Fe cat.)
Cycle performance
Composite (Ni cat.)
Mixture (CNF)
Mixture (KB)
88%
68%
32%
14%
Retention rate
Composite (Fe cat.) Mixture (CNF) Mixture (KB) 100
200 300 400
Volume expansion (%)
Electrolyte penetration only (2days) After charging to 0V
301%
248%
153%
124% 126%
112%
Volume expansion
Comparison bet. Composite and Mixture
(a)
(b)
(c)
Figure 2-12. SEM images of electrode surface after 3 cycles : (a) SiO-CNF composite with Fe catalyst, mixture of SiO-KB (b) or SiO-CNF (c).
(a)
(b)
(c)
(a)
(b)
(c)
32
Problem in Si-CNF composite
Small particle size, under 1um, is reasonable
Poor initial efficiency because of high surface area by CNF growth
Binding force bet. Si and CNF are needed
Although CNF growth on Si particle of 0.4um (Si-CNF composite), Si-CNF composite didn’t show improved cycle performance because CNF exfoliated from Si which had no surface acidity.
Problems of Si-CNF composite
0 250 500 750 1000 1250 1500 1750 2000 0.0
0.3 0.6 0.9 1.2 1.5 1.8
Potential(V) vs. Li/Li+
Capacity (mAh/g)
1cycle 2cycle 3cycle Efficiency : 70.0%
5umSi-CNF(87%)
0 250 500 750 1000 1250 1500 1750 2000 0.0
0.3 0.6 0.9 1.2 1.5 1.8
Potential(V) vs. Li/Li+
Capacity (mAh/g)
1cycle 2cycle 3cycle Efficiency : 71.9%
1umSi-CNF(88%)
0 250 500 750 1000 1250 1500 1750 2000 0.0
0.3 0.6 0.9 1.2 1.5 1.8
Potential(V) vs. Li/Li+
Capacity (mAh/g)
1cycle 2cycle 3cycle 0.4umSi-CNF Efficiency : 75%
Si-CNF composite : CNF growth directly on Si(5um, 1um, 0.4um)
Si-CNF model
Exfoliation
1263
442 336 327
56.7 24.3 21.7 23.0
As prepared 8%酸化 16%酸化 30%酸化
Discharge capacity(mAh/g)
Initial efficiency (%)
Prepared
8% 16% 30%
As
Extent of oxidation
Adhesive power and uniformity of CNF was improved by surface oxidized Si, where as charge-discharge performance became poor.
Oxidized Si-CNF composite
To improve surface acidity,
Si particle was oxidized at 700~900 ℃ for 3 hrs with H
2O
g. Schematic model
Si Oxidized
Si
Uniformity ↑ Adhesion ↑
Oxide film
CNF
33
Performance test
34
Step I : PC is coated on Si particle to improve adhesion between Si and CNF (PCSi).
⇒ The coated PC provide conductivity with Si particles as well as adhesion strength.
Step II : CNF is grown on PCSi to improve cycle performance
Step III : Removal catalyst by HCl treatment
Step IV : PC is re-coated on PCSi-CNF composite to improve initial efficiency by decreasing surface area.
Composite of PC coated Si and CNF
No PCSi Step I Step II Step III Step IV
Si
PC coating
Fe catalyst Carbon Nanofiber PC re-coating
(CNF)
As a solution, Pyrolytic carbon (PC) coating on Si particle is suggested.
Ref.) Carbon 47 (15) (2009) p.3338-3391
35
Code
PC/ or CNF amount (wt. %)
Condition
PC CNF PC re-
coating
Samples
Step I Si-PC 6 % - - PC coating
(900℃-CH
4/He- 30min) Step II Si-PC-CNF 6 % 93 % - CNF growth on PCSi
(580 ℃ -CO/He- 30min) Step III Si-PC-CNF-RC 6 % 93 % - Catalyst removal by HCl
Step IV Si-PC-CNF-RC-PC 6 % 93 % 8 % PC re-coating
(900 ℃ -CH
4/He- 30min)
Comparison Si-CNF - 98 % - CNF growth directly
on Si surface
Preparation of PCSi-CNF composite
0.0 0.2 0.4 0.6 0.8 1.0 0
100 200 300
Adsorption amount of N 2 /cm3 (STP) g-1
Relative pressure, P/P0
Si-PC (8 m2 g-1)
Si-PC-CNF (105 m2 g-1) Si-PC-CNF-RC (107 m2 g-1) Si-PC-CNF-RC-PC (68 m2 g-1)
25 30 35 40
Si-PC-CNF-RC-PC Si-PC-CNF-RC
Si-PC-CNF Si-PC
Intensity (cps)
2 Theta
No PCSi
36
Fe C(002)
XRD
SEM & TEM
N
2-BET
PC 再コーティング
Si-PC
PC CNF
Si-PC-CNF-RC-PC
Si-PC Si-PC-CNF-RC-PC
Si
Analysis of PCSi-CNF composite
37
0 5 10 15 20
500 1000 1500
Discharge capacity (mAh g-1 )
Cycle (times) PC被覆なしCNF-Si複合体 Step II
Step III Step IV
0 500 1000 1500 2000
0.0 0.3 0.6 0.9 1.2 1.5 1.8
Potential(V) vs. Li/Li+
Capacity (mAh g-1)
1cycle 2cycle 3cycle
Si-CNF composite
0 400 800 1200 1600
Capacity (mAh g-1)
1cycle 2cycle 3cycle
0 400 800 1200 1600
0.0 0.3 0.6 0.9 1.2 1.5 1.8
Potential(V) vs. Li/Li+
Capacity (mAh/g)
1cycle 2cycle 3cycle
0 400 800 1200 1600
Capacity (mAh g-1)
1cycle 2cycle 3cycle
Step II Step III Step IV
The decreased surface area PCSi-CNF
Effi.:76% Effi.:76% Effi.:79%
PCSi -CNF (Fe removal) PCSi -CNF (PC re-coating) Effi. : 75%
Si
Cycle performance
Exfoliation
Cycle performances of PCSi-CNF composite
38
Capacity at 1
stcycle (mAh/g)
Ch Dis
効率(%)
Samples
Si-PC-CNF 1709 1299 76.0
Si-PC-CNF-RC 1674 1272 76.0
Si-PC-CNF-RC-PC 1415 1115 78.8
Comparison Si-CNF 2037 1535 75.4
Dis.(max)
(mAh /g)
At 20 cycle (mAh/ g)
Dis Retention rate (%)
Samples
Si-PC-CNF 1317 1051 80
Si-PC-CNF-RC 1318 903 69
Si-PC-CNF-RC-PC 1136 873 77
Comparison Si-CNF 1535 670 44
Cycle performances of PCSi-CNF composite
Graphene nanosheets for enhanced lithium storage in lithium ion batteries
Carbon, 47, 2009, 2049–2053, G. Wang et al.
Charge and discharge curves of graphene nanosheets as anode in lithium-ion cells. The
inset is the cyclic voltammograms of graphene nanosheet electrode
Single wall carbon nanotube paper as anode for lithium-ion battery
Electrochimica Acta
Volume 51, Issue 1, 5 October 2005, Pages 23–28
The charge/discharge profiles of SWNT electrodes: (a) conventional slurry coated
electrode and (b) “Free standing” electrode.
Preparation and electrochemical properties of Ag-modified TiO 2 nanotube anode material for lithium–ion battery
Electrochemistry Communications
Volume 9, Issue 3, March 2007, Pages 425–430
44
Hybridization of Si/PyC/CNF and NG
0 5 10 15 20 25 30
0 100 200 300 400 500 600 700 800 900 1000
Discharge capacity (mAh/g)
Cycle
20Si/PyC/CNF:NG = 5:5 20Si/PyC/CNF:NG = 3:7 20Si/PyC/CNF:NG = 2:8 20Si/PyC/CNF:NG = 1:9 NG
0 5 10 15 20 25 30
0 100 200 300 400 500 600 700 800 900 1000
Discharge capacity (mAh/g)
Cycle
50Si/PyC/CNF:NG = 5:5 50Si/PyC/CNF:NG = 3:7 50Si/PyC/CNF:NG = 2:8 50Si/PyC/CNF:NG = 1:9 NG
20Si/PyC/CNF and NG 50Si/PyC/CNF and NG
Sample 1st cycle Coulombic efficiency (%)
Retention ratio (%, 30th/1st )
20Si/PyC/CNF:NG=5:5 63.6 86.3
20Si/PyC/CNF:NG=3:7 67.5 92.6
20Si/PyC/CNF:NG=2:8 74.2 94.5
20Si/PyC/CNF:NG=1:9 80.3 97.7
NG 90.0 106.9
Sample 1st cycle Coulombic efficiency (%)
Retention ratio (%, 30th/1st )
50Si/PyC/CNF:NG=5:5 63.1 81.4
50Si/PyC/CNF:NG=3:7 66.9 95.4
50Si/PyC/CNF:NG=2:8 72.1 96.7
50Si/PyC/CNF:NG=1:9 77.8 98.8
NG 90.0 106.9
√ The hybrids of the Si/PyC/CNF and NG showed better cycle-ability than the hybrids of
Si/PyC and NG.
Highly stable Si-based multicomponent anodes for practical use in lithium-ion batteries
Jung-In Lee , Nam-Soon Choi and Soojin Park Energy Environ. Sci., 2012,5, 7878-7882
Interdisciplinary School of Green Energy,Ulsan National Institute of Science and Technology, Ulsan, Korea 689-798
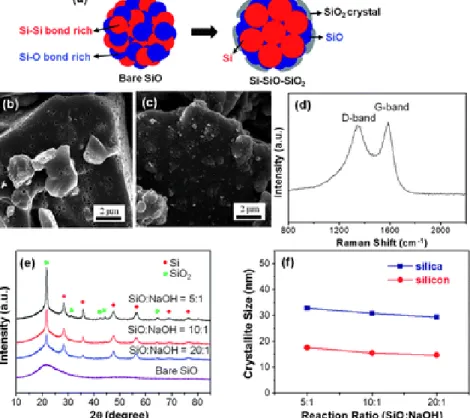
Synthesis of an Si-based multicomponent from bulk SiO particles via thermal annealing in the presence of NaOH. (a) Schematic
illustration for the conversion of bare SiO to Si–SiO–SiO2 three-components, (b) SEM image of Si-based multicomponents, SEM image (c) and Raman spectrum (d) of carbon-coated Si-based multicomponents, (e) XRD patterns of Si-based multicomponents as a function of NaOH amount, and (f) calculation of silica and silicon crystallite size as a function of NaOH amount
Electrochemical performances of c-SiO and c-Si–SiO–SiO2 three-component electrodes. (a) Voltage profiles of c-SiO (black), c-Si-multi-20–1 (red), c-Si-multi-10–
1 (pink), and c-Si-multi-5–1 (blue). (b) dQ/dV plots of c-SiO and c-Si-multi-20–1 (red) in the first and second cycles. (c) Cycle performances of c-SiO (black), c-Si- multi-20–1 (red), c-Si-multi-10–1 (pink), and c-Si-multi-5–1 (blue) at 0.1 C rate. (d) Rate capabilities of c-SiO and c-Si-multi-20–1 electrodes. The discharge rate was fixed at a rate of 0.1 C