九州大学学術情報リポジトリ
Kyushu University Institutional Repository
実験的検証モデルを用いたヒト眼球損傷過程に関す る数値解析
アリレザ, キャリミ
https://doi.org/10.15017/1807025
出版情報:Kyushu University, 2016, 博士(工学), 課程博士 バージョン:
権利関係:Fulltext available.
COMPUTATIONAL ANALYSIS FOR THE HUMAN EYE INJURY USING AN
EXPERIMENTALLY VERIFIED ANATOMICAL-BASED MODEL
By
Alireza Karimi
To the
DEPARTMENT OF MECHANICAL ENGINEERING GRADUATE SCHOOL OF ENGINEERING
KYUSHU UNIVERSITY Fukuoka, Japan
March, 2017
i
TABLE OF CONTENTS TABLE OF CONTENTS
NOTATION
C ontents
Chapter 1: Introduction ...1
1.1. Background ... 2
1.2. Eye globe ... 2
1.3. Previous works ... 4
1.3.1. Eye models ... 4
1.3.2. Sclera mechanical properties ... 7
1.3.3. Intraocular pressure increasing in the eye ... 9
1.4. Outline of this thesis ... 10
Chapter 2: Mechanical Properties of the Sclera ...20
2.1. Sclera preparation, mechanical testing, digital image correlation technique ... 21
2.2. Linear elastic and nonlinear hyperelastic models ... 26
2.3. Viscoelastic model ... 30
2.4. Statistical analysis ... 31
2.5. Results ... 31
2.6. Discussions ... 34
Chapter 3: Computational Model of the Eye ...55
3.1. Eye Model ... 56
3.2. Fluid-structure interaction coupling/arbitrary lagrangian-eulerian ... 60
3.3. Penetrating to the eye globe under blunt loading ... 63
3.3.1. Penetrating test procedure ... 63
3.3.2. Finite element model of the eye ... 64
3.3.3. Numerical simulation ... 67
ii
3.3.4. Results ... 70
3.3.4.1. Experimental results ... 70
3.3.4.2. Finite element results ... 72
3.3.5. Discussions ... 74
3.3.5.1. Finite element results ... 74
3.3.5.2. Experimental results ... 82
Chapter 4: Application of the Anatomical-Based Eye Model in the Anterior and Posterior Injuries ... 104
4.1. Anterior injury (Tennis ball impact) ... 106
4.1.1. Model explanation ... 106
4.1.2. Results ... 109
4.1.3. Discussions ... 112
4.2. IOP alteration ... 116
4.2.1. Clinical explanation ... 116
4.2.2. Model explanation ... 117
4.2.3. Results ... 119
4.2.3.1. IOP variation results ... 119
4.2.3.2. Optic nerve head injury ... 123
4.2.4. Discussions ... 124
4.2.4.1. IOP variation ... 124
4.2.4.2. Optic nerve head biomechanics ... 127
Chapter 5: Conclusions ... 152
References ... 156
Acknowledgements ... 170
iii
NOTATION
FEM: Finite Element Method FSI: Fluid-Structure Interaction IOP: Intraocular Pressure
IVI: IntraVitreal Injection ONH: Optic Nerve Head
SEDF: Strain Energy Density Function
MRI: Magnetic Resonance Imaging
CT: Computational Tomography
1
Chapter 1
Introduction
2
1.1. Background
WHO Blindness Data Bank reported annually 55 million eye injuries throughout the world which around 2.3 and 19 million of them lead to bilateral and unilateral low vision or blindness, respectively [1]. Eye injuries usually imposing a severe over-pressure to the eye globe which can be accompanied by a temporary or permanent harsh injuries to the eye components. The most common injuries in this regard have been reported to be related to the corneoscleral perforation, sphincter pupillae tear, retinal dialysis and detachment, choroidal rupture, vitreous haemorrhage, and scleral rupture [2-4]. Since in almost all the cases understanding the detail of injury to the eye is not plausible to be studied experimentally in all the components of the eye, there is a need to find a suitable approach to allow to precisely measure the intensity of injury in each of the components. Numerical methods, such as Finite Element (FE), can be useful since it allows to compute the amount of stresses and deformations in all the components under various loading conditions.
1.2. Eye globe
The eye globe is a structure that composes a very small area of the face while is
the most vulnerable part of the face during the injury. The eye globe is consisted of
many different eye components, such as the iris, cornea, sclera, iris, lens, retina, optic
3
nerve, etc., as displayed in Fig. 1. Each component of the eye has its own performance accompanied with its own mechanical properties. In this section, it is aimed at understanding the anatomical location of each component of the eye to help to shed light on the interaction and load bearing of each component of the eye.
However, before that it was needed to know the location of each component of the eye in the globe to be able to not only propose a better eye model but also figure out the load bearing of each of components of the eye.
The sclera is a collagenous tissue which is the holder of the intra components of
the eye and covers most part of the eye components up to the end of the Optic Nerve
Head (ONH) [5]. However, any types of the loading whether from the inside or
outside of the eye due to its over-pressure can severely deform the anterior or
posterior components of the eye. The role of the sclera in this regard is deemed
important since it nourishes the optic nerve from its posterior side thru the ciliary
arteries [6]. In addition, it has been reported that the sclera has a crucial role in the
biomechanics of the ONH during the load applying to the eye globe [7]. On the other
hand, any deformation or dislocation in the attachment site of the optic nerve and
the sclera, namely ONH, can significantly affect the vision acuity [8]. Therefore, it
is of great importance to consider the role of sclera and its mechanical properties
directly into the eye to be able to investigate the injury to the ONH. The ciliary body
in here controls the shape and deformation of the lens as they are in direct contact
4
with each other. The complexity of the anterior components of the eye is presented in Fig. 2. The optic nerve transmits the signal to the brain for vision making thru its attachment site to the sclera, namely ONH. The aqueous body is a transparent fluid like material in the anterior side of the eye which maintains the intraocular pressure.
The lens is a biconvex transparent structure in the anterior side of the eye which is in charge of accommodating the curvature to provide a focusing in the macula in the end of the eye. The cornea also is a transparent structure of the eye which is a light focuser in the most anterior side of the eye. The iris is a thin structure in the anterior side of the eye which is in charge of proving a diaphragm for light absorption according to the level of light in the room. The vitreous body is a gel structure which fills the space between the lens and retina in the eye ball. Choroid is a thin vascular layer of the eye which is in charge of nourishing the circumference components of the eye.
1.3. Previous works 1.3.1. Eye models
Various eye models so far on a basis of Computed Tomography (CT)/Magnetic
Resonance Imaging (MRI) data as well as the anatomical features of the eye have
been proposed. Each of them has its own pros and cons. Since the dimensions of the
eye may vary according to the ethnicity of the people [9], using the CT/MRI data is
5
preferable to measure the anatomical characteristics of the eye according to the ethnicity or demographic condition of the local people. Hence, having CT/MRI data in this regard would help to establish a more suitable eye model for simulation purposes. On the other hand, the CT/MRI data may not be able to provide the detail anatomical and morphological characteristics of all the components of the eye and this may impose a difficulty into the eye model. There are four common well-known models of the human eye, including Uchio et al. [10, 11], Stitzel et al. [12], Rossi et al. [13], and Lovald et al. [14]. In the model proposed by Uchio, the shape of the sclera which is the most outer component of the eye was extracted from the CT/MRI data whereas the characteristics of the rest of the components, including scleral thinning and the nonlinear cornea, were obtained from the literature [15]. The lens was modeled as a rigid body with its mass accounted for. The presence of retina was ignored and the vitreous bodies were considered to be simple elastic. In addition, in their model some of the components of the eye were supposed to be made of a unique solid element with only a mass, such as the iris, ciliary body, and aqueous body.
Another issue is the lack of thorough validation for their proposed model. This was why the applications of their model to use for injury prediction in traumatic-impact scenarios were almost limited. The Uchio’s eye model is presented in Fig. 3.
Another model almost at the same time proposed by Stitzel et al. Their model
(Virginia Tech Eye Model (VTEM)) although did not consider some of the
6
components of the eye, such as the retina and iris, it was experimentally verified via a baseball impact to the eye. However, it should be noted that in their experimental verification, only the amount of stress as a result of injury in the anterior/exterior wall of the eye globe was computed. Therefore, the amount of stresses and deformations in the rest of the components have not taken into account and have not been compared which may affect the validity of the model. Since there was a fluid component in their eye model, their simulations were carried out on a basis of Fluid- Structure Interaction (FSI) approach. That is, the deformation of the aqueous body and vitreous body as the fluid components transferred to the other components of the eye as the solid components. The Stitzel’s eye model is displayed in Fig. 4.
Thereafter, Rossi et al. in 2011 proposed an eye model. Basically, this model was established on a basis of 3
rdmodel. That is, in this model exactly the same components that have been ignored in the 3
rdmodel were ignored. In addition, the mechanical properties of the lens and ciliary body were considered the same. The 3
rdmodel considered the role of zonule and ciliary body separately, however, in the Rossi’s model the role of zonule was ignored. In addition, no experimental analyses have been carried out to validate their proposed model. The Rossi’s FSI eye model is presented in Fig. 5.
Finally, in 2017 Lovald et al. performed a combination of FE analysis and
experimental estimation to shed light on the injury of the eye globe thru their
7
proposed eye model. The iris and retina were ignored in their model; and the vitreous body as well as aqueous body were considered to be a fluid cavity with a hydrostatic pressure. The model proposed by Lovald et al is presented in Fig. 6. The mechanical properties of the eye components in the eye models in addition to the provided information are listed in Table 1.
To sum up, it is understood that each eye model despite its ability to simulate the injury to the human eye, has its own lacking by not considering some of the components of the eye.
1.3.2. Sclera mechanical properties
To have suitable geometry or anatomical dimensions for an eye model, an eye model also needs to be enriched with a set of appropriate material models to be able to produce accurate reliable results. Sclera is a collagenous eye components which has a relatively high elastic modulus (1.66±0.35 MPa (Mean±SD)) among the other components of the eye. It also acts as a holder/container of the intra components of the eye when it subjects to a mechanical deformation during any types of injuries.
So far, there are substantial amounts of efforts to characterize the mechanical properties of the scleral tissue to be incorporated into FE models of the eye [16-20].
However, these studies whether mostly used animal samples or performed the test
under compressive loadings to have the quantities of the elastic or hyperelastic
8
properties of the sclera tissue. It was reported that the average porcine scleral modulus is 75% less than that of the measured one for the human tissue (0.65 ± 0.53 MPa versus 2.60 ± 2.13 MPa (Mean±SD), respectively) [16]. Therefore, using animal models instead of the human ones can affect the numerical outcomes of an eye model. Moreover, it is known that the sclera almost always subjects to a tensile loading during load bearing. Furthermore, it should be noted that the reported elastic modulus for the human sclera tissue varied considerably among the studies as 0.15- 0.83 [16], 0.2-0.5 [21], 2.6 [22], 2.9 [23], 358 MPa [24]. This variation among the elastic modulus can affect the numerical results of an eye model. For example, it has been reported that the stiffening of the sclera largely influences the IntraOcular Pressure (IOP) and, as a result, largely intensify the injury to the ONH [7].
Meanwhile, since the sclera is the only component of the eye which transfers the
load into the ONH [7], its mechanical properties substantially affect the vision acuity
[25]. In addition, all the results about the mechanical properties of the sclera tissue
only reported for single loading rate whereas it is known that the sclera subjects to
various loading at different rates according to the impacted object. Hence, it was
needed to distinguish the tensile mechanical properties of the human sclera tissue
under various loading rates to be able to propose a suitable eye model on a basis of
injuries’ loading rates. On the other hand, numerical modeling results so far revealed
9
that understanding the mechanical properties of the sclera would improve our knowledge about the ONH [26] and its effects on the surrounding tissues [27].
1.3.3. IOP increasing in the eye
It is obvious that all components of the eye involve to provide vision, but the cornea in the anterior and optic nerve in the posterior sides of the eye globe provide the most remarkable roles by power focusing and transferring electrical signals to the brain, respectively [28]. The cornea is also in charge of protecting the eye from outer matter and tolerates IOP from the inside. Consequently, it is anticipated that even a very trivial variation in the morphology of the cornea would considerably affect the performance and superiority of the vision [29].
The IOP in the aqueous body can change and induce substantial deformation in
other eye components, especially the cornea, lens, and the optic nerve. Regarding
the cornea, in a keratoconus cornea the localized loss of corneal thickness invoke the
weakened cornea bulges outward because of not being able to bear IOP in its back
side [30] which invokes gradually conical shape of the cornea and, as a result of that,
a blurred vision [31]. However, there is a lack of knowledge on the role of IOP
alterations on the structure and shape of the cornea and also other components of the
human eye.
10
1.4. Outline of this thesis
In this thesis, it was objective to propose a suitable computational anatomical- based model of the human eye to be used in eye injury simulation of both the anterior and posterior components of the eye. The anterior injury can be named as blunt trauma impact while the posterior injury can be called as increasing the IOP. Each of these injuries can subject the components of the eye to a severe deformation which are difficult to be diagnosed by ophthalmologists. Therefore, using another approach which can broaden the vision of doctors in this regard is of crucial important.
Numerical Finite Element (FE) method is this regard can be applicable since it allows to compute the amount of stresses and deformations in all the components of the eye in detail under various loading conditions. A suitable computational eye model not only should have benefitted from a set of proper mechanical properties and anatomical geometry, but also it should be experimentally and numerically verified. To strengthen the material parts of the model, the mechanical properties of the sclera were experimentally measured and incorporated into the model.
In chapter 2, it was pointed out that the sclera has a pivotal mechanical role in the
eye globe in terms of the load bearing as well as ONH biomechanics. The linear
elastic, nonlinear hyperelastic, and linear viscoelastic mechanical properties of the
sclera tissue were determined. In addition, since the cornea during the injury subjects
to various loading conditions, having the mechanical properties of the sclera at
11
various rates pave the way for us to propose a more accurate model accompanied with further accurate numerical outcomes.
In chapter 3, using the CT/MRI/literature data, an anatomical-based eye model was established which was consisted of the cornea, aqueous body, iris, lens, vitreous body, ciliary body, sclera, retina, optic nerve, intra and extraconal fats, and muscle.
Especially, the morphology of the cornea, iris/aqueous body, lens, vitreous body/retina/sclera, muscles’ head, and optic nerve were determined thru the CT/MRI data. In order to validate the accuracy of the model, the cornea subjected to penetrating test at various loading rates both experimentally and numerically.
Furthermore, to examine the advantage of our model, four different eye models according to the literature were also simulated and compared.
In chapter 4, the proposed anatomical-based eye model was used to investigate
the injury as a result of tennis ball impact as well as the IOP alteration. Regarding
the blunt trauma impact, a tennis ball at the speed of 69.29 m/s was shoot to the eye
and the amount of stresses and deformations in all the components of the eye as a
result of 1 mm deformation in the apex of the cornea were computed. In addition, in
order to consider our own measured mechanical properties of the sclera/optic nerve,
the impact was simulated at two different elastic moduli of the sclera/optic nerve,
including our data and reference data. Regarding the IOP alteration, three different
12
IOPs, including 10, 20, 30 mmHg, were applied in the aqueous body and the resulted stresses and deformations in the rest of the components were all computed.
In chapter 5, the conclusion of this thesis was provided. Our anatomical-based
eye model in the concurrent study has implications not only for computing the
stresses and deformations in the anterior and posterior eye components as a result of
mechanical deformation, but also for providing a medical insight for the
ophthalmologists to figure out the detail of injury to each components when
experimental diagnosis is not available.
13
Table 1. A comparison between the mechanical properties of the eye components among the eye models.
Eye
components Uchio Stitzel Rossi Lovald
Cornea Nonlinear
1E=1.5 MPa E=1.5 MPa Nonlinear
1Aqueous
body Solid mass EOS
3EOS
3Fluid
cavity
Iris Solid mass - - -
Ciliary body Solid mass E=11 MPa Bulk modulus=1000 MPa
E=11.2 MPa Lens Rigid body E=6.88 MPa Bulk modulus=1000
MPa
E=6.92 MPa
Zonules - E=357.78
MPa - E=3582
MPa Vitreous
body
Solid mass with a hydrostatic
pressure of 20 mm Hg (2.7
kPa)
EOS
3EOS
3Fluid
cavity
Retina - -
Shear modulus=0.035 MPa and Bulk modulus=1000 MPa
-
Sclera Nonlinear
2E=5.5 MPa E=28 MPa Nonlinear
2Nonlinear in here stands for the data point obtained from the stress-strain diagram.
EOS stands for equation of state.
1
Components with the same mechanical properties.
2
Components with the same mechanical properties.
3
Components with the same mechanical properties.
- Means this component was not considered in this eye model.
14
Fig. 1. The anatomical location of the eye from the side view [32]. Schematic
diagram of the human eye [33]. License Number: 4034620747868
15
Fig. 2. Anterior part of the human eye [34]. License number: 1990-2007.
16
Fig. 3. The eye model of Uchio et al. [10, 11]. License Number: 4034610711007
17
Fig. 4. The eye model of Stitzel et al. [12]. License Number: 4034620402562
18
Fig. 5. The eye model of Rossi et al. [13]. License Number: 4034620402562
19
Fig. 6. The eye model of Lovald et al. [14]
.License Number: 4034610083093
20
Chapter 2
Mechanical Properties of
the Sclera
21
In this chapter, it is aimed at experimentally measuring the mechanical properties of the human sclera tissue to be used for incorporating into our proposed human eye. As it was pointed out, the mechanical properties of the sclera due to its crucial role in holding the intra components of the eye are of vital important as well as its pivotal role in the ONH biomechanics. Once a foreign body severely hits the eye or any types of the pressure applies in each of the components of the eye, although the cornea is the first component which is being impacted and deformed, the sclera acts as a holder or container of the eye components to control the rupture/failure of the eye globe. In addition, due to the direct connection between the sclera and the optic nerve via the ONH site on one hand, and the essential role of the optic nerve in sending the information of the vision to the brain for the interpretation on the other hand, it is crucially needed to understand the sclera’s mechanical properties.
2.1. Sclera preparation, mechanical testing, digital image correlation technique
Thirty eye globes from fifteen human donors (age 42.25±7.14) (Mean±SD)
were obtained from the Eye Bank of Iran (Tehran, Iran) under the permission
from donors under the ethical rules of Legal Medicine Organization (LMO) based
on the 2008 Declaration of Helsinki. Eyes were free of known diseases and the
reason of death was not related to trauma according to the report of Medical
Doctors with Legal Medicine Board. All the eyes were obtained within 7 h of
22
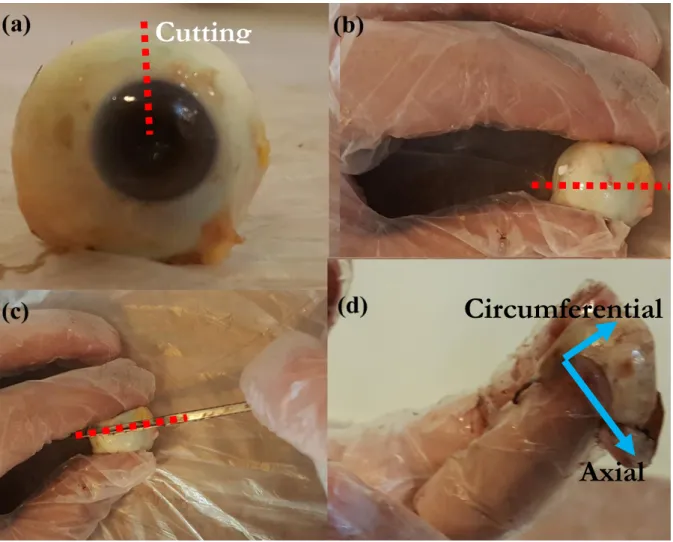
death. The eyes were stored in a dried-stilled bottle which has an especial application for carrying the human organs for transplantation. They were not frozen at any stage as well. Thereafter, each eye was removed from the bottle and prepared by eradicating the inner part of the ocular structures to only have scleral shell. The fresh eye globe, the location of dissection and its process as well as the scleral shell are illustrated in Fig. 7. All dimension measurements were carried out using a digimatic ruler with a resolution of 0.005mm±0.05% (Insize, Vienna, Austria).
Then, the samples were mounted on the testing machine (Santam,
Tehran/Hamburg, Germany) as presented in Fig. 8. The clamps were meanwhile
lined with dry sandpapers to assure a no-slip boundary for the tissue samples. In
addition to that, preload followed by eight cycles of preconditioning up to the
elastic region of the tissue, which helped to dissipate the residual stress of the
tissue, was applied to each sample before the test starts to ensure slip-free
boundary condition of the tests (Fig. 9). Furthermore, in order to provide a
condition as similar as possible to that of the human body, the mechanical tests
were performed at the temperature and humidity of 37°C and 53% (Wall and
Desk Hygrometers, W.W. Grainger, Inc, CA, United States), respectively. Then
and there, tests were performed at eight different strain rates, including 5, 10, 20,
50, 100, 150, 200, and 500 mm/min. The reason why we chose these strain rates
was that we aimed to have an understanding that how the sclera tissue will react
to the force at different rates, ranging from the lowest up to almost the highest.
23
Understanding of these mechanical properties under various rates of loading will help to have a better numerical eye model when it subjects to a blunt load at various rates. Because the rate of the applied load as a consequence of impact or any types of the injury may vary according to the speed of the impacted object.
For example, changing the pressure of the aqueous body can induce a sever deformation (still in the linear range of the tissue properties) in other components of the eye according to the amount of IOP at a very short time span. Therefore, measurement of the mechanical properties of the sclera under various loading rates would provide suitable range of properties for injury simulations.
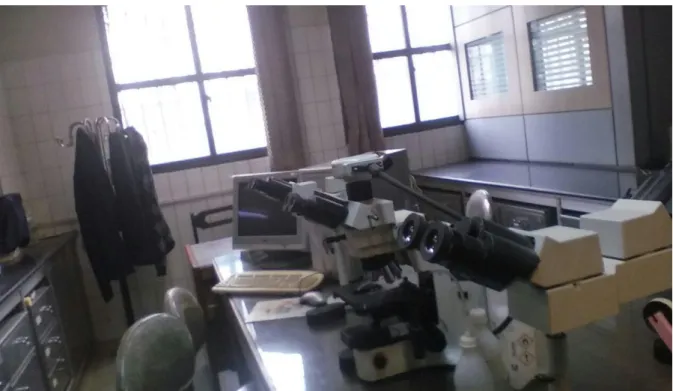
The tests were continued until the failure of the sclera tissue. Before the tests begin, the orientation of the collagen fibers in each of the sclera tissue histological images was determined. The images were taken via an optimized/customized optical microscope (Olympus DP73, Tokyo, Japan) as presented in Fig. 10.
The process was, before the uniaxial tensile test, the tissue samples were
inserted into a 4% buffered formaldehyde solution (pH 7:4) for fixation and
further histological investigation. Specimens were tried to be maintained their
planar geometry and sectioned serially at 5 μm in circumferential orientation. In
this way the fiber orientations in the (x
1, x
2)-plane could be seen on the
histological images, where x
1and x
2express the circumferential and the axial
directions as presented in Fig 11. A skilled histopathologist measured the
orientation of at least 28 representative collagen fibers in the scleral intra wall per
specimen from the histological images using Olympus Stream Image Analysis
24
software (OSIA). This software can easily and accurately with less than 0.5%
error, according to the device documentation, calculate the angle of each fiber component inside the histological images. Mean fiber angles and standard deviations were determined by assuming normal distribution and symmetrical arrangement with respect to the circumferential direction. The process of angle determination by the software was that, since the images took by the same software it could already know the dimension of the image. Thereafter, the images analyzed by the software of the microscope simultaneously. For example, an especial fiber in the sclera tissue wall was manually selected. The initial and end points of the fiber were then selected on the screen of the software. The software by itself drew a line between these two points. Then an imaginary x`
1axis was lined parallel to the main x
1axis (Fig 11). The angle between the imaginary axis and the drawn line between the two points was then named as the fiber angle. All the 28 reprehensive collagen fibers in the same way were distinguished and calculated in one image. This process schematically is illustrated in Fig 11.
Thereafter, the stress relaxation test was conducted using the same device used
for the tensile test. The stress relaxation test was started by measurement of the
thickness, preload and preconditioning, ramp up to relaxation point, and recovery
to the long term behavior of the tissue. The load in the tissue was recorded via a
50 kgf load cell. Load was applied up to the elastic region of the tissue and kept
for 1 minute. This also can be considered as a preload. Although samples were
25
cut at a suitable angle to avoid or at least minimize residual stress, the preload and cyclic precondition load can also help the tissue to dissipate the residual stress for further analysis. Lastly, the sclera allows to be freely releases its energy of stress for about 60 minutes of relaxation and its stress-time diagram was recorded for the rest of the study. The time was decided according to the lively measurement of the tissue’s behavior when a fully horizontal line is obtained.
This process is presented in Fig. 12.
In this study in order to measure the strain/displacement of the tissues at each position, the video cameras with the capture rate of 280 frame/second and the resolution of 2048×1088 pixels were employed. The Simi Motion® 2D/3D (Simi Reality Motion Systems GmbH, Max-Planck-Straße, Unterschleißheim, Germany) video camera software was also helped to lively measure the deformation of each marker in respect to the other ones as displayed in Fig. 13.
Simi Motion has marker based automatic tracking to calculate marker positions.
That is, the cameras focus on the tissue markers in a dark room. Thereafter, the
measurement starts by starting the load applying. Since the testing machine was
coupled with the measuring device system, by clicking the play both the load
processing as well as the cameras start to record the measurements. The markers
during the test on the wall of the sclera tissue relocated during applying the load
as demonstrated in Fig. 14. Thereafter, the software of the video camera
according to the location of the marker in the initial configuration and comparing
26
it to its current configuration measures the displacement in the markers of the sclera tissue as presented in this figure.
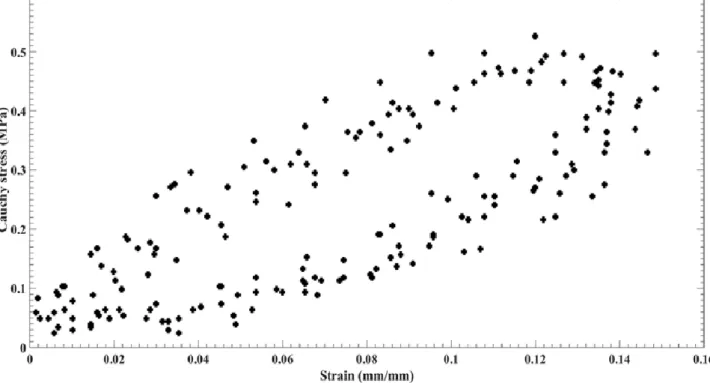
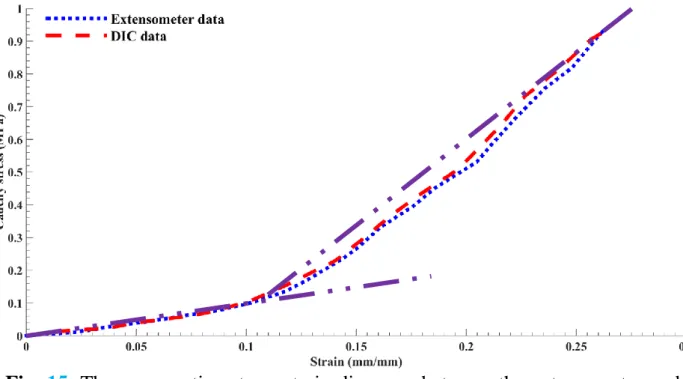
In addition to this device, the testing machine was also benefitted from an extensometer. In order to compare the findings of these two methods, the stress- strain diagrams with the extensometer as well as the Digital Image Correlation (DIC) method is displayed in Fig. 15. The stress-strain diagrams among two approaches in this case in the initial section of the diagrams were totally the same.
However, in the next section of the diagram is a bit different as the DIC data showed inconsiderably higher values. However, it should be pointed out in this case since the markers adhered to the sclera tissue wall, as a result, the measured displacement should be more accurate. In addition, In this way we can minimize the errors of the extensometer on the jaws of the machine at higher deformations.
2.2. Linear elastic and nonlinear hyperelastic models
The elastic modulus is the ratio of alteration in the stress values in respect to
the strain and, therefore, stands for the strength of a material. It defined as the
initial linear/Hookean section of the stress-strain diagrams of the tissue responses
to the applied load. The hyperelastic material model was employed to address the
nonlinear mechanical behavior of the sclera tissue. The experimental data was
used to regulate the material coefficients of the hyperelastic Strain Energy
Density Functions (SEDFs). Under the assumption that sclera tissue is an
27
incompressible and isotropic material [35, 36], a general polynomial isotropic constitutive form is as following:
𝑊 = ∑
𝑁𝑖+𝑗=1𝐶
𝑖𝑗(𝐼 ̅ − 3)
1 𝑖(𝐼 ̅ − 3)
2 𝑗+ ∑
1𝐷𝑖
(𝐽 − 1)
2𝑖𝑁𝑖=1
⋮ 𝑖, 𝑗 = 0,1, … , 𝑁 ⋮ 𝑖 +
𝑗 = 1,2, … , 𝑁 (1)
W is a function of two principal strain invariants only: W=W(I
1,I
2), where I
1and I
2are defined as [37]:
𝐼
1= 𝜆
12+ 𝜆
22+ 𝜆
23(2)
𝐼
2= 𝜆
12𝜆
22+ 𝜆
12𝜆
32+ 𝜆
22𝜆
32(3) Here, 𝜆
12, 𝜆
22, and 𝜆
32are the squares of the principal stretch ratios, linked by the relationship λ
1λ
2λ
3=1, due to incompressibility. C
ijis the material coefficients which are determined after curve fitting to the experimental data. D is almost 0 for the incompressible materials. Then the J is introduced as the Jacobean matrix which equals to the determinant of the deformation gradient which in here due to incompressibility is 1. This is according to the study which showed the Poisson's ratio values of 0.46-0.50 indicating the incompressibility of the sclera tissue [38].
The principal axes of strain and stress are lined up with the direction of tension (X
1) and two orthogonal axes (X
2and X
3). Because of symmetry and incompressibility, the stretch ratios are defined as:
𝜆
1= 𝜆 and 𝜆
2= 𝜆
3=
1√𝜆
(4)
where λ≥1 is the stretch ratio in the direction of tension. Moreover, Eqs. (2) and
(3) give
28
𝐼
1= 𝜆
2+ 2𝜆
−1and 𝐼
2= 𝜆
−2+ 2𝜆 (5) W just becomes the function of λ. During the experimental tension tests, the principal stretch ratio λ was measured from the experimental strain (e) by the following equation: λ=1+e. The stress is also calculated as the force/stress (S
11) tension per cross sectional area of the tissue measured by the load cell [39].
𝑆
11=
𝑑𝑊̃𝑑𝜆
, where 𝑊 ̃ (𝜆) ≡ 𝑊(𝜆
2+ 2𝜆
−1, 𝜆
−2+ 2𝜆) (6) The Yeoh (Eq. (8)), Ogden (Eq. (9)), and Mooney–Rivlin (Eq. (10)) material models were then described as following:
𝑊 = ∑
3𝑖=1𝐶
𝑖0(𝐼 ̅ − 3)
1 𝑖+ ∑
1𝐷𝑖
𝑁𝑖=1
(𝐽 − 1)
2𝑖(7) 𝑊 = ∑
𝜇𝑖𝛼𝑖
(𝜆 ̅̅̅
1𝛼𝑖𝑁𝑖=1
+ 𝜆 ̅̅̅
2𝛼𝑖+ 𝜆 ̅̅̅
3𝛼𝑖− 3) + ∑
1𝐷𝑖
𝑁𝑖=1
(𝐽 − 1)
2𝑖(8) 𝑊 = 𝐶
10(𝐼 ̅ − 3) + 𝐶
1 01(𝐼 ̅ − 3) +
2 1𝐷1
(𝐽 − 1)
2(9)
where J=det(F) and F is the deformation gradient. The terms, 𝐼 ̅
1and 𝐼 ̅
2are the
first and second invariants, respectively, of the left Cauchy-Green strain tensor,
B. For a normalized deformation gradient 𝐹̅ = 𝐽
−13𝐹̅ the Cauchy-Green strain
tensor assumes the form:𝐵 = 𝐹̅𝐹̅
𝑇. The principal stretch, 𝜆 ̅
𝑖is the eigenvalue of
𝐹̅ (deformation gradient). The polynomial coefficients, µ
i, α
i, and C
ijand a
iare
the material constants that were fit from the experimental data. As it was pointed
out, the nonlinearity of the tissue was examined through the three different strain
energy density functions, such as the Yeoh, Ogden, and Mooney-Rivlin, and their
coefficients were also calculated thru the linear/nonlinear unconstrained
29
minimization. The process goes as the experimental stress-strain diagram inputted into the programming code and, the employed SEDFs fitted to the experimental data. The parameters/coefficients in the material models were then determined and reported.
The material parameters of the hyperelastic models were numerically estimated via optimizing the stress-based nonlinear function
𝑓
𝑠= ∑ [(𝑆
11=
𝑑𝑊̃𝑑𝜆
) − 𝑆
11(𝑖)]
2𝑛𝑖=1
(10) where n is the number of experimental data in the uniaxial tensile test. In this equations 𝑆
11(𝑖)is the experimental data which we reported in the stress-strain diagram of the sclera tissue. The data in this regard is reported in Fig. 17.
min 𝑓
𝑠= ∑ [(𝑆
11=
𝑑𝑊̃𝑑𝜆
) − 𝑆
11(𝑖)]
2< 𝛿
𝑛𝑖=1
(11) where is a very small positive value. The objective is now to minimize the above f
sfunction by considering all the material coefficients and other parameters. The process of minimization was carried out using the Matlab optimization package.
In order to figure out whether the experimental boundary conditions as well
as the loads are validate enough or not, a comparative study between the
experimental results and that of the numerical ones through a FE model of the
uniaxial tensile setup along with the sclera tissue were carried out. According to
the size of the scleral tissues, the FE model was made with the length, width, and
thickness of 20, 13, and 1.5 mm, respectively. The experimental stress-strain data
(the ones calculated in the current study) at two different strain rates were then
30
assigned to the model. That is, the experimental curves as data points were inputted as the material properties of the sclera tissue in the FE code. Therefore, the sclera tissue in the model was behaved according to the experimental data.
Since the model was made according to the experimental data, it was aimed to investigate the outcome of its response to the applied load and boundary, and then compare the findings. The results were then compared to the experimental as well as the SEDFs data. Hence, a model was employed and the stress-time along with the strain-time results at the tracked nodes were recorded. Then, by the application of ‘combine’ algorithm in a commercial software, the stress-strain diagrams were plotted. However, it should be noted that due to the long simulation time, only the samples at the strain rates of 5 and 100 mm/min were simulated and compared. In addition to that, the agreement of the SEDFs in comparison to the experimental data was determined using the unconstrained linear/nonlinear minimization and the obtained results are plotted.
2.3. Viscoelastic model
The stress-relaxation test was performed to calculate the viscoelastic coefficients of this tissue via a Prony series. To do this, six samples were subjected to a 1 minute holding load and then let release their energy up to 60 minutes. The Prony series was employed is presented as following:
(12)
31
where G
∞is the long term relaxation coefficient (G
∞=lim
t∞G(t)) and G
icoefficients show the relaxation strength corresponding to the β decay constant [40, 41]. A compressive quasi-static load up to 60% of the sclera length was applied to the sclera and, then, it lets release its energy for up to 60 minutes. The viscoelastic coefficients were calculated from the hold region of the reduced relaxation function-time diagram via MATLAB v. R2014a (The MathWorks, Inc., Natick, MA, the United States). The fit was verified using the averaged coefficient of a determination (R
2).
The process of linear viscoelastic calculation from the stress-strain as well as stress-time of the tissue under the stress-relaxation load is presented in Fig. 16.
2.4. Statistical analysis
Analyses were based upon data values that were expressed as Mean±SD. Data from the tissues at different strain rates were compared using post hoc with the Scheffe method [42] with a significance of p< 0.05.
2.5. Results
The mean stress-strain diagrams of the sclera tissues at various strain rates,
i.e., 5, 10, 20, 50, 100, 150, 200, and 500 mm/min, are indicated in Fig. 17. The
load direction was set to the circumferential direction of the tissue since it is
known that the mean angle of collagen fibers is tend to be aligned in that direction
32
[43]. Each curve is the representative of three samples at a specific strain rate.
The stress-strain diagrams show the nonlinear behavior of the sclera tissue since it is considered as a soft connective biological tissue. The tissue results revealed that almost all the samples, regardless of the strain rates, failed at a similar strain value (50-65%). This suggests the insignificant role of the strain rate on the strain failure of the sclera tissue. The load in the samples was applied in the circumferential direction of the tissues which helps to be able to measure the stiffest mechanical response of the sclera tissue under various strain rates.
Considering the stress-strain diagrams, the elastic modulus as well as the maximum stress of the sclera tissues at eight different strain rates were calculated and plotted in Fig. 18. The results exhibited the highest amount of elastic modulus and maximum stress at the strain rate of 200 mm/min with 2.93 and 2.91 MPa, while the lowest ones were observed at the strain rate of 5 mm/min with 1.10 and 0.95 MPa. The scatter of the results showed the strain rate dependency of the sclera tissue which was predictable owing to the collagen content of this tissue.
That is, the elastic modulus and maximum stress of the tissue at the strain rate of 200 mm/min were 2.66 and 3.06 times higher than that at the strain rate of the 5 mm/min (p<0.05, post hoc Scheffe method).
The nonlinear stress-strain behavior of the scleral tissues under higher amount
of strain (0.15>~) implies that considering the sclera as a simple elastic material
is not enough. Therefore, three strain energy density functions, including the
Yeoh, Ogden, and Mooney-Rivlin, were examined to address the nonlinear
33
mechanical behavior of the sclera tissue. In addition to that, a FE model of the sclera tissue during load bearing was established to compare the experimental as well as the constitutive findings with that of the numerical ones as presented in the inset of Fig. 19a. The results for the strain rate of 5 and 100 mm/min are reported in Figs. 19a and 19b. To sum up, the data in these figures are showing the experimental stress-strain diagram, FE data which was extracted from the model that followed the experimental stress-strain diagram, and the SEDFs curves which were plotted according to the experimental data using nonlinear/linear unconstrained minimization algorithm. The FE results in here showed that the boundary conditions as well as the applied load in the experimental section can be well verified via the employed FE model. That is, the FE modeling results revealed that the nodes in the middle of the FE tissue model can illustrate a set of consistent stress-strain data points which are found to be in good agreement with that of the experimental ones. The hyperelastic material coefficients of the sclera tissue and summarized in Table 2.
The stress-strain as well as the elastic modulus and maximum stress data of
the scleral tissues at various strain rates revealed that the mechanical properties
of the sclera tissue are highly affected by the strain rate. That is, the mechanical
properties of the sclera tissue can be varied at various rates of load, and this
implies the viscoelastic behavior of the sclera tissue. The stress-time of the
samples were then quantified and reported in Fig. 20a. The normalized reduced
relaxation function was also calculated and illustrated in Fig. 20b. The
34
viscoelastic coefficients were computed using MATLAB code and depicted in Table 3.
2.6. Discussions
The material/mechanical properties of the sclera which is the outer coats of the eye are of increasing interest to some scientists as well as clinicians. It is because the mechanical properties of the sclera progress the surgical techniques that affect by the material/mechanical properties of this delicate soft material [44]. In addition, understanding the mechanical properties of the sclera in here would help to establish a more suitable eye model to be used for further accurate numerical simulations.
The stress-strain diagrams of the sclera well approved the nonlinear mechanical behavior of this tissue (Fig. 17) as it has been well approved by the previous studies [45, 46]. Since the load direction was aligned in the circumferential direction which is actually so close to the mean angle of collagen fibers, it was expected to have stiffer mechanical properties of the sclera. The elastic modulus and maximum stress values were then calculated from the linear Hookean regions and end of the stress-strain curves, respectively (Fig. 17). The highest elastic modulus as well as the maximum stress were observed at the strain rate of 200 mm/min with 2.92 and 2.91 MPa, respectively, while the lowest ones were seen at the strain rate of 5 mm/min with 1.10 and 0.95 MPa, respectively.
The results also showed strong strain rate dependency of the scleral tissue in a
35
way that, for instance, the elastic modulus and maximum stress at the strain rate of 500 mm/min are 2.48 and 2.12 times higher than that of the 5 mm/min. No meaningful relation between the rates of the strain and the values of elastic modulus and maximum stress was detected since these values at the strain rate of 200 mm/min, for example, is lower than that of the 500 mm/min (Fig. 18).
Similarly, the elastic modulus and maximum stress of the sclera tissue at the strain
rate of 20 and 50 mm/min were higher than that of the 100 mm/min. It has been
reported that the sclera’s elastic modulus varies between 1.8±1.1 MPa for the
posterior and 2.9±1.4 MPa for the anterior sides [16]. This is in good agreement
with our experimental results since they vary between 1.10 to 2.92 MPa. The
nonlinearity of this tissue was examined through three different SEDFs, such as
the Yeoh, Ogden, and Mooney-Rivlin, and their coefficients were also calculated
thru the nonlinear/linear unconstrained minimization (Table 2). The results
revealed the ability of the Yeoh, Ogden, and Mooney-Rivlin material models to
address the mechanical response of the tissue. Each material model has its own
advantage in modeling the soft biological tissues. The Ogden material model is
expressed in terms of the principal stretches while the Mooney-Rivlin is defined
as a function of the first and second invariant of the unimodular component of the
left Cauchy-Green deformation tensor. However, the Yeoh material model is just
based on the first invariant of the deformation tensor and this is why it is called
the reduced polynomial model. Since very soft tissues, such as the brain [47, 48],
has a profound nonlinear response to the mechanical load, Ogden material model
36
is highly common. On the other hand, the materials such as arterial tissues [49]
can fit with Mooney-Rivlin material models. This is the reason why this study three different material models were examined. Furthermore, the numerical FE data well approved the ability of the Mooney-Rivlin material model to define sclera’s mechanical behavior. The reason is that Mooney-Rivlin material model enables to consider the role of the function of the first and second invariant of the left Cauchy-Green deformation tensor which in this study because the load was applied in the stiffest direction of the sclera tissue, this material model enables to have a better presentation of the tissue response. However, the Ogden model was based on the principal stretches which were failed to have a tangible understanding of tissue response. Similarly, since the Yeoh material model was just based on the first invariant of the deformation tensor, its results could not capture the nonlinear stiff mechanical response of the tissue. Due to a very long simulation time, only two samples, one of the low range (5 mm/min) and one from the high range (100 mm/min) strain rates were chosen and simulated.
Although in the case of 5 mm/min, the FE data as well as the Ogden data were diverged from the experimental data, in almost all the locations of the curve the results are in good agreement with each other (Fig. 19).
The results showed that a significant amount of energy of the sclera was dissipated within 60 minutes (Fig. 20). That is, the initial stress of the sclera was started with 0.7 MPa, then it continues to decrease by the value of (G
1+G
2+G
3)e
-β
, and finally reached to 0.03 MPa after an hour which is defined as the long-time
37
shear modulus. This implies the time-dependency mechanical behavior of the sclera tissue (Table 3). The summation of the exponential factor in here must be 1 to show the accuracy of the fitting approach.
Different material models would have different outcomes in the FE models since the deformation of the materials are strongly related to their stiffness/compliance. In a FE model according to the objective of a modeling, different material models can be employed. As the elastic and hyperelastic material models are almost using for the small and large deformations, respectively, employing them in the designated models are preferable. However, since the sclera presented a time-dependent mechanical behavior under the applied load, the application of viscoelastic model could be reasonable.
Therefore, in the impact simulations, which there is a very short simulation time, the application of the viscoelastic material model might not be accurate enough to be considered. The experimental histological analysis of the present study (Fig.
17 inset) revealed that the mean angle of collagen fibers is 63.86±4.12
(Mean±SD) degree in respect to the longitudinal axis. It means that the collagen
fibers in the scleral tissue are mostly aligned in the circumferential direction, and
this can lead to higher/stiffer mechanical properties for the sclera tissue in this
direction. As it was pointed out, the mechanical properties of the sclera out of this
section was assigned to the eye model proposed in the next chapter under various
strain rates. Having the mechanical properties of the sclera tissue under various
rates also helped to be able to simulate the penetrating on a basis of impact rate.
38
In addition, as it was pointed out, the mechanical properties of the sclera have key
asset in ONH biomechanics as well as visual acuity, and generally eye
performance.
39
Table 2. Hyperelastic material coefficients of the sclera at various strain rates.
Mooney-Rivlin C
10C
01C
20C
11C
025 0.255 -0.234 -1.046 0.569 1.727
10 3.019 -2.886 -1.474 5.352 -5.934
20 0.509 -0.465 0.925 -3.150 2.794
50 4.016 -4.110 -1.751 5.719 -5.946
100 0.152 -0.151 -1.015 2.706 -1.392
150 4.856 -5.007 -2.979 9.915 -9.968
200 4.185 -4.232 -1.329 5.118 -6.218
500 -0.886 0.941 2.112 -7.480 7.312
Ogden µ
1µ
2α
1α
2-
5 11.457 -11.441 1.993 1.387 -
10 1.626 -1.244 1.795 -6.932 -
20 16.139 -16.087 0.007 -0.492 -
50 1.869 -2.081 5.084 -12.078 -
100 7.888 -7.878 2.356 1.916 -
150 1.873 -2.066 4.228 -10.295 -
200 1.634 -1.523 3.178 -7.641 -
500 21.505 -21.604 -0.085 -0.509 -
Yeoh C
10C
20C
30- -
5 0.0317 1.019 -1.034 - -
10 0.274 0.122 -0.076 - -
20 0.088 0.276 -0.084 - -
50 0.102 0.697 -0.353 - -
100 -0.004 0.345 -0.105 - -
150 0.089 0.545 -0.244 - -
200 0.173 0.217 -0.046 - -
500 0.039 0.315 -0.096 - -
40
Table 3. Viscoelastic parameters of the sclera.
Material constants
0.03607±0.0004 G
∞(MPa)
0.1422±0.0012 G
10.1646±0.0016 G
20.7125±0.0029 G
30.7325±0.0022 β
0.9563
R
241
Fig. 7. (a) The fresh eye globe, (b and c) the process of globe dissection, and (d) final sclera shell. The axis in here shows the cut line.
Axial
Circumferential
Cutting
42
Fig. 8. The sclera tissue under the applied load. The upper jaw of the testing machine is moved at various strain rates while the lower jaw is fixed. The load cell as well as extensometer/DIC technique measured the force and displacement of the sclera tissue, respectively. The load-displacement curves lively appeared on the screen of the device and recorded for further mechanical analyses. In addition, three CCD cameras (280 frame/sec) helped us to have an accurate measurement on the detail of deformation in the tissue wall. The digimatic ruler in here was also used for the initial measurement of the jaws distance, tissue thickness, etc.
Hand controller
43
Fig. 9. The preconditioning of the sclera tissue was applied up to the elastic region
of the tissues.
44
Fig. 10. The microscope and its CCD camera set used for the histological analyses.
The Olympus Stream Image Analysis Software (OSIAS) was also used to
measure the fiber angles.
45
Fig. 11. The histological image was analyzed using the OSIA software. An specific fiber was selected on the tissue wall. Manually the initial and end points of the fibers were selected. The software automatically draws a line between these two points and also provides an imaginary axis parallel to the main axis. The angle between these the line and the axis was calculated as the a and reported.
Whole process carried out by an expert histopathologist.
10±1 mm
Point 1
Point 2 Collagen
fibers
Line between two
points
X
1X
2X`1
a
2 0 ±1 mm
46
Fig. 12. The ramp, relaxation, and recovery. The load was applied on the tissue
and allowed to be released for 60 minutes. The time of releasing was chosen
according to the least amount of difference compared to the horizontal line in the
tissue.
47
Fig. 13. The schematic of the sclera tissue under the applied load. The markers were placed on the tissue wall and their relocation comparing to their initial distance were measured lively.
Marker 1
2±0.1 mm
2±0.1 mm 6±0.1 mm
Marker 2
Fixed jaw
Movable jaw
48
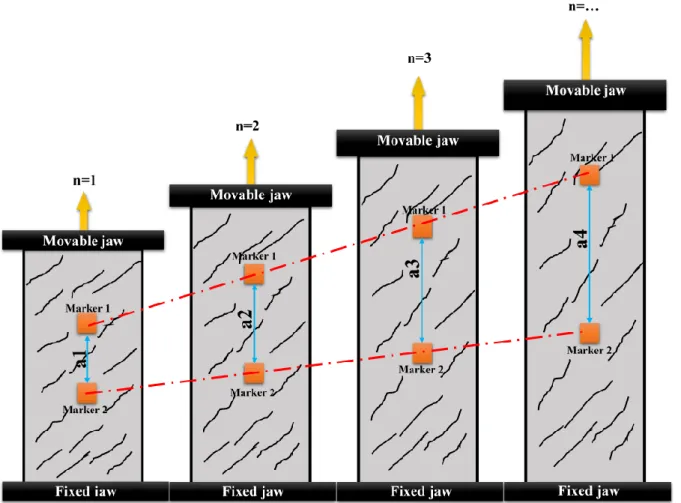
Fig. 14. The schematic of the marker’s movement on the tissue wall. The ‘n=1’
is the initial stage and this stage can continue up to the tissue failure point (n
final).
The ‘a’ stands for the distance between the markers which is changing during
load applying on the tissue wall. The a
1is the initial distance while the a
finalis the
distance between the markers at the final point.
49
Fig. 15. The comparative stress-strain diagrams between the extensometer and
DIC methods.
50
Fig. 16. The process of linear viscoelastic calculation from the stress-strain as
well as stress-time of the tissue under the stress-relaxation load.
51
Fig. 17. The mean stress-strain diagrams (each curve is the average of three
different sample curves) of the sclera tissue under various strain rates. Moreover,
the histological image of the sclera (the inset of the figure) before applying the
load is demonstrated.
52
Fig. 18. A comparative bar chart of the elastic modulus as well as the maximum stress of the sclera tissue at various strain rates. The amount of elastic modulus and maximum stress at the rate of 200 mm/min are significantly higher than that of the other rates of loading (p<0.05). In addition, these amount at the strain rates of the 10, 20, 50, 100, and 150 mm/min are higher than that of the 5 mm/min.
The amount of elastic modulus at the strain rate of 200 mm/min is not
significantly higher (p>0.05) than that of the 500 mm/min while the amount of
maximum stress is significantly higher (p<0.05).
53
Fig. 19. The uniaxial stress-strain responses of the sclera tissue at the strain rates
of (a) 5 and (b) 100 mm/min from the examined strain energy density functions
compared to the experimental as well as the finite element results. The number of
subjects (N=15) and the number of specimens (N=30). A finite element model of
the sclera tissue under the uniaxial tensile load was also established to compare
the numerical and constitutive findings with that of the experimental ones (the
inset of panel a).
54
Fig. 20. The (a) stress-time response of the sclera tissue was measured through
the stress-relaxation test. The (b) normalized reduced relaxation function versus
time was also quantified and plotted. The number of subjects (N=3) and the
number of specimens (N=6).
55
Chapter 3
Computational Model of
the Eye
56
![Fig. 1. The anatomical location of the eye from the side view [32]. Schematic diagram of the human eye [33]](https://thumb-ap.123doks.com/thumbv2/123deta/9921467.1921226/19.918.139.789.125.808/fig-anatomical-location-eye-view-schematic-diagram-human.webp)
![Fig. 3. The eye model of Uchio et al. [10, 11]. License Number: 4034610711007](https://thumb-ap.123doks.com/thumbv2/123deta/9921467.1921226/21.918.114.809.115.746/fig-eye-model-uchio-et-al-license-number.webp)
![Fig. 4. The eye model of Stitzel et al. [12]. License Number: 4034620402562](https://thumb-ap.123doks.com/thumbv2/123deta/9921467.1921226/22.918.117.802.112.893/fig-eye-model-stitzel-et-al-license-number.webp)
![Fig. 5. The eye model of Rossi et al. [13]. License Number: 4034620402562](https://thumb-ap.123doks.com/thumbv2/123deta/9921467.1921226/23.918.265.661.109.719/fig-eye-model-rossi-et-al-license-number.webp)
![Fig. 6. The eye model of Lovald et al. [14] . License Number: 4034610083093](https://thumb-ap.123doks.com/thumbv2/123deta/9921467.1921226/24.918.124.782.131.715/fig-eye-model-lovald-et-al-license-number.webp)