On Survey Data Analysis in Corporate Finance
著者 Serita Toshio
出版者 Institute of Comparative Economic Studies, Hosei University
journal or
publication title
Journal of International Economic Studies
volume 22
page range 97‑111
year 2008‑03
URL http://doi.org/10.15002/00003137
On Survey Data Analysis in Corporate Finance
October 7, 2007
Toshio Serita
Professor of Economics, Aoyama Gakuin University
Abstract
Recently, survey data analysis has emerged as a new method for testing hypotheses and for clarifying the relative importance of different factors in corporate finance decisions. This paper investigates the advantages and drawbacks of survey data analysis, methodology of sur- vey data analysis such as questionnaire design, and analytical methods for survey data, in comparison with traditional large sample analysis. We show that survey data analysis does not replace traditional large sample analysis but complements it and derive a new theory based on new realistic assumptions which are consistent with the results of survey data analysis.
1. Introduction
In the area of corporate finance, there are many competing theoretical models and hypotheses based on these models. In the area of payout policy alone, hypotheses include free cash flow, the pecking order, the lifecycle, signaling, catering, etc. One of the reasons for this proliferation is that none of the models have great explanatory power regarding firms’ finan- cial decisions. Consequently, there are many puzzles and unexplained facts. Recently survey data analysis has been used to test hypotheses in corporate finance. Three papers by Graham and Harvey – Graham and Harvey(2001), Brav et.al. (2005), and Graham-Harvey- Rajgopal(2005) – established a method for testing hypotheses in corporate finance. They are very impressive papers and each won honors.1Before them, there were several papers using survey data analysis but they were small surveys and/or had simple questions which did not permit the testing of hypotheses or the elucidation of important factors. The three papers by Graham and Harvey are different from past survey researches in that they are more rigorous in testing hypotheses and explaining managers' motives in financial decisions.
Recently we conducted two surveys for Japanese firms. One is Serita-Hanaeda(2007), a survey on perceptions of stock price and financial actions particularly on stock splits and on changing the minimum unit of one trade(kukuri-naoshi). The other is Hanaeda-Serita(2007), a survey on the payout policies of Japanese firms comparable to the U.S. firms by Brav et al.(2005). From the two surveys we learned much about survey data analysis.
Purpose of this paper is to summarize the features and methodology of survey data analy-
©2008 The Institute of Comparative Economic Studies, Hosei University
1Graham and Harvey (2001) is a winner of the Jensen Prize for the best corporate finance paper published in the Journal of Financial Economics. Brav et al. (2005) is a winner of the Jensen Prize for the best corporate finance paper pub- lished in the Journal of Financial Economics. Graham and Harvey and Rajgopal (2005) is a winner of the 2006 FARS (Financial and Reporting Section) best paper award, American Accounting Association.
sis based on our experiences with the previous two surveys. We describe the features of survey data analysis and provide some notes regarding questionnaire design and survey implementa- tion. Our hope is that this will help researchers conducting new surveys in corporate finance to compare survey data analysis with traditional large sample analysis. (Hanaeda-Serita(2007) and Ueno-Baba(2005)).
Survey data analysis in corporate f inance started from the pionieering work of Lintner(1956). Lintner interviewed managers from 28 firms and examined their target for the long-term payout ratio in the determination of dividend policy. He found that dividend policy was determined conservatively with reference to long-term sustainable earnings and was smoothed over several years. After Lintner(1956), there were a number of survey data analy- sis. Baker et al.(1985) is a survey on stock splits, and Trahan and Gitman(1995) examine understanding, utilization, and research preferences of financial management decision-making techniques by financial managers.
The three papers by Graham and Harvey obtained further results for the testing of hypotheses, which are the core of large sample analysis and found interesting results. Graham and Harvey(2001) surveyed 392 CFOs about the cost of capital, capital budgeting, and capital structure. They found both reassuring and puzzling results. The NPV principle and CAPM are widely used. More than half of respondents use firm risk rather than project risk in evaluating new investments. The pecking order and trade-off capital structure hypotheses are somewhat supported, but there is little evidence that is consistent with asset substitution, asymmetric information, transactions costs, free cash flows, and personal taxes hypothesis. Brav et al.(2005) reexamine Lintner’s results including stock repurchases surveying 384 financial executives and conducting 23 interviews. Lintner's results that the perceived stability of future earnings still affects dividend policy is supported, but the effects are weaker 50 years on.
Many managers now favor stock repurchases because of their flexibility in payout policy.
Management views provide little support for agency, signaling, and clientele hypotheses of payout policy. Graham and Harvey and Rajgopal (2005) survey financial executives' opinions and motives for earnings management and voluntary disclosure. They find that executives have a strong preference for smooth earnings.
There are few survey researches for testing hypotheses on Japanese firms. Serita- Hanaeda(2007) survey 773 financial executives in Japanese listed firms to elucidate percep- tions on stock prices and financial decisions as stock splits and payout policy. Hanaeda- Serita(2007) survey 658 Japanese firms to examine the payout policy of Japanese firms.
Many of their questions are similar to Brav et al.(2005) and are useful as an international comparison of U.S. and Japanese firms. Japanese firms do not pay cash to investment by reducing cash dividends, and the dividend is independent of investment decisions. This is sim- ilar to U.S. firms. Dividends and repurchases are not substitutes. This result is different from U.S. firms.
This paper is organized as follows. In Section 2, we examine the effectiveness of survey data analysis. In Section 3, we describe the methodology of survey data analysis in corporate finance are described. In Section 4, we introduce two empirical researches, and compare tests of hypotheses by survey analysis with large sample analysis in corporate finance. We offer a summery and some concluding remarks in the final section.
2. Features of survey data analysis
In this section, we describe the features of survey data analysis as compared to traditional large sample analysis.
2.1 Overview of survey data analysis
There are many types of financial decisions. They include payout policy(dividend/stock repurchase), capital structure, stock splits, fund-raise, etc. These can all be measured with financial data. Most financial researchers attempt to test hypotheses or the predictions which a theoretical model implies by analyzing cross-sectional variation or time-series variation in financial data. For such researches, many type of econometric methods for analyzing financial data were developed. However, there are many puzzles in corporate finance which theoretical models cannot explain. Recently, survey data analyses have been paid attention to for solving puzzles because survey data analysis has unique features that traditional large sample analysis does not have.
Survey data analysis is used to test propositions in corporate finance by conducting a sur- vey in the form of a questionnaire. Survey data are far different from financial data. Financial data are used to quantitatively measure and analyze firms' financial decisions. They include stock price data and financial data collected from annual reports. On the other hand, survey data is collected from surveys of firms. Answers to a survey reflect firms’ ideas related to their financial decisions, which can not be collected from financial data.
The purpose of survey data analysis is to examine what firms think as they make finan- cial decisions, to find important factors behind financial decisions, to test the hypotheses implied by theoretical models. Most questions in survey data analysis are set up to test hypotheses by asking questions directly related to the hypotheses.
2.2 Traditional large sample analysis
Before discussing survey data analysis, we explain the features of traditional large sample analysis. Most empirical researches in corporate finance are based on large sample analysis using stock prices and/or financial statements data in the form of time series data, cross-sec- tion data, and pooled data. The statistical tests validate or reject testable hypotheses. In researches on corporate finance, we can acquire a huge amount of financial data through data- bases. We perform large sample analyses using the financial data to test hypotheses. A variety of econometric methods such as multiple regressions, logit or probit analysis can be used for large sample analysis. When we test whether a financial variable is caused by certain factors, we often use multiple regression analysis. When analyzing qualitative dependent variables such as a financial decision variables (1 or 0), logit or probit analysis are useful tools for test- ing hypotheses.
The principle for large sample analysis is to statistically test the signs of coefficients in estimated equations. The signs of the coefficients are predicted by a model and the consisten- cy with the model is tested. The huge number of samples from financial databases strengthens confidence in the tests. The samples are all listed companies or samples of companies which took a particular action upon which the research focuses. It is easy to collect large samples by accessing financial databases such as CRSP, COMPUSTAT, and Nikkei NEEDS.
When testing hypotheses implied by a theoretical model, we do not need to know what firms think or the reasons for their actions or to know whether assumptions based on a theory are correct. We can only test the predictions derived from theoretical models. This is a very
famous idea among empirical researchers, and is known as the “as if ” thesis (Friedman (1953)). When we get empirical results which are consistent with a model in a large sample analysis, we can be satisfied with the predictability of the model. In large sample analysis, we can explain financial decisions by firms using financial data.
Large sample analysis has major advantages in testing hypotheses. First, we can achieve results with a high level of confidence on the test of hypotheses using sophisticated economet- ric methods. The larger the amount of samples, the more confidence we can have on the results of the statistical testing. Secondly, we can test hypotheses using many different datasets by many different estimation methods, and this strengthens the results of the tests. For exam- ple, there are several hundred papers which tested CAPM. This large number of tests of CAPM has been developed based on new models or econometric methods.
On the other hand, there are some drawbacks to large sample analysis. They are: 1) the weak power of tests, 2) variable selection and misspecification in estimated equations, and 3) unexplained motivations.
First, let us examine the weak power of tests. Even when we achieve empirical results that are consistent with a theoretical model, the result does not necessarily mean that the model holds. The power of tests is weak in many empirical researches. Another problem relating to the power of tests is that hypotheses to be tested are often not mutually exclusive. For exam- ple, consider tests of hypotheses in payout policy. Both the Pecking order and free cash flow hypotheses predict that the debt ratio has a negative impact on dividends/repurchases. If we find a significantly negative coefficient of debt ration in an estimated equation, we cannot identify which hypothesis holds. The tests based on large sample analysis are indirect. The results may be consistent with a theory but the theory may still be incorrect.
A second drawback is variable selection and misspecification in estimated equations. To test hypotheses derived from a model, we need to specify the variables which can be formed from the financial data. Models give us general suggestions on variable selection, but do not suggest the specification of variables to use in actual estimations. For example, firm size can be measured by sale, number of employees, market capitalization, etc. When we use interest rate, there are many interest rates. We have to select a specific interest rate (e.g. short term rate as the treasury bill rate). In particular, when we want to use a notional measure such as liquidity, we have to find a proxy. Liquidity has a variety of meanings. We always confront problems of misspecification in regression analysis. Inappropriate choice of the proxies may lead to incorrect empirical results.
The last drawback is concerned with unobservable motivations. We cannot ask qualitative questions on the relative importance of competing hypotheses in large sample analysis. In some cases, large sample analyses cannot assess which theory best fits the data because key variables may be proxies for multiple theories. Different hypotheses can be tested only when the rule is changed by testing some changes before and after the rule is changed. For example, they are tax reforms or changes in tender offer rules, etc.
2.3 Advantages and drawbacks of survey data analysis
Survey data analysis has some advantages over large sample analysis. Firms’ reasoning for financial decisions cannot be observed from financial data. Financial data only gives us numerical data on firms’ actions. Information on reasoning can be obtained by directly asking firms in a survey for their opinions on questions such as dividends, stock repurchases, stock splits, raising funds, etc. This is the biggest advantage of survey data analysis. We can get a new type of data from such surveys. From the new data, we can: 1) determine the relative
importance of factors in financial decisions which a model implies, and 2) discover new behaviors or new explanations for financial decisions of firms.
We can use a survey to determine the relative importance among factors that a model implies. Large sample analyses statistically test whether a factor is significant. This dichotomy is not always sufficient for testing a hypothesis. The relative importance of different factors is an important aspect in testing a hypothesis since competing hypotheses are not mutually exclusive. We can ask qualitative questions, determine the relative importance by asking for ranks within factors, or determine the degree of importance using some scale (e.g. – 2 (not at all important) to +2 (very important)). For example, we can examine the effect of stock price on stock repurchase.
As for the discovery of new behaviors or new explanations for firms financial deci- sions, we can test whether assumptions based on various theories are appropriate or not using survey data analysis. This may lead to a new model or help improve an existing one by chang- ing assumptions to make it consistent with survey data analysis. The new or improved model may make better predictions. For example, Serita and Hanaeda (2007) examined whether Japanese firms that are concerned with the absolute level of their stock price tend to keep high prices. That tries to explain why Japanese firms choose changing the minimum unit of one trade (kukuri-naoshi) rather than do stock splits. Firms’ perceptions on the absolute levels of stock prices are difficult to examine without surveys or interviews. Another example is crite- ria for investment. There are several criteria for decisions on investments (capital budgeting) such as NPV, IRR, pay back, and accounting profit. It is impossible to identify which criterion firms use in making investment decisions. Not only one but more than one criterion might be used. Only survey data analysis can clarify the frequency or relative importance of the criteria.
Through survey data analysis, we can derive more realistic assumptions which can help to build richer theories. Scrutinizing assumptions is important for theorists. For example, the cost of capital based on CAPM states as follows:
E (Ri) = RF+biE (RM).
CAPM assumes perfect capital markets, and what factor (short sale restriction, tax, transaction costs, asymmetric information) must be considered can be shown by survey analysis, by ask- ing the degree of importance of each factor.
There are, however, limitations to survey data analyses. They are: 1) low response rate and non-response bias, 2) high implementation costs, and 3) inappropriate answers from respondents.
Large sample analyses use available samples of financial data. Ideally, survey data analy- ses should use as many samples as possible to increase the confidence level of the hypothesis testing. However, surveys often have a low response rate. Low response rate raises two prob- lems; low confidence for analyses of small samples and a non-response bias. Responding firms may not represent the whole population (all listed firms). There may be significant dif- ferences between responders and non-responders. This is called a non-response bias. Methods for checking for a non-response bias are explained in the following sections.
Survey data analysis involves high implementation costs. The costs are printing costs, mailing costs, and costs of making database from raw survey sheets. The three papers by Graham and Harvey use websites for surveys. Websites make responding easier and allow the easy conversion of data into a database, saving printing and mailing costs. However, addition- al costs are required for setting up the websites. We cannot always get the same sample from
the same survey because results depend on the timing. To get time invariant results, we need to conduct surveys at regular intervals.
Inappropriate answers from respondents are also a serious problem in survey data analy- sis. There are three causes for inappropriate answers. They are: inappropriate respondents, misunderstanding of questions, and deliberately false answers.
The best respondent is a CFO because the CFO is responsible for making financial deci- sions. However, CFOs are generally too busy to answer surveys. Graham and Harvey (2001) succeeded in getting CFOs to respond. Brav et al. (2005) sent surveys to persons who held senior executive positions such as CFO, treasurer, and controller. Serita and Hanaeda sent to questionnaires to financial divisions or IR departments and got response from executives in those divisions. These respondents may not make financial decisions, but may understand the consensus on financial decisions.
No matter how carefully a survey is designed, questions will inevitably be misunderstood.
In this case, we fail to get expected responses from the questions. To avoid misunderstandings, we can conduct several trials using beta versions of questionnaires before using the final ver- sion.
Respondents may not answer truthfully because they have a weak incentive to give true answers or may hide for the truth on questions relating to agency problems. In such cases, respondents may choose safe answers such as “textbook answers.” Agency problems are one of the most important factors which explain managers’ decisions in corporate finance. It is difficult to test hypotheses related to agency problems using survey data analysis.
Overall, there are many advantages of survey data analysis compared to large sample analysis, but the drawbacks cannot be ignored. Table 1 summarizes the features of both survey data analysis and large sample analysis. Survey data analysis is not a replacement for tradi- tional large sample analysis but complements it and derives new theories based on new realis- tic assumptions which are consistent with the results of the analyses. We can extend empirical researches into survey data analysis in most areas of corporate finance.
Table 1. Summary of the Features of Survey Data Analysis and Large Sample Analysis
3. Methodology for survey data analysis in corporate finance
In this section, we describe the methodology of survey data analysis including survey design, delivery and collection of surveys, and analytical methods.
3.1 Questionnaire design
To make the statistical analysis easy and save response time, most questions should be multiple choice questions. There is a tradeoff between response time and number of questions.
Response times in most researches are set to less than thirty minutes. The number of questions is chosen to fit a specified response time.
Typical surveys in corporate finance are composed of three parts: 1) past financial deci- sions and perspectives, 2) the main questions for testing the hypotheses, and 3) characteristics of respondent firms.
In the first section of the survey, questions look at past financial decisions and perspec- tives on corporate finance. For example, “Is the current stock price of your firm correctly val- ued” or “Has your firm made dividends/stock repurchases within the past three years?” These questions are used for cross analysis for the main questions. Table 2 shows an example of questions and summary table of perspectives on corporate finance in Sereita and Hanaeda (2007).
The second section is composed of the main questions for testing the hypotheses. As shown by the three papers by Graham, questions should be formulated based on the theories and stylized facts to test the theory or to get important factors for financial decisions. The goal of the survey is to minimize biases induced by the questionnaire and maximize the response rate (Brav et al. (2005)).
The answers are “strongly agree” to “strongly disagree” based on closed-end statements, and relative importance of factors implied by a theoretical model. For example, if we want to ask whether firms tend to avoid reductions in dividends, the closed-end statement is: “There are negative consequences to reducing dividends” (Brav et al. (2005)). Ratings are based on a scale from -2 (strongly disagree) to +2 (strongly agree). When examining the importance of factors related to stock repurchases, we can provide a list of factors such as “stability of future earnings,” “availability of good investment opportunities,” “personal taxes,” etc., using a [-2,
Table 2. Perceptions of the Respondents on Corporate Finance
Q1. What is your most important financial goal?
Hanaeda-Serita (2007) Table 3 1 Sales growth
2. Market capitalization 3. ROA
4. Oprating profit/Sales 5. ROE
6. Current net profit 7. Others No response
9.3%
2.0%
10.0%
30.1%
17.6%
12.7%
15.4%
2.9%
Q2. Which is more important, the interests of shareholders or employees?
1. Shareholders 2. Employees 3. No opinion No response
22.5%
17.0%
60.3%
0.2%
Q4 What were your firm’s payout policies in the last 3 years?
1. Dividends 2. Repurchases
3. Dividends and repurchases 4. No payout
No response
59.1%
0.5%
33.3%
7.1%
0.0%
Q7. Which is more important, isolated or consolidated accounting in decisions on dividends?
1. Isolated 2. Consolidated 3. No opinion No response
46.0%
42.3%
11.3%
0.5%
Q3. How is your firm’s stock price valued?
1. Highly undervalued 2. Slightly undervalued 3. Correctly valued 4. Slightly overvalued 5. Highly overvalued 6. No opiniion No response
14.4%
49.5%
20.5%
6.0%
0.9%
8.2%
0.5%
+2] scale. The scaling can clarify the relative importance of factors. Table 3 shows an example of statements related to hypotheses. Table 4 is an example showing questions and aggregated answers on factors.
The third part concerns the characteristics of respondent firms. They include questions on the CEO and financial characteristics. For the questions related to the CEO, the survey by Graham and Harvey (2001) asked questions regarding the CEO’s age, education, and tenure.
Financial characteristics are sales revenue, foreign sales, industry, ownership, number of Table 3. Statements on Dividends/Repurchases
Q6. Statements on dividends/repurchases
Hanaeda-Serita (2007) Table 6 (only statements)
(1) We make dividend/repurchase decisions after our investment plans are determined.
(2) Dividend/repurchase decisions convey information about our company to investors (3) We reduce dividends/repurchases if we need money for necessary investments
(4) Dividends/repurchase convey information on our firm's limited investment opportunities to investors (5) We keep retained earnings by reducing dividends/repurchases since retained earnings are the cheapest funds.
(6) We keep enough retained earnings by reducing dividends/repurchases since some part of current net profits belongs to employees.
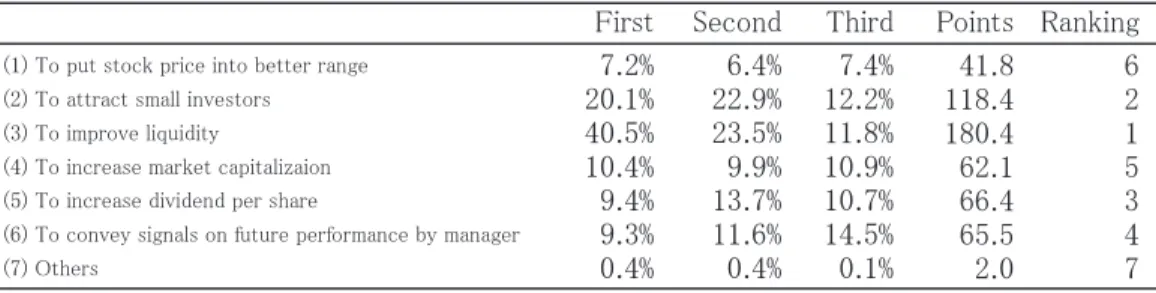
Table 4. Relative Importance of the Motives for Stock Splits
Table 5. Basic Questions on Respondents and the CEO
Q15. Your division
A) Attributes of respondents
Hanaeda-Serita (2007) Table 2 1. Finance division 2. IR/Public affairs 3. Others No response
23.8%
34.9%
25.6%
10.0%
5.4%
0.3%
Q16. Your job posion 1. Officer
2. Chief of division 3. Manager 4. Assistant manager 5. Others No response
Q17. Experience in decisions of payout policy 1. Dividends
2. Repurchase
3. Dividends and Repurchase 4. No experience
No response
36.1%
2.9%
28.5%
31.8%
0.6%
36.7%
44.4%
13.6%
5.2%
Q18. Age of the firm
B) Attributes of the firm and CEO
1. 0-9 years 2. 10-19 3. 20-29 4. 30-39 5. 40- no response
0.3%
3.4%
13.7%
34.9%
42.4%
4.2%
1.1%
Q19. Age of CEO 1. 20's 2. 30's 3. 40's 4. 50's 5. 60's 6. 70- No response
Q20. Carreers of CEO 1. Founder 2. Founder's family ÇRÅDRose through the ranks 4. Outside firm
5. Outside firm before CEO 6. Others
No response
22.7%
22.5%
30.2%
6.5%
14.8%
2.0%
1.2%
6.2%
9.4%
9.0%
13.9%
60.5%
1.1%
employees, credit rating, current stock price, and a number of financial ratios (long-term debt/total assets ratio, dividends per share, EPS, PER). Table 5 shows the questions on the characteristics of respondents and CEOs in Hanaeda and Serita (2007).
In implementing surveys, anonymity is an important issue. Most researches are conduct- ed anonymously because anonymity is important to ensure frank answer or to avoid a non- response bias. Serita and Hanaeda (2007) and Hanaeda and Serita (2007) conduct non-anony- mous surveys at the risk of inappropriate answers and a non-response bias. The benefits of conducting non-anonymous surveys are 1) the analysis can be made more fruitful by joining the survey data to the financial data, 2) response time can be saved by excluding questions on the characteristics of respondent firms 3) a basic summary of the survey data can be mailed to respondents, providing a small incentive to respond. There is a trade-off between ex-post cross analysis and the confidence of answers. In general, surveys should be anonymous, but non- anonymous surveys can be accepted for their analytical advantages. Table 6 shows the results of a non-anonymous survey carried out by Serita and Hanaeda (2007). In their analyses, answers are linked to the financial data.
Next we consider the completion of the final version of the questionnaire. A question- naire should be revised many times. First, it is helpful to try out the beta version on a few peo- ple in order to find problems in the draft questionnaire. It is better to get advice from market- ing experts during the second stage, as did Graham and Harvey (2001). Revisions can be made on the wording of questions, number of choices, and number of questions. After the completion of the final version, it is useful to make several types of survey whose questions are the same but where the order of questions is different. The device is used in Brav et al.
(2005), and it is important to test the difference among types to check whether respondents become burned out before they complete the survey.
3.2 Delivery and collection
After the final version of a survey is completed, the firms to which the surveys will be delivered are specified. It is better to have a large number of firms, because a larger number of respondents makes the results more robust. In general, response rates have been low in past surveys. For example, Trahan and Gitman (1995) report a response rate of 12% in a survey mailed to 700 CFOs. Graham and Harvey (2001) obtained a 9% response rate for 4,400 faxed surveys, Brav et al. (2005) had a 16% response rate, Serita and Hanaeda (2007) had 21.9%, and Hanaeda and Serita (2007) had 17.3% in all Japanese listed firms.
The nest issue involves the delivery of surveys. Surveys can be sent by mail, by e-mail, or Table 6. Statements on Stock Splits
by fax. Delivering surveys to the proper address is important for getting responses. Serita and Hanaeda (2007) and Hanaeda and Serita (2007) sent questionnaires to the finance division or IR division, and received responses from the CFO or from a subordinate (in a management position) in one of those divisions. There are some devices that can be used to improve the response rate. The timing of the delivery is important. For Japanese firms, it is better to avoid the end of the accounting term (usually at the end of March and September). Follow-up letters are also effective.
The final issue involves interviews. Survey data analysis can also be based on interviews.
Interviews are also important when implementing a survey. Interviews make it easier to inter- pret survey responses and to determine what respondents think of the questions, and they can include open-ended questions. On the other hand, interviews are difficult to rigorously quanti- fy, and it is difficult to collect a sufficient number of homogeneous samples. Interviews play an auxiliary role in surveys.
3.3 Methods of analysis
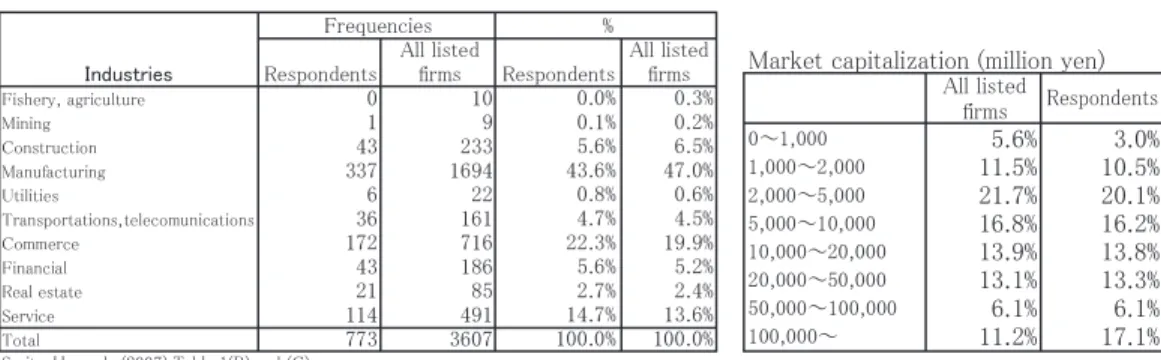
Survey analyses begin with a check for the existence of a non-response bias. There are two methods to identify such a bias, proposed by Wallace and Mellor (1988) and Moore and Reichert (1983). Wallace and Mellor (1988) compare the responses of firms that returned the survey on time to those that did not return the survey by the deadline. The firms that missed the deadline are similar to non-responding firms. Moore and Reichert (1983) investigate a possible non-response bias by comparing the characteristics of responding firms to those for the population at large. If the characteristics between the two groups match, then the sample can be thought of as representing the population. Table 7 is an example of a check of the rep- resentativeness of responding firms, similar to Moore and Reichert (1983), involving a com- parison of responding firms with the population.
Survey analyses can adopt a number of analytical tools that are different from those in large sample analyses. The main tools use the scores from scaled questions regarding state- ments and determinants of financial decisions. Statistical tests look at average scores and test the difference in mean score between different groups. The relationship between survey responses and firm characteristics are examined. The conditions used include the CEOs’ age, PER, industry, PBR, sales, etc. Analyses based on cross table are also useful. Table 8 shows an example of a cross table from Serita and Hanaeda (2007).
Other statistical methods related to the testing of hypotheses are introduced in the next section.
Table 7. Comparison of All Listed Firms and Respondents
□
4. Comparison between survey data analysis and large sample analysis in test- ing hypotheses on Japanese payout policy
In this section, we examine the difference between survey data and large sample analysis shown in Section 2, using two empirical researches: Hanaeda and Serita (2007) (thereafter HS) ad Ueno and Baba (2005) (thereafter UB), both focusing on Japanese payout policy. The four competing hypotheses on payout policy are presented in both SH and UB; 1) free cash flow, 2) pecking order, 3) life cycle (called maturity in UB), and 4) signaling.
4.1 Results of Ueno and Baba (2005)
UB use three approaches to test the hypotheses. They are: 1) dynamic adjustment model (multiple regression), 2) binomial logit model, and 3) nested logit model. The dependent vari- ables of the dynamic adjustment model are dividends/total assets and total payout/total assets.
Those of the binomial logit model are choice variables for dividends, stock repurchase, and total payout. These choice variables take 1 if implemented, and 0 if not implemented. The dependent variables of the nested logit model are choice variables for dividends, stock repur- chase, and total payout. These choice variables take 1 if they increased, 2 if there was no change, and 0 if they decreased.
The following explanatory variables are taken from financial data:
1) Operating profits/total assets
2) Coefficient of variance of operating profits 3) Size (log of total assets)
4) Growth rates of sales
5) Ratio of book to market value of total assets 6) Interest-bearing debt/equity capital
7) Relative stock price change (the past one year stock return–TOPIX return)
Each hypothesis is tested from the sign of the estimated coefficient of the explanatory variables in estimated equations. The predicted signs for each hypothesis are as follows.
According to the free cash flow hypothesis, the coefficient of 1) is positive because more profitable firms accumulate more free cash flow. The coefficient of 6) is negative because free cash flows are lower for firms with a high debt to equity ratio.
According to the pecking order hypothesis, the coefficient of 1) is positive because firms with greater profitability have more retained earnings, and these earnings can be paid to divi- dends or stock repurchases. The coefficient of 2) is negative because firms with larger profit volatility tend to avoid dividends or stock repurchases, preferring to use finds for future investment opportunities. The coefficient of 3) is positive, 4) positive, 5) positive, and 6) neg- ative.
The life cycle (maturity) hypothesis states that 3) is positive, 4) negative, and 5) negative.
The signaling hypothesis implies that 5) is negative for dividends and positive for repurchases, Table 8. Cross Table of the Two Statements
Serita-Hanaeda[2007] Table 13 Q11-1. We should keep stock price in a range using stock splits.
Agree Disagree Total
(18.5%) (81.5%) (100%) 88 388 476
Q4. Firms with higher stock prices are more excellent
Agree Disagree No opinion Total
(24.7%) (75.3%) (100%) 18 55 73
(15.7%) (84.3%) (100%) 33 117 210
139 620 759
and 7) is negative for dividends and positive for repurchases. Table 9 summarizes the four hypotheses and their predictions on the signs of the explanatory variables.
Overall, each hypothesis is tested not by the sign of one coefficient but by a group of signs of coefficients. The hypotheses are not mutually exclusive, as explained in Section 2.
The results of UB are consistent with the free cash flow and pecking order hypotheses.
4.2 Results of Hanaeda and Serita (2007)
HS tests the same three hypotheses using survey data analysis. The survey includes direct statements and determinants of the hypotheses to firms. The results are shown in Table 10 and 11. First, the free cash flow hypothesis is tested. According to the hypothesis, important fac- tors determining dividends and stock repurchase are extra cash and good investment opportu- nities. The survey of HS has two questions related to this hypothesis. One is Q5(3), “have extra cash/liquid assets relative to our desired cash holdings,” and the other is Q5(10), “good investment opportunities are available.” The average score is 0.01 for Q5(3) and 0.14 for Q5(10) in dividends. This is not consistent with the free cash flow hypothesis. For repurchas- es, the average score is 0.23 for Q5(3) and 0.27 for Q5(10), showing weak support for the free cash flow hypothesis.
Table 9. Hypotheses and Predictions on Signs of Explanatory Variables
hypotheses
The left(right) is the sign for dividends(repurchases) Ueno-Baba(2005) Table 10
(1) Free cashflow (2) Pecking order (3) Maturity (6) Signaling
Operating profit/total assets
Coefficient variation of operating profit
Size Total asset growth
B/M of total assets
Interest- bearing debt
ratio
Relative stock price changes
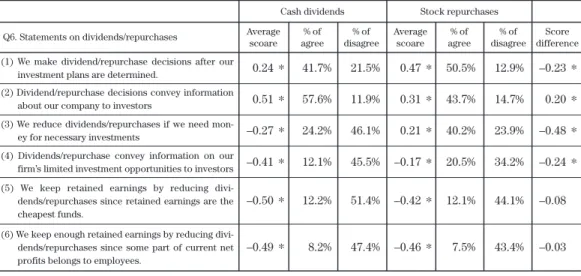
Table 10. Statements on Dividends/Repurchases Test on Mean Difference
Q6. Statements on dividends/repurchases Average scoare
*denotes a significant difference at the 5% level.
Hanaeda-Serita (2007) Table 6
0.24 0.51 –0.27 –0.41
–0.50
–0.49
41.7%
57.6%
24.2%
12.1%
12.2%
8.2%
21.5%
11.9%
46.1%
45.5%
51.4%
47.4%
50.5%
43.7%
40.2%
20.5%
12.1%
7.5%
12.9%
14.7%
23.9%
34.2%
44.1%
43.4%
*
*
*
*
*
*
0.47 0.31 0.21 –0.17
–0.42
–0.46
*
*
*
*
*
*
–0.23 0.20 –0.48 –0.24
–0.08
–0.03
*
*
*
*
% of agree
% of disagree
Average scoare
% of agree
Cash dividends Stock repurchases
% of disagree
Score difference (1) We make dividend/repurchase decisions after our
investment plans are determined.
(2) Dividend/repurchase decisions convey information about our company to investors
(3) We reduce dividends/repurchases if we need mon- ey for necessary investments
(4) Dividends/repurchase convey information on our firm’s limited investment opportunities to investors (5) We keep retained earnings by reducing divi- dends/repurchases since retained earnings are the cheapest funds.
(6) We keep enough retained earnings by reducing divi- dends/repurchases since some part of current net profits belongs to employees.
The predictions of the hypothesis are clearer for matured (low growth) firms. The differ- ence between high growth firms and matured firms from PBR was determined using a test of differences in the mean scores. No difference is found between the two groups.
Next, HS presents the results for the pecking order hypothesis. According to the hypothe- sis, internal funds are less costly than external funds. Questions related to the hypothesis are Q6(5), “we should keep more retained earnings by control dividends/repurchases because the cost of inside cash is lowest” and Q5(7) “costs for raising external funds.” On Q6(5), the aver- age scores are –0.50, and –0.42 for dividends and repurchases, both significantly negative. For Q5(7), the costs of external funds are not important for either dividends or repurchases. Thus, the pecking order hypothesis is rejected.
The third is the life cycle hypothesis. The hypothesis suggests that firms have different dividend policies depending on their growth stage. While growing firms pay no dividends but keep retained earnings, matured firms pay high dividends because they have few investment opportunities. A question related to the hypothesis is Q6(4), “dividends/repurchase convey information on our firm’s limited investment opportunities to investors.” In Q6(4), there is lit- tle agreement for either dividends or repurchases. The results do not support the life cycle hypothesis.
Finally, let us look at the signaling hypothesis. According to this hypothesis, managers use dividends and repurchases as a signal to convey information to investors. The questions concerning this hypothesis are Q6(2) and (4) for both dividends and repurchases, and Q12(2) and Q13(2) for repurchases only. Q6(2) states, “dividends/repurchases can convey inside information held by managers on increases of future profits to investors.” The average scores are significantly positive for both dividends and repurchases, and this is consistent with the hypothesis. Negative scores were found on Q6(4), meaning that dividends and repurchases have no negative effects.
Overall, the results of HS are different from UB. UB support the free cash flow and the pecking order hypothesis while HS does not. The signaling hypothesis is supported in HS, but is not in UB. Further empirical researches should be conducted to clarify the sources of differ- ent results between survey analysis and large sample analysis.
Table 11. Determinants of Dividends/Repurchases Test on Mean Difference
Q5. Determinants of dividends/repurchases Average scoare
*denotes a significant difference at the 5% level.
Hanaeda-Serita (2007) Table 4
0.20 1.06 0.01 –0.18 0.12 0.64 0.10 0.77 –0.06 0.14 0.39
44.4%
79.8%
27.5%
28.4%
32.7%
59.2%
26.9%
69.3%
23.3%
31.7%
46.5%
31.9%
4.8%
25.4%
35.6%
21.0%
4.8%
21.0%
7.0%
25.7%
21.1%
13.4%
18.8%
39.1%
38.7%
15.8%
22.2%
36.8%
27.3%
41.3%
30.6%
38.6%
44.9%
36.5%
15.5%
17.3%
36.2%
19.8%
11.8%
24.3%
11.9%
20.4%
15.8%
12.8%
*
*
*
*
*
*
*
*
*
–0.26 0.27 0.23 –0.34 –0.02 0.26 –0.05 0.31 0.10 0.27 0.39
*
*
*
*
*
*
*
*
0.46 0.79 –0.22 0.15 0.14 0.38 0.14 0.46 –0.16 –0.13 0.00
*
*
*
*
*
*
*
*
*
*
*
% of agree
% of disagree
Average scoare
% of agree
Cash dividends Stock repurchases
% of disagree
Score difference
(8) Keep consistency with the past dividends/repurch- ase policy
(1) A temporary change in earnings (2) A sustainable change of earnings (3) Undisposed extra cash
(4) Dividend/repurchase policies of competing firms (5) Taxes on dividends and capital gains
(6) Requests for current shareholders (7) Funding costs from outsides
(9) Avoid excess quity
(10) The availability of good investment opportunities (11) Avoid being a M&A target
5. Summary and conclusions
In this paper we investigated the effectiveness of survey data analysis in corporate finance. Survey data analysis has recently gained attention as a new method for testing hypotheses and clarifying the relative importance of different factors in corporate finance decisions. We examined the effectiveness of survey data analysis, methodology of survey data analysis, including questionnaire design, analytical methods of survey data, and comparisons with traditional large sample analysis.
Survey data analysis has some significant advantages over traditional large sample analy- sis. The first advantage is that asking direct questions allows us to grasp the ideas behind a firm’s financial decisions. This method also allows us to gain new types of data from surveys.
They allow us to: 1) determine the relative importance of factors in financial decisions implied by different models, and 2) discover new behaviors or new explanations for financial decisions. This may lead to new models or improve existing models by changing assumptions to make them consistent with the survey data. On the other hand, there are limitations to sur- vey data analysis. They are: 1) a low response rate and non-response bias, 2) high implemen- tation costs, and 3) inappropriate answers from respondents.
Next, we investigated the methodology of survey data analysis. Typical surveys in corpo- rate finance examine: 1) past financial decisions and perspectives, 2) main questions for test- ing hypotheses, and 3) the characteristics of respondent firms. In the main questions area, questions should be based on the theories and stylized facts to test theories or to determine important factors behind financial decisions. In the final section, we compared two approach- es looking at Japanese payout policy.
Survey data analysis does not replace traditional large sample analysis but complements it, and can be used to derive new theories based on new realistic assumptions that are consis- tent with survey data. So far, smaller number of researches based on survey data analysis has been conducted than researches based on large sample analysis, especially those testing recent hypotheses in corporate finance. A larger number of future studies using survey data analysis and large sample analysis will help confirm the past empirical results of survey analysis. This will contribute to the future development of new theoretical models.
References
Baker, H.K., Farrelly, G.E., Edelman, R.E. (1985), “A survey of management views on dividend poli- cy.” Financial Management, 78–84.
Brav, A., Graham, J.R., Harvey, C.R., Michaely, R. (2005), “Payout policy in the 21st century.” Journal of Financial Economics, 77, 483-527.
Friedman, M. (1953), The methodology of positive economics. In: Essays in Positive Economics.
University of Chicago Press.
Graham, J.R., Harvey, C.R. (2001), “The theory and practice of corporate finance: evidence from the field.” Journal of Financial Economics60, 187–243.
Graham, J., C. Harvey, and S. Rajgopal (2005), “The economic implications of corporate financial reporting.” Journal of Accounting and Economics, 40, 3-73.
Hanaeda, H. and T. Serita (2007), “Payout policy in Japanese firms: Tests by survey data analyses.” (in Japanese) Hitotsubashi University Department of Commerce Working PaperNo. 116.
Lintner, J. (1956), “Distribution of incomes of corporations among dividends, retained earnings, and
taxes.” American Economic Review46, 97–113.
Moore, J.S., Reichert, A.K. (1983), “An analysis of the financial management techniques currently employed by large U.S. corporations.” Journal of Business Finance and Accounting10, 623-645.
Serita, T and H. Hanaeda (2007), “Perception of stock prices and financial decisions in Japan.” (in Japanese) Gendai Finance, No. 21.
Trahan, E.A., Gitman, L.J. (1995), “Bridging the theory-practice gap in corporate finance: a survey of chief financial officers.” Quarterly Review of Economics and Finance35, 73–87.
Ueno, Y. and N. Baba (2005), “Determinants of payout policy by Japanese firms.” (in Japanese) Bank of Japan Working Paper Series, No. 05-J-6.
Wallace, R., Mellor, C. (1988), “Nonresponse bias in mail accounting surveys: a pedagogical note.”
British Accounting Review, 20, 131-139.