九州大学学術情報リポジトリ
Kyushu University Institutional Repository
Calculating the target exposure index using a deep convolutional neural network and a rule base
髙木, 剛司
http://hdl.handle.net/2324/4110441
出版情報:九州大学, 2020, 博士(保健学), 課程博士 バージョン:
権利関係:(C) 2020 Associazione Italiana di Fisica Medica. Published by Elsevier Ltd. All rights reserved.
Contents lists available atScienceDirect
Physica Medica
journal homepage:www.elsevier.com/locate/ejmp
Original paper
Calculating the target exposure index using a deep convolutional neural network and a rule base
Takeshi Takaki
a,b,⁎, Seiichi Murakami
c, Ryo Watanabe
b, Takatoshi Aoki
d, Toshioh Fujibuchi
eaDepartment of Health Sciences, Graduate School of Medical Sciences, Kyushu University, 3-1-1 Maidashi, Higashi-ku, Fukuoka 812-8582, Japan
bDepartment of Radiology, Hospital of University of Occupational and Environmental Health, Iseigaoka 1-1, Yahatanishi-ku, Kitakyushu-shi, Fukuoka 807-8555, Japan
cDepartment of Radiological Science, Faculty of Health Sciences, Junshin Gakuen University, 1-1-1 Chikushigaoka, Minami-ku, Fukuoka 815-8510, Japan
dDepartment of Radiology, University of Occupational and Environmental Health School of Medicine, Iseigaoka 1-1, Yahatanishi-ku, Kitakyushu-shi, Fukuoka 807-8555, Japan
eDepartment of Health Sciences, Faculty of Medical Sciences, Kyushu University, 3-1-1 Maidashi, Higashi-ku, Fukuoka 812-8582, Japan
A R T I C L E I N F O
Keywords:
Deep convolutional neural network Automatic image quality assessment Target exposure index
A B S T R A C T
Purpose:The objective of this study is to determine the quality of chest X-ray images using a deep convolutional neural network (DCNN) and a rule base without performing any visual assessment. A method is proposed for determining the minimum diagnosable exposure index (EI) and the target exposure index (EIt).
Methods:The proposed method involves transfer learning to assess the lungfields, mediastinum, and spine using GoogLeNet, which is a type of DCNN that has been trained using conventional images. Three detectors were created, and the image quality of local regions was rated. Subsequently, the results were used to determine the overall quality of chest X-ray images using a rule-based technique that was in turn based on expert assessment.
The minimum EI required for diagnosis was calculated based on the distribution of the EI values, which were classified as either suitable or non-suitable and then used to ascertain the EIt.
Results:The accuracy rate using the DCNN and the rule base was 81%. The minimum EI required for diagnosis was 230, and the EIt was 288.
Conclusion:The results indicated that the proposed method using the DCNN and the rule base could discriminate different image qualities without any visual assessment; moreover, it could determine both the minimum EI required for diagnosis and the EIt.
1. Introduction
Chest X-ray imaging costs less and exposes the patient to lower radiation doses than computed tomography and allows an assessment of a general view of the chest. For these reasons, it is the most fre- quently used imaging modality and the main diagnostic method for pulmonary diseases. However, although patients are exposed only to relatively low radiation doses when a chest X-ray examination is per- formed, the frequent use of the method can lead to large collective doses[1]. Teeuwisse et al. reported that chest X-rays account for ap- proximately one third of all diagnostic X-rays and that their estimated contribution to a patient’s collective dose is approximately 18% [2].
Similarfigures have been reported in other Western European countries [3,4].
The optimum X-ray dose for ensuring the required image quality has been extensively discussed in radiology. In particular, since the in- troduction of computed radiography in 1983, detector-absorbed doses
have been increasing[5]. This has led to an increase in image noise owing to insufficient exposure. Thus, to avoid a decrease in diagnostic ability, radiological technologists tend to increase the detector dose to a level that exceeds the required detector dose. This accounts for the exposure creep that have been reported[6]. Nevertheless, unlikefilm systems, computed radiography andflat-panel detector systems allow image processing, and thus the optimum detector dose cannot be de- termined from the intensity of the X-ray images.
To address these problems, the American Association of Physicists in Medicine (AAPM) and the International Electrotechnical Commission (IEC) have proposed the following indices: exposure index (EI), which is the estimated absorption amount that reaches the detector, target ex- posure index (EIt), which is the target EI value determined for each imaging site, and deviation index (DI), which is ten times the value derived by dividing EI by EIt[6,7]. The DI is used to determine whether the facility uses the optimum detector dose to obtain X-ray images, and detector dose management based on the DI has been proved effective
https://doi.org/10.1016/j.ejmp.2020.02.012
Received 13 November 2019; Received in revised form 17 February 2020; Accepted 18 February 2020
⁎Corresponding author.
E-mail address:[email protected](T. Takaki).
1120-1797/ © 2020 Associazione Italiana di Fisica Medica. Published by Elsevier Ltd. All rights reserved.
T
[8]; in a previous study, we developed a software package that calcu- lates the mAs values based on the DI of past images[9], and we de- monstrated its effectiveness. However, as the DI depends on the EIt, the detector dose and the required image quality must be considered when the EIt is set. Peters et al. emphasized the necessity of establishing the optimum exposure indices for clinicians rather than simply following manufacturers' guidelines[10].
A large number of studies have verified the correlation between dose and image quality[11,12]. In particular, the quality of an image is determined by its physical characteristics and by visual assessment.
However, physical characteristics such as the detective quantum effi- ciency[13,14]and image contrast[15,16]are still difficult to apply to clinical images, as the anatomical background has not been considered [1]. Moreover, analytical visual assessment methods, such as receiver operating characteristic curve analysis and visual grading character- istics analysis [17–24], are time-consuming and require advanced medical knowledge. Accordingly, they cannot be applied to large numbers of clinical images. Cohen et al reported that the mean value of the EI obtained from images stored in a picture archiving and com- munication system (PACS) was used to determine the EIt[25].
In this regard, Yuan et al. developed an image-based technique to assess the subjective quality of chest X-ray images [26], and it was demonstrated that physical qualities were correlated with expert as- sessment [26,27]. However, this quality assessment requires a com- prehensive approach that considers anatomical structures such as the lungfields and the mediastinum, and the correlation between the re- sults by the algorithm and the observed results may be quite compli- cated[28].
Recently, a computer-assisted detection/diagnosis system using deep convolutional neural networks (DCNNs) was developed for med- ical applications. This system has exhibited remarkable performance in natural image recognition[29–32]. Esses et al. reported that automatic image quality assessment could be performed on T2-weighted MRI images using a deep-learning architecture[33]. DCNNs are highly ef- fective in analyzing classification problems using supervised images.
However, to our knowledge, no studies have applied DCNNs to assess chest X-ray image quality or determine the EIt.
In the present study, we assessed the quality of chest X-ray images using a DCNN and a rule-based technique. The lowest detector dose required for diagnosis was defined as “minimum EI value”. We at- tempted to determine the minimum EI value required for diagnosis and the EIt using rating results.
2. Methods
2.1. Overview of the proposed method
Fig. 1shows an overview of the proposed method. The structures were manually segmented in the images. Using GoogLeNet, which was trained on general images, we created three classifiers by performing transfer learning of the lung fields, mediastinum, and spine. Subse- quently, we rated the image quality in each region, and we used the results to determine the overall quality of the chest X-rays by applying a rule-based technique, in which the rules were based on expert assess- ment of thefinal image. The EI value distributions of the chest X-ray images were classified as either appropriate or inappropriate, and these values were used to determine the minimum EI value necessary for diagnosis and then the EIt.
2.2. Dataset
The present study was conducted after the approval of the Institutional Review Board of the University of Occupational and Environmental Health was granted. The study involved 2000 chest X- ray images: 1174 from males and 826 from females (Table 1). All pa- tients were imaged at the Hospital of the University of Occupational
and Environmental Health using the FPD System AeroDR1717HQ (Konica Minolta Inc., Tokyo, Japan), and all images were processed using the CS-7 diagnostic imaging workstation (Konica Minolta Inc., Tokyo, Japan). The imaging parameters were as follows: source–image distance, 200 cm; 100 kV; and Cu, 0.1 mm. For all images, an automatic exposure control was used. All X-ray images were of healthy patients without pulmonary disease. Of the 2000 chest X-rays, 300 were used for DCNN training, and 1700 were used to assess the proposed method for determining the EIt. DCNN training was performed using trimmed images in which region-of-interest (ROI) of 20 × 20 pixels were ran- domly set at locations in the right lungfields, mediastinum, and spine.
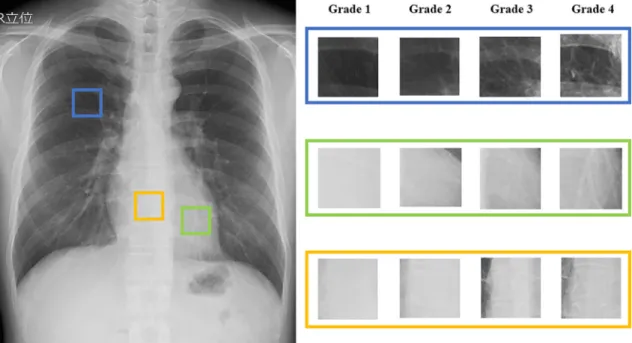
There were 1500 ROI images of the lungfield and mediastinum and 3000 ROI images of the spine. In particular, the discrimination results for the spine largely depend on the location of the ROI and the body thickness of the patient; thus, setting two ROI locations increased the available training data and improved accuracy. DCNN learning requires an excessively large number of training data. However, it is difficult to collect sufficient data from medical images. In this study, to prevent overlearning due to the lack of data numbers, we performed data augmentation to increase the learning data[34]. The data augmenta- tion used was image rotation using affine transformation. The rotation angleθwas set to +2 degrees and−2 degrees upon confirming the anatomical structure. We augmented the data thrice. In the final training, there were 4500 ROI images of the lungfield and mediastinum and 9000 ROI images of the spine. The supervision levels of the ROI images were rating-classified by experienced a chest radiologist with 14 years of experience using the European Guidelines on Quality Cri- teria for Diagnostic Radiographic Images[35–37](Table 2,Fig. 2).
2.3. DCNN learning
We independently trained three DCNN architectures for classifying the image quality of the lung, mediastinum, and spine on chest radio- graphy. The image quality was classified into four classes (Table 2) by each DCNN. DCNNs with a high generalization ability require large training samples, which is difficult to collect from medical images, re- sulting in degradation of the DCNN performance. Transfer learning is a method of diverting the DCNN model of one task to another task[38].
Models with a high generalization ability can be obtained even with small datasets by using transfer learning. As the network to be trans- ferred, we used the Google Net[39]of the winning team in ILSVRC 2014, which had pre-learned using ImageNet [40]. The GoogLeNet consists of a total of 22 layers that incorporate the 1 × 1 convolution, global average pooling, and Inception module technologies in addition to the convolution and pooling layers (Table 3). The last fully connected layer was replaced with a fully connected layer consisting of four units corresponding to the classes shown inTable 2. The output values of this DCNN were the occurrence probabilities of the four classes, and the maximum output value was used as the classification result. Three DCNNs used in this study were pre-learned using 1.2 million common images and thenfine-tuned on the lung, mediastinal, and spinal images, respectively. Fine-tuning of three DCNNs were performed using 4500, 4500, and 9000 ROI images of the lung, mediastinum, and spine on chest radiography, respectively (Table 4). DCNN training was per- formed in MATLAB R2018b (MathWorks Inc., Natick, Mass., USA) using a stochastic gradient descent and the following parameters: training rate, 0.0001; maximum number of epochs, 100; batch size, 32; mo- mentum, 0.9; and dropout rate, 0.5.
2.4. Creation of the rule base
The overall quality of the images was determined using a rule-based technique that employed the rating results obtained from the DCNN created using chest X-ray images according to Method 2.3.Fig. 3shows an overview of the rule base, which was created by experienced a chest radiologist with 15 years of experience using an image confirmation
T. Takaki, et al. Physica Medica 71 (2020) 108–114
109
procedure. The rules were created by considering the effects of various elements such as patient body thickness. First, the expert determined whether blood vessel shadows in the lungfields could be seen; then, a final assessment of the image quality was provided based on the spine and blood vessels in the mediastinum, considering elements such as patient body thickness. The cutoff scores for the final appropriate images were as follows: A score of at least 3 was assigned to the rating results for the lungfield rule base, a score of at least 2 was assigned to the rating results for the mediastinum, and a score of at least 3 was assigned to the rating results for the spine.
2.5. Discrimination capability of the proposed method
The discrimination capability of the proposed method was in- vestigated using 459 chest X-ray images out of a total of 1700 that were not used in DCNN learning, and by comparing the visual assessment obtained by two experts (each of whom had at least 14 years of
experience) that were not involved in Method 2.2 with that obtained through the proposed method. The visual assessments were conducted in accordance with the European Guidelines on Quality Criteria for Diagnostic Radiographic Images. We calculated the accuracy rate, sensitivity, and specificity of the proposed method as follows:
= +
+ + +
Accuracy TP TN
TP TN FP FN (1)
= + Sensitivity TP
TP FN (2)
= + Specificity TN
TN FP (3)
where the term“TP”is the number of true positives, the term“TN”is the number of true negatives, the term“FP” is the number of false positives, the term“FN”is the number of false negatives.
2.6. Method for determining EIt
Using the DCNN created from the 1700 chest X-ray images that were not used in DCNN learning and the rule base, we differentiated between appropriate and inappropriate images. Subsequently, using Eqs.(4) and (5), we calculated the correlation between the EI value and the number of normalized appropriate and inappropriate images obtained using that value.
=∑
Ratio of appropriate images appropriate images∑ Total number
EI
EI i i EI
i (4)
=∑
Ratio of inappropriate images inappropriate images∑ Total number
EI
EI i i EI
i (5)
where the term“appropriate imagesEIi” is the number of appropriate images obtained using an EI value ofithat was divided by bin, the term
“inappropriate imagesEIi” is the number of inappropriate images ob- tained using an EI value ofithat was divided by bin, and the term
“Total numberEIi”is the total number of appropriate and inappropriate Fig. 1.Overview of EIt calculation using the proposed method. Images were input into a DCNN created using lungfields, mediastinum, and spine images. Ratings were then obtained and used to differentiate appropriate and inappropriate images using a rule-based method. The EI was extracted from the DICOM tags of the images whose quality had been rated, and this was used to determine the minimum EI value required for diagnosis and then the EIt.
Table 1
Patients informations.
Range Mean Standard deviation
Age 21–92 67.7 13.6
Height (cm) 131–196 159.8 9.4
Weight (kg) 24.9–125.4 56.2 12.1
Exposure Index 99–872 229.7 51.5
Table 2
Rating classifications.
Appearance of target structure Rating score (Grade)
Indiscernible 1
Unclear 2
Clear 3
Sufficiently appropriate 4
images obtained using an EI value ifithat was divided by bin.
In the IEC62494-1 report [7], the International Electrotechnical Commission indicated that EI includes an error of under 20%. There- fore, we calculated EIt using the equation given below.
= × EIt 1 Point
0.8 is (6)
where thePointisis the intersection of the ratio of the appropriate and inappropriate images.
3. Results
3.1. Ability of the proposed method to distinguish appropriate images The proposed method had an accuracy rate of 81% (370/459), a sensitivity of 75%, and a specificity of 98% (Table 5).
3.2. Setting the EIt
Table 6shows both the EI values and the number of images de- termined to be appropriate or inappropriate using the DCNN and the created rule base.
Fig. 4shows the correlation between the EI value and the number of appropriate and inappropriate images normalized for each value. The ratio of the appropriate and inappropriate images intersected at an EI value of 230, and the calculated EIt was 288.
4. Discussion
In the present study, we proposed a method for discriminating ap- propriate images using a DCNN and rule base. The proposed method had an accuracy of 81%. In particular, the results indicated that the rule base used in this study had high accuracy in reproducing expert as- sessments of the image quality. In a previous study that made automatic image assessments using deep learning architecture, Esses et al. re- ported a concordance of approximately 76% between the expert and the algorithm, indicating that the technique was useful[33]. The proposed method had an accuracy rate comparable with that reported by Esses et al. Although the accuracy of the DCNN and the rule base should be further improved, both had a high degree of specificity and were well able to discriminate inappropriate images. Thus, we consider the pro- posed method highly effective, as it allows the assessment of several thousands of images. This has been impractical with experts. In the future, learning that uses a wide variety of images as well as automation of the fields to be discriminated may allow real-time image quality assessment after imaging is completed. The proposed method might be used for quality assurance (QA) purposes, such as inter-vendor com- parisons and collaborative multi-country efforts[41]. In order to use the proposed method for QA purposes, it is necessary to teach DCNN using a large number of images obtained from multiple vendors as the Fig. 2.Sample images of all rating grades Shown from the top are the rating results for the lungfield, mediastinum, and spine. The image size is 20 × 20 pixels. As the number of rating results increases, the method can more clearly differentiate target structures.
Table 3
Details of the model.
Layer Patch size Stride Depth Output size
Convolution 7 × 7 2 1 112 × 112 × 64
Max pool 3 × 3 2 0 56 × 56 × 64
Convolution 3 × 3 1 2 56 × 56 × 192
Max pool 3 × 3 2 0 28 × 28 × 192
Inception(3a) 2 28 × 28 × 256
Inception(3b) 2 28 × 28 × 480
Max pool 3 × 3 2 0 14 × 14 × 480
Inception(4a) 2 14 × 14 × 512
Inception(4b) 2 14 × 14 × 512
Inception(4c) 2 14 × 14 × 512
Inception(4d) 2 14 × 14 × 528
Inception(4e) 2 14 × 14 × 832
Max pool 3 × 3 2 0 7 × 7 × 832
Inception(5a) 2 7 × 7 × 832
Inception(5b) 2 7 × 7 × 1024
Avg pool 7 × 7 1 0 1 × 1 × 1024
Dropout 0 1 × 1 × 1024
Linear 1 1 × 1 × 1000
Softmax 0 1 × 1 × 4
Table 4
Training image dataset.
Rating 1 Rating 2 Rating 3 Rating 4
Lungfields 199 1467 1889 945
Mediastinum 485 948 1688 1379
Spine 1831 3283 2399 1487
T. Takaki, et al. Physica Medica 71 (2020) 108–114
111
training data.
The ultimate objective of the present study was to use the DCNN and the rule base to determine the EIt and minimum EI values required for diagnosis. In setting the appropriate EIt value, we recommend using images whose quality has been confirmed through visual assessment, which is therefore a necessity. Seeram reported a method to establish the optimum EIt value through the test and reference doses (different levels of exposure settings) evaluated on an anthropomorphic phantom [42]. However, phantoms cannot be used to assess different human body types and normal structures[43]. Accordingly, results obtained using phantom images may not be directly applicable to clinical images.
The EIt can also be determined using clinical images, but clinical da- tabases contain a complicated array of data involving both standard and non-standard body types. Therefore, to ensure accurate results, a large number of images is required. However, it is impractical to assess several thousands of clinical images visually, and therefore numerous facilities still prefer to use images in PACS for calculating the EIt rather than perform visual assessments. In the present study, a radiologist conducted visual assessment of images with an EI value of approxi- mately 240, which was the mean EI of the 1700 images. They com- mented that this was not appropriate for use as a target value. Indeed, when the EIt is determined without assessment of the image quality, the result includes the EI values of inappropriate images. Thus, an in- appropriate value may be set.
This process could be standardized using image quality results ob- tained from the dose irradiated into the detector. However, digital imaging systems cannot determine whether this dose is appropriate based on image density. For this reason, in the present study, we cal- culated the minimum EI value required for a diagnosis based on the DCNN and the rule base at the point of intersection (cutoffvalue) be- tween the appropriate and inappropriate images. We then set the EIt with a 20% margin. When the radiologist conducted the visual assess- ments, the EI value that allowed diagnosis was set to at least 270 for both the lungfields and the mediastinum. Although images with an EI value of 250 were still usable for lungfield diagnosis, there were more images in which mediastinum diagnosis was impossible. Accordingly, the proposed method may provide an alternative to the visual assess- ment performed by a radiologist. In particular, as several thousands of images can be analyzed using the DCNN and rule base, accuracy may be ensured, even in institutions with complicated databases. Therefore, the proposed method can be used to determine the EIt from clinical images, thus overcoming the difficulty of using phantoms. However, the radi- ologist should define thefinal EIt with reference to the EIt calculated by DCNN, even if the proposed method could evaluate the image quality for several thousands of images without visual assessment.
In the present study, we set the EIt to an EI value with an upper region margin of 20%. Further studies should be conducted on other methods. For example, 1SD and 2SD can be used as the optimal detector dose range. It is conceivable that high accuracy can be achieved using small numbers of images if the EIt is determined from a database that contains only standard body types. Accuracy should be improved through learning that uses both a wide variety of image data and DCNN architectures with even higher discrimination ability.
5. Conclusion
In the present study, the discrimination results obtained using the proposed method based on a DCNN and a rule base exhibited good concordance with human perception; moreover, this method can ex- tract the appropriate images without visual assessment. Thefindings indicate that the method can discriminate between appropriate and inappropriate PACS images—which was previously impractical—and determine both the minimum EI required for diagnosis and the EIt.
Fig. 3.Rule base used to determine the rating results. The rule base was created that would reproduce the image confirmation procedure used by the expert.
The mediastinum rule base considers the effect of patient body thickness.
Table 5
Concordance between expert and proposed method in chest X-ray images.
Proposed method
Appropriate image Inappropriate image Total
Expert Appropriate images 255 87 342
Inappropriate images 2 115 117
Total 257 202
Table 6
Number of images determined to be appropriate or inappropriate and their EI values.
Number of images
Exposure Index Range Mean Standard
deviation
Appropriate images 868 147–872 259 54
Inappropriate images 832 121–514 223 46
Total images 1700 121–872 242 53
Acknowledgments
We would like to express our gratitude to Dr. Yukunori Korogi, who provided us with this opportunity. We acknowledge the clinical staffof the Department of Radiology at the Hospital of the University of Occupational and Environmental Health for assistance with the data.
Declaration of Competing Interest
None.
Role of the funding source
This research did not receive any specific grant from funding agencies in the public, commercial, or not-for-profit sectors.
References
[1] Veldkamp WJ, Kroft LJ, Geleijns J. Dose and perceived image quality in chest radiography. Eur J Radiol 2009;72:209–17.https://doi.org/10.1016/j.ejrad.2009.
05.039.
[2] Teeuwisse W, Geleijns J, Veldkamp W. An inter-hospital comparison of patient dose based on clinical indications. Eur Radiol 2007;17:1795–805.https://doi.org/10.
1007/s00330-006-0473-1.
[3] McAdams HP, Samei E, Dobbins III J, Tourassi GD, Ravin CE. Recent advances in chest radiography. Radiology 2006;241(3):663–83.https://doi.org/10.1148/
radiol.2413051535.
[4] Daffner RH, Hartman M. Clinical radiology: the essentials. Lippincott Williams &
Wilkins; 2013.
[5] Matsunaga Y, Kawaguchi A, Kobayashi K, Kobayashi M, Asada Y, Minami K, et al.
Patient exposure during plain radiography and mammography in Japan in 1974–2014. Radia Prot Dosim 2017;176:347–53.https://doi.org/10.1093/rpd/
ncx017.
[6] Shepard SJ, Wang J, Flynn M, Gingold E, Goldman L, Krugh K, et al. An exposure indicator for digital radiography: AAPM Task Group 116 (executive summary). Med Phys 2009;36:2898–914.https://doi.org/10.1118/1.3121505.
[7] International Electronical Commission. Medical electrical equipment—exposure index of digital X-ray imaging systems—Part 1: definitions and requirements for general radiography, 62494-1.
[8] Dave JK, Jones AK, Fisher R, Hulme K, Rill L, Zamora D, et al. Current state of practice regarding digital radiography exposure indicators and deviation indices:
report of AAPM imaging physics committee task group 232. Med Phys 2018;45:e1146–60.https://doi.org/10.1002/mp.13212.
[9] Takaki T, Fujibuchi T, Murakami S, Aoki T, Ohki M. The clinical significance of modifying X-ray tube current-time product based on prior image deviation index for digital radiography. Phys Medica 2019;63:35–40.https://doi.org/10.1016/j.ejmp.
2019.05.011.
[10] Peters SE, Brennan PC. Digital radiography: are the manufacturers' settings too high? Optimization of the Kodak digital radiography system with aid of the com- puted radiography dose index. Eur Radiol 2002;12:2381–7.
[11] Uffmann M, Schaefer-Prokop C. Digital radiography: the balance between image quality and required radiation dose. Eur J Radiol 2009;72:202–8.https://doi.org/
10.1016/j.ejrad.2009.05.060.
[12] Schaefer-Prokop C, Neitzel U, Venema HW, Uffmann M, Prokop M. Digital chest
radiography: an update on modern technology, dose containment and control of image quality. Eur Radiol 2008;18:1818–30.https://doi.org/10.1007/s00330-008- 0948-3.
[13] Doi K. Diagnostic imaging over the last 50 years: research and development in medical imaging science and technology. Phys Med Biol 2006;51:R5–27.https://
doi.org/10.1088/0031-9155/51/13/R02.
[14] Samei E, Ranger NT, Dobbins JT, Ravin CE. Effective dose efficiency: an applica- tion-specific metric of quality and dose for digital radiography. Phys Med Biol 2011;56:5099–118.https://doi.org/10.1088/0031-9155/56/16/002.
[15] Norrman E, Geijer H, Persliden J. Optimization of image process parameters through factorial experiments using aflat panel detector. Phys Med Biol 2007;52:5263–76.https://doi.org/10.1088/0031-9155/52/17/011.
[16] Saito K, Hiramoto S, Gomi T, Muramoto N, Seki M, Tsukimura K, et al. Evaluation of chest and abdominal exposure dose appropriate for a digital image reader system incorporating a columnar-crystal structured phosphor plate and a contrast-detail phantom. Radiol Phys Technol 2008;1:238–43.https://doi.org/10.1007/s12194- 008-0035-0.
[17] Martin L, Ruddlesden R, Makepeace C, Robinson L, Mistry T, Starritt H. Paediatric X-ray radiation dose reduction and image quality analysis. J Radiol Prot 2013;33:621–33.https://doi.org/10.1088/0952-4746/33/3/621.
[18] Vodovatov AV, Kamishanskaya IG, Drozdov AA, Bernhardsson C. Quality assess- ment of digital X-ray chest images using an anthropomorphic chest phantom. J Phys Conf 2017;808.https://doi.org/10.1088/1742-6596/808/1/012009.
[19] Rochmayanti D, Murti Wibowo G, Fatimah, Nugroho Setiawan A. Implementation of exposure index for optimize image quality and patient dose estimation with computed radiography (a clinical study of adult posteroanterior chest and ante- roposterior abdomen radiography). J Phys Conf 2019:1153.https://doi.org/10.
1088/1742-6596/1153/1/012032.
[20] Alves AF, Alvarez M, Ribeiro SM, Duarte SB, Miranda JR, Pina DR. Association between subjective evaluation and physical parameters for radiographic images optimization. Phys Medica 2016;32:123–32.https://doi.org/10.1016/j.ejmp.2015.
10.095.
[21] Pavan ALM, Alves AFF, Duarte SB, Giacomini G, Sardenberg T, Miranda JRA, et al.
Quality and dose optimization in hand computed radiography. Phys Medica 2015;31:1065–9.https://doi.org/10.1016/j.ejmp.2015.06.010.
[22] Al-Murshedi S, Hogg P, England A. Relationship between body habitus and image quality and radiation dose in chest X-ray examinations: a phantom study. Phys Medica 2019;57:65–71.https://doi.org/10.1016/j.ejmp.2018.12.009.
[23] Sund P, Bath M, Kheddache S, Mansson LG. Comparison of visual grading analysis and determination of detective quantum efficiency for evaluating system perfor- mance in digital chest radiography. Eur Radiol 2004;14:48–58.https://doi.org/10.
1007/s00330-003-1971-z.
[24] Metz CE. ROC analysis in medical imaging: a tutorial review of the literature. Radiol Phys Technol 2008;1:2–12.https://doi.org/10.1007/s12194-007-0002-1.
[25] Cohen MD, Cooper ML, Piersall K, Apgar BK. Quality assurance: using the exposure index and the deviation index to monitor radiation exposure for portable chest radiographs in neonates. Pediatr Radiol 2011;41:592–601.https://doi.org/10.
1007/s00247-010-1951-9.
[26] Lin Y, Luo H, Dobbins JT, Page McAdams H, Wang X, Sehnert WJ, et al. An image- based technique to assess the perceptual quality of clinical chest radiographs. Med Phys 2012;39:7019–31.https://doi.org/10.1118/1.4760886.
[27] Samei E, Lin Y, Choudhury KR, McAdams HP. Automated characterization of per- ceptual quality of clinical chest radiographs: validation and calibration to observer preference. Med Phys 2014;41:111918https://doi.org/10.1118/1.4899183.
[28] Willis CE, Nishino TK, Wells JR, Asher Ai H, Wilson JM, Samei E. Automated quality control assessment of clinical chest images. Med Phys 2018;45:4377–91.https://
doi.org/10.1002/mp.13107.
[29] Liu F, Zhou Z, Samsonov A, Blankenbaker D, Larison W, Kanarek A, et al. Deep learning approach for evaluating knee MR images: achieving high diagnostic
Fig. 4.Correlation between EI value and the number of appropriate and inappropriate images normalized for each value. As the EI value increases, the number of inappropriate images decreases, and the number of appropriate images increases. The EI value at which the appropriate and inappropriate images in- tersected was 230.
T. Takaki, et al. Physica Medica 71 (2020) 108–114
113
performance for cartilage lesion detection. Radiology 2018;289:160–9.https://doi.
org/10.1148/radiol.2018172986.
[30] Anthimopoulos M, Christodoulidis S, Ebner L, Christe A, Mougiakakou S. Lung pattern classification for interstitial lung diseases using a deep convolutional neural network. IEEE Trans Med Imaging 2016;35:1207–16.https://doi.org/10.1109/
TMI.2016.2535865.
[31] Roth HR, Lu L, Liu J, Yao J, SeffA, Cherry K, et al. Improving computer-aided detection using convolutional neural networks and random view aggregation. IEEE Trans Med Imaging 2015;35:1170–81.https://doi.org/10.1109/TMI.2015.
2482920.
[32] Dou Q, Chen H, Yu L, Zhao L, Qin J, Wang D, et al. Automatic detection of cerebral microbleeds from MR images via 3D convolutional neural networks. IEEE Trans Med Imaging 2016;35:1182–95.https://doi.org/10.1109/TMI.2016.2528129.
[33] Esses SJ, Lu X, Zhao T, Shanbhogue K, Dane B, Bruno M, et al. Automated image quality evaluation of T2 -weighted liver MRI utilizing deep learning architecture. J Magn Reson Imaging 2018;47:723–8.https://doi.org/10.1002/jmri.25779.
[34] Hussain Z, Gimenez F, Yi D, Rubin D. Differential data augmentation techniques for medical imaging classification tasks. AMIA annual symposium proceedings AMIA symposium. 2017. p. 979–84.
[35] Vano E, Guibelalde E, Morillo A, Alvarez-Pedrosa C, Fernandez J. Evaluation of the European image quality criteria for chest examinations. Br J Radiol
1995;68:1349–55.https://doi.org/10.1259/0007-1285-68-816-1349.
[36] Maccia C, Ariche-Cohen M, Nadeau X, Severo G. The 1991 CEC trial on quality
criteria for diagnostic radiographic images. Radiat Prot Dosim 1995;57:111–7.
https://doi.org/10.1093/oxfordjournals.rpd.a082506.
[37] Lanhede B, Bath M, Kheddache S, Sund P, Bjorneld L, Widell M, et al. The influence of different technique factors on image quality of chest radiographs as evaluated by modified CEC image quality criteria. Br J Radiol 2002;75:38–49.https://doi.org/
10.1259/bjr.75.889.750038.
[38] Pan SJ, Yang Q. A survey on transfer learning. IEEE Trans Knowledge Data Eng (TKDE) 2010;22(10):1345–59.
[39] Szegedy C, Liu W, Jia Y, Sermanet P, Reed S, Anguelov D, et al. Going deeper with convolutions. Proceedings of the IEEE conference on computer vision and pattern recognition. 2015. p. 1–9.
[40] Deng J, Dong W, Socher R, Li LJ, Li K, Li FF, et al. ImageNet: A Large-Scale Hierarchical Image Database. Cvpr: 2009 IEEE Conference on Computer Vision and Pattern Recognition, Vols 1-42009. p. 24855.
[41] Mora P, Faulkner K, Mahmoud AM, Gershan V, Kausik A, Zdesar U, et al.
Improvement of early detection of breast cancer through collaborative multi- country efforts: medical physics component. Phys Medica 2018;48:127–34.
[42] Seeram E. The new exposure indicator for digital radiography. J Med Imaging Radiat Sci 2014;45:144–58.https://doi.org/10.1016/j.jmir.2014.02.004.
[43] Moore CS, Wood TJ, Saunderson JR, Beavis AW. Correlation between the signal-to- noise ratio improvement factor (KSNR) and clinical image quality for chest imaging with a computed radiography system. Phys Med Biol 2015;60:9047–58.https://doi.
org/10.1088/0031-9155/60/23/9047.