Mechanical Engineering Journal
Performance evaluation of semi-dry flue gas desulfurization
and denitration from flue gas of a glass melt using nonthermal
plasma combined process
1. Introduction
In glass bottle manufacturing plants, glass materials are melted at high temperatures using fuels such as heavy oils and city gas in glass melting furnaces. Thus, the exhaust gas tends to contain large amounts of nitrogen oxides (NOx = NO + NO2) owing to high-temperature combustion and sulfur oxides (SOx) originating from the starting materials and fuels. While selective catalytic reduction (SCR) used in thermal power plants is a common method of NOx treatment, exhaust gases that evolve from glass melting furnaces contain alkali metal, sulfur, and other compounds that originate from glass materials (Yang et al., 2013). Because these compounds react with the denitrification catalyst and cause catalyst poisoning, it is difficult to apply conventional denitrification techniques such as SCR. In addition to SCR, there are other NOx removal techniques such as the wet method; however, waste liquid treatment is costly. Therefore, in glass melting furnaces, emission regulations focus on using a low NOx burner (Noda et al., 2007) or suppressing NOx levels through low excess air combustion suppression. However, significant NOx emissions cannot be expected, and moreover high-concentration carbon monoxide emissions due to high fuel consumption and incomplete combustion are observed. Therefore, development of aftertreatment technology that can sufficiently reduce NOx emissions and that is suitable for glass melting furnace gases is required.
Sulfur dioxide (SO2) readily reacts with alkaline solutions such as sodium hydroxide (NaOH). By using a NaOH
Haruhiko YAMASAKI*, Yuta MIZUGUCHI*, Koki MAEDA*, Hidekatsu FUJISHIMA*,
Tomoyuki KUROKI*, Hashira YAMAMOTO** and Masaaki OKUBO*
*Department of Mechanical Engineering, Osaka Prefecture University 1-1 Gakuen-cho, Naka-ku, Sakai 599-8531, Japan
E-mail: [email protected]
**Environmental Affairs Office, Nihon Yamamura Glass Co., Ltd. 15-1 Nishimukojima-cho, Amagasaki-Shi, Hyogo 660-8580, Japan
Abstract
The semi-dry plasma and chemical hybrid process (PCHP) has been used for the simultaneous removal of NOx
and SOx emitted from a glass melting furnace. In this study, PCHP was conducted through a laboratory-scale
model experiment that simulated the aftertreatment system of a full-scale semi-dry glass bottle manufacturing system. The process consisted of two methods: the plasma process in which NO is oxidized using nonthermal plasma and the chemical process in which NO2 produced from NO oxidation is removed using Na2SO3 resulting
from the reaction between SO2 and NaOH. Herein, the position of ozone injection was transferred to the inside
wall of the reactor to improve the efficiency of simultaneous denitrification and desulfurization through the efficient oxidation of NO. First, NO removal experiments were conducted by changing the spray position, spray liquid flow rate, and flow rate of a mixed simulated gas of NO and SO2. Therefore, over the gas flow rate range
from 5 to 15 L/min, the localized cooling area where NO and O3 could be efficiently reacted at the nozzle spray
position of z = 400 mm was formed. A NOx removal efficiency of 74% with a ratio of decreased NO to injected
O3 (ΔNO/O3) of 88% and SO2 removal efficiency of 100% were achieved by injecting O3 from the inside wall
of the reactor when the liquid-gas ratio was 1.17 L/m3.
Keywords : Ozone, Glass melting furnace, Nonthermal plasma, NOx, Semi-dry process, SOx, Plasma chemistry
solution, the gases are treated in semi-dry or wet desulfurization reactors to generate particulate matter like sodium sulfite (Na2SO3) and sodium sulfate (Na2SO4). The fine particles of Na2SO3 and Na2SO4 are collected by an electrostatic precipitator or a bag filter found downstream of the reactor. Na2SO4, the byproduct produced in this process, can be reused as glass materials (Min’ko and Binaliev, 2013). Such exhaust gas treatment systems for glass melting furnaces are widely used as effective environmental cleaning techniques that can be economical and can realize environmental load reduction.
In contrast, the highly efficient and energy-conserving atmospheric nonthermal plasma using plasma-chemical hybrid process (PCHP) has been extensively investigated as a technique for the removal of NOx in combustion gases released from boilers, diesel generators, and garbage incinerators (Yamamoto et al., 2000; Oda et al., 1998; Fujishima et al., 2005; Okubo et al., 2006; Cha et al., 2007; Yoshida et al., 2009; Hayakawa et al., 2016; Kuwahara et al., 2016; Chang et al., 2004; Zhou et al., 1992; Dinelli et al., 1990; Chang et al., 1998). Furthermore, highly efficient exhaust gas treatment can reportedly be achieved using the wet plasma-chemical hybrid treatment technology, which combines the plasma process that oxidizes NO in the combustion exhaust gas released from boilers using ozone (O3) generated by atmospheric nonthermal plasma and the process involving the reductive removal of NO2 generated from oxidation using an aqueous Na2SO3 solution (Sano and Yoshioka, 2003; Fujishima et al., 2010). As no catalysts are used, catalyst poisoning does not occur in the PCHP. Furthermore, the hybrid process can be incorporated into the existing wet and semi-dry desulfurization equipment of glass melting furnaces, which suggests that it is possible to realize a low-cost exhaust gas treatment system, incurring very low equipment remodeling costs. The efficacy of the PCHP applied to a wet desulfurization system through pilot-scale experiments has been demonstrated (Yamamoto et al., 2016a).
Because of the lack of need for a wastewater treatment facility, semi-dry desulfurization equipment is excellent in terms of equipment and operation costs; however, in order to ensure the stable operation of downstream electrostatic precipitators and bag filters, desulfurization treatments are carried out by keeping the spray flow rate very low relative to the wet desulfurization equipment, drying the spray solution in the instrument, and maintaining the exhaust gas temperature at >200°C. Therefore, simply injecting O3 into the instrument would cause O3 to break down faster than reacting with NO, which reduces the rate of NO oxidation. In order to suppress this decrease in NO oxidation, previous research has focused on the low temperature of the solution spray area in the semi-dry desulfurization equipment and performed experiments using an experimental apparatus that was designed for the 1/50,000 scale of actual exhaust gas volume produced in order to elucidate the influence of O3 supply in the local low-temperature area on NO oxidation and capacity for NOx removal (Yamamoto et al., 2016b; Kuroki et al., 2014; Yamamoto et al., 2016c).
Thus far, the authors have carried out laboratory-scale experiments where the liquid-gas ratio (ratio of the volume of exhaust gas Q (m3/min) to the volume of spray liquid q (L/min)) was 20 times larger than that used for the actual semi-dry desulfurization equipment and achieved the maximum NO reduction of 89% and NOx removal efficiency of 61% (Kuroki et al., 2014). Furthermore, under conditions of a low liquid-gas ratio, we achieved the maximum NO oxidation efficiency of 62%, NOx removal efficiency of 45%, and SO2 removal efficiency of 80% (Yamamoto et al., 2016c). As can be seen in these previous reports, approximately 60% of NO oxidation efficiency is achieved through O3 injection. This is because, as O3 is sprayed perpendicular from the reactor wall surface to the center of the reactor, there is an uneven distribution of O3 relative to NO, and O3 escapes the localized cooling area of the nozzle spray that is at the center of the reactor. Thus, an excess of O3 is required relative to NO, thereby increasing the energy cost for the pilot-scale reactor. Ideally, if the amount of NO is equivalent to the quantity of O3 injected into the system, we can expect to achieve an energy conservation effect even in the pilot-scale reactor. Therefore, in this study, in order to improve NO oxidation and denitrification efficiency using O3, we efficiently distributed O3 to the simulated flue gas by spraying O3 perpendicular to the flow of simulated flue gas and tried to improve the NO oxidation efficiency. We then investigated the effect of the liquid-gas ratio on the NO oxidation efficiency during this process. Although experiments in previous reports have been conducted with constant concentrations of NaOH and SO in mixture, at 0.02% and 1.0%, respectively, in our study, the experiments were performed by varying the NaOH and SO concentrations with the liquid-gas ratio reduced to approximately 10 times that in the pilot-scale reactor. Moreover, we sought to further streamline denitrification and desulfurization by examining the optimum concentrations for simultaneous denitrification and desulfurization.
2. Principle of PCHP Technology
air-reactive gases (mainly O3) generated using a nonthermal plasma reactor, and the chemical process, which uses reducing agents and neutralizers, in order to remove NOx and SO2. O3 is generated in a nonthermal plasma reactor using oxygen gas as a raw material. In the plasma process, NO in the exhaust gas is oxidized to water-soluble NO2 using O3. O3 is used as an oxidizing agent that oxidizes the chemically unreactive NO into reactive NO2; this oxidation reaction is rapid (reaction rate constant k = 1.7×10⁻¹⁴ cm3∙molecule-1∙s-1, 25°C) (Atkinson et al., 2004). In contrast, the reaction between O3 and SO2 is very slow (k = 1.89×10⁻²² cm3∙molecule-1∙s-1, 25°C) (DeMore et al., 1997), and it has been reported that O3 selectively oxidizes NO to NO2 when NO and SO2 coexist in the exhaust gases (Nelo et al., 1997).
In glass melting furnaces, SO2 generated from the fuel and raw materials is readily neutralized by the aqueous NaOH solution that is sprayed; this reaction generates Na2SO3, which has strong reducing properties. In the chemical process, Na2SO3 generated by the neutralization of SO2 causes the liquid-phase reduction of NO2 to N2 gas and Na2SO3 is in turn oxidized to Na2SO4. The processing method of complete drying through the evaporation of the mist that forms after the reaction using the heat of the exhaust gas is called the semi-dry method, and the reactor used for this process is called the semi-dry reactor. The series of chemical reactions discussed above are shown in Eqs. (1)–(3).
NO+O3→NO2+O2 (1)
2NaOH+SO2→Na2SO3+H2O (2)
2NO2+4Na2SO3→N2+4Na2SO4 (3)
3. Experimental Equipment and Methods
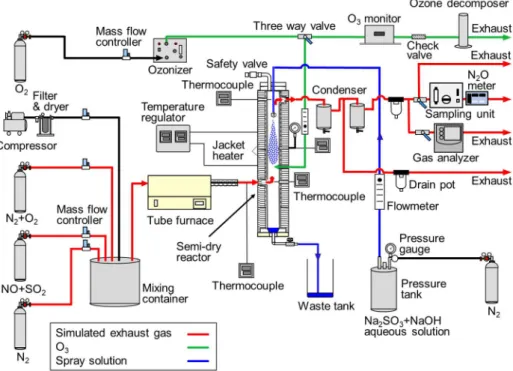
In this study, we used the 1/50,000 scale reactor model equipment of the pilot-scale reactor to simulate the exhaust gas treatment system of the glass melting furnace. Figure 1 shows a schematic diagram of the experimental set-up. The experimental equipment consists of a simulated flue gas flow path, O3 flow path, and spray flow path; each gaseous component is mixed in the reactor in order to process NOx and SO2 in the simulated flue gas. As a part of the simulated flue gases, the N2-based NO and SO2 (NO = 200 ppm, SO2 = 200 ppm) gases and synthetic air (O2 = 21%, N2 = 79%) are used. The flow rate and concentration of each gas are controlled by using mass flow controllers (SFC280E, Hitachi Metal Co.); the gases are mixed together in a mixing container. The mixed gases are heated to 350°C using a tube furnace (EKR-122K, Isuzu Seisakusho Co., Ltd.), and introduced into the semi-dry reactor after measuring the temperature with a thermocouple. Inside the reactor, O3 generated using the surface-discharge-type ozonizer (OZS-OP60-12V, 32 W, Masuda Research Inc.) reacts with NO in the simulated flue gas to produce NO2. Next, NO2 and SO2 in the exhaust gas are treated through gas-liquid contact with the mixture of reducing agents Na2SO3 and NaOH sprayed out of the nozzle installed in the upper part of the reactor; the treated gas is discharged from the upper outlet of the reactor. As the discharged gas is high in temperature and contained water vapor, it is passed through a condenser to remove the water vapor and cooled down to a temperature suitable for analysis with an analyzer. Next, the concentrations of NOx, NO, O2, SO2, and N2O are measured using a gas analyzer (Horiba Ltd., PG-350) and an N2O meter (Horiba Ltd., VIA-510). In order to generate O3, the mass flow controller is used to adjust the flow rate of the O2 gas (purity of 99.5%) according to the prescribed process, and then the O3 generator is used to generate O3. The concentration of the generated O3 is then measured using a UV absorption type O3 monitor (EG-550, concentration: 0–200 g/m3, Ebara Jitsugyo Co., Ltd.) before toggling the three-way valve to inject concentration-adjusted O3 into the reactor. Immediately prior to introducing the gas into the reactor, a flow meter (KOFLOC, model: RK1200 SERIES, flow rate range: 0–500 mL/min) is used to check the flow rate of O2 containing O3. Although most of the aqueous solution sprayed from the upper part of the reactor evaporate in the semi-dry reactor, some of the solution that do not evaporate is discharged from the liquid reservoir provided at the bottom of the reactor by opening the waste liquid valve. The mixture of Na2SO3 and NaOH is sprayed into the reactor through the single-fluid nozzle (full cone type, UNIJET TIP Y130783-TN-SS0.11, Spraying Systems Co.) installed in the upper part of the reactor. The spray solution is prepared by dissolving Na2SO3 powder (Kishida Chemical Co., Ltd., anhydrous, special grade, 97%) and liquid NaOH (Kishida Chemical Co., Ltd., 0.5 mol/L) in pure water and adjusting the concentration. The prepared solution is enclosed in a stainless steel pressure tank (Unicontrols Co., Ltd., 18 L, TM10SRV), and 0.45 MPa of pressure is applied using an N2 gas to feed the solution to the nozzle installed in the upper part of the reactor. During this time, the flow rate of the solution is adjusted using a flow meter (KOFLOC, RK1250 SERIES, flow rate range: 0–10 mL/min) and sprayed into the reactor through the nozzle.
Fig. 1 Schematic diagram of experimental set-up for de-NOx and de-SO2 system.
Fig. 2 Detailed view of the semi-dry reactor.
Figure 2 shows a schematic diagram of the reactor equipment. This reactor is a SUS304 stainless steel cylindrical container having an inner diameter of 56 mm and a height of 1,000 mm. After setting the z-axis to be along the vertical direction of the reactor (upward: +), the simulated flue gas inlet is provided at z = 0 mm. The spray position by the spray is varied over z = 300–500 mm, and the gas outlet is provided at z = 600 mm. The spray position is adjusted by changing the position of the spray nozzle. A 435 mm heater (Eikou Electric Co., Ltd.: Voltage of 100 V, Power of 500 W) is attached to the upper row, and a 400 mm heater (Eikou Electric Co., Ltd.: Voltage of 100 V, Power of 450 W) is attached to the bottom row of the reactor wall surface in order to maintain the temperature of the reactor wall surface constant by PID control. These two rows of heaters are also used to heat the gas inside the reactor and simulate the high-temperature exhaust gas conditions (200°C or higher) found inside the actual semi-dry desulfurization equipment. Furthermore, an O3 injection tube is provided on the reactor wall surface at z = 100 mm, where the tip of the injection tube is 28 mm away from the center of the reactor, allowing O3 to be injected to the center of the reactor, perpendicular to the flow of the
simulated flue gas. We can assume that the reaction regions are located between the ozone injection point and the spray nozzle in the plasma process and between the gas inlet and the spray nozzle in the chemical process. In accordance with a previous report (Kuroki et al., 2014), the concentrations of NO and SO2 are both set to near 100 ppm. The concentration of O3 is kept constant at 11 g/m3 by adjusting the output of the O3 generator, and the O2 flow rate is adjusted between 0.10 and 0.30 L/min such that the mole ratio of O3 and NO (O3/NO) would become 1. Thermocouples are installed at seven positions, every 100 mm upward from z = 0 mm, where the simulated flue gas inlet of the reactor is, to z = 100, 200, 300, 400, 500, and 600 mm in order to measure the temperature distribution inside the reactor. In experiments that are not conducted for the purposes of evaluating the temperature, measurements are only taken from three positions, namely, at z = 0, 200, and 600 mm, on the experimental equipment. The tube furnace in front of the reactor inlet is set isothermally to 350°C, whereas the lower and upper jacket heaters are isothermally set to 250°C and 380°C, respectively. The simulated flue gas flow rate is set between 5 and 15 L/min by using the mass flow controllers, and the spray flow rate is set at 5.0–7.5 mL/min. The NaOH concentration is varied over 0–0.20%, while the SO concentration is varied between 0 and 1.0% in order to evaluate their effect on simultaneous denitrification and desulfurization.
4. Results and Discussion
4.1 Experiment to evaluate temperatures inside semi-dry reactor and NO oxidation experiment
First, an experiment was conducted to check the formation of a localized cooling area (<150°C) in the reactor in order to realize efficient NO oxidation using O3. The temperature distribution in the reactor was measured in order to check for localized cooling areas forming near the O3 injection position (z = 100 mm) as a result of changing the nozzle spray position. Temperature measurements were taken at z = 0 mm (simulated flue gas inlet), 200 mm, and 600 mm (gas outlet). Figure 3 shows the relationship between the nozzle spray position and temperature distribution in the reactor when the spray flow rate (q) and gas flow rate (Q) were set to 7.0 mL/min and 10 L/min, respectively. When the nozzle spray position was z = 500 mm, the temperatures at the reactor heights of z = 0 and 200 mm were 180°C and 230°C, respectively, which clearly shows that the temperature at the O3 injection position was >150°C. Even at a nozzle spray position of z = 450 mm, although the temperature at z = 200 mm was reduced to around 130°C, the fact that the temperature at z = 0 mm was 180°C makes it highly likely that the temperature at the O3 injection position was >150°C. Meanwhile, because reactor temperatures at the reactor heights of z = 0 and 200 mm were <150°C when the nozzle spray heights were z = 300 and 400 mm, it is found that a localized cooling area below 150°C was formed at the O3 injection position (z = 100 mm) when the nozzle spray height was below z = 400 mm. Therefore, it is considered that highly efficient simultaneous desulfurization and denitrification can be obtained at the nozzle height z = 400 mm, where the localized cooling area is formed and the residence time of the gas in the plasma process and chemical process is large. Next, Fig. 4 shows the temperature distribution in the reactor when the gas flow rate and spray flow rate were varied while the nozzle spray position was z = 400 mm. The reactor temperature was measured at seven positions, every 100 mm upward from z = 0 mm where the simulated flue gas inlet of the reactor was at z = 100, 200, 300, 400, 500, and 600 mm. Under all conditions, the temperature at the reactor height of z = 100–400 mm was <150°C, indicating the formation of a localized cooling area. As this experimental equipment simulated a pilot-scale reactor that treats high-temperature exhaust gases, the simulated flue gas was heated using heaters on the reactor wall isothermally. Therefore, even if the gas flow rate is increased, the temperature difference by the heat transfer from the reactor wall surface and spray solution will be small because the heater input reduces. Thus, the location where the localized cooling area forms does not change even if the gas flow rate is varied between 5 and 15 L/min. Furthermore, we did not observe any significant differences in the temperature distribution when q was varied between 5.0 and 7.0 mL/min while the gas flow rate was 15 L/min. This is because as q increased, the spray pressure increased, increasing the spray angle from the mouth of the nozzle, which makes it possible to spray the solution at a wider angle. However, in the center of the reactor, there was no significant difference in the amount of liquid sprayed even when q was varied between 5.0 and 7.0 mL/min; therefore, the spray flow rate had negligible influence on the temperature distribution of the gas. Therefore, it is able to confirm that at a nozzle spray position of z = 400 mm and a gas flow rate of 5–15 mL/min, the temperature of the simulated flue gas in the reactor can be reduced to the point where an efficient reaction between NO and O3 can be realized. Furthermore, it is confirmed that the gas temperature at the reactor outlet could be reproduced to the exhaust gas temperatures condition of the pilot-scale reactor at >200°C, which is above the SO dew point. When the gas temperature at the reactor outlet is above the SO dew point, the Na2SO3 dust can be recovered and reused by electrostatic precipitator.
Fig. 3 Temperature distributions of simulated exhaust gas at spray positions of z = 300, 400, 450, and 500 mm.
Fig. 4 Temperature distributions of simulated exhaust gas at Q = 515 L/min and q = 5.07.0 mL/min.
4.2 Effect of liquid-gas ratio on denitrification/desulfurization performance
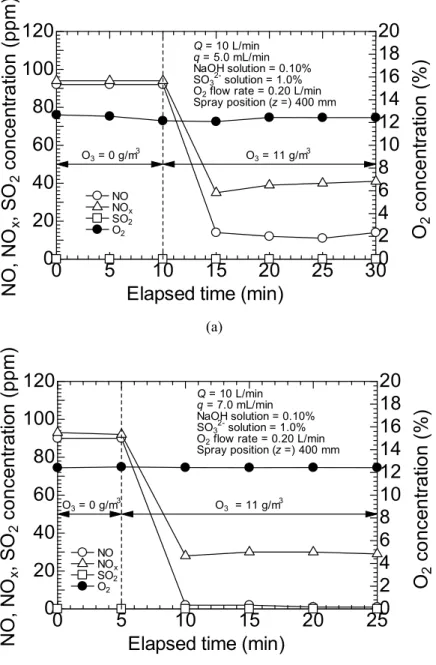
Next, we evaluated the changes in the concentrations of NO, NOx, and SO2 as q was changed. The experiment was conducted with a simulated flue gas flow rate of 10 L/min, initial NO concentration of 100 ppm, and initial SO2 concentration of 100 ppm. The parameters of O3 were kept constant, with the O2 flow rate of 0.20 L/min and the O3 concentration of 11 g/m3 (O
3/NO = 1). The spray flow rate (q) was varied between 5.0 and 7.0 mL/min, and the nozzle spray position was kept constant at 400 mm. The NaOH concentration was set to 0.10%, and the SO concentration was set to 1.0%. Figures 5 (a) and (b) show the time-dependent concentrations of NO, NOx, SO2, and O2 at q = 5.0 and 7.0 mL/min, respectively. O3 injection was initiated 10 min after the start of the experiment [Fig. 5(a)] and 5 min after the start of the experiment [Fig. 5(b)]. When q = 5.0 mL/min, the NO concentration decreased from 92 to 13 ppm, NOx concentration decreased from 94 to 39 ppm, and SO2 concentration was reduced to 0 ppm. The mean removal efficiency for each gas was de-NO = 86%, de-NOx = 59%, and de-SO2 = 100%. When q = 7.0 mL/min, the NO concentration decreased from 90 to 2 ppm, NOx concentration decreased from 93 to 29 ppm, and SO2 concentration was reduced to 0 ppm. At this q value, the mean removal efficiency for each gas was such that de-NO = 98%, de-NOx = 68%, and de-SO2 = 100%. For the ratio of decreased NO to injected O3 (ΔNO/O3), the results were 79% (q = 5.0 mL/min) and 88% (q =
0
100 200 300 400 500 600
0
50
100
150
200
250
300
350
z (mm)
T
e
m
p
e
ra
tu
re
(
oC
)
Spray position z = 300 (mm) z = 400 (mm) z = 450 (mm) z = 500 (mm) Q = 10 L/min q = 7.0 mL/min NaOH solution = 0.10% SO32- solution =1.0%0
100 200 300 400 500 600
0
50
100
150
200
250
300
350
z (mm)
T
e
m
p
e
ra
tu
re
(
oC
)
NaOH solution = 0% SO32- solution = 0% Spray position ( z =) 400 mm Q = 5 L/min ,q = 7.0 mL/min Q = 10 L/min ,q = 7.0 mL/min Q = 15 L/min ,q = 7.0 mL/min Q = 15 L/min ,q = 5.0 mL/min7.0 mL/min). NO oxidation increased because the spray angle increased due to the increase in injection pressure from the nozzle as q increased, which caused the localized cooling area to expand in the radial direction. Moreover, as NO oxidation increased, the amount of NOx reduction also increased. The SO2 concentration remained at 0 ppm throughout the experiment, and the conditions of this experiment provided for sufficient NaOH supply to remove SO2. Under all conditions, the O2 concentration remained near 12%, which is close to the concentration of O2 in common combustion exhaust. Based on these results, it is found that increasing the spray flow rate can improve oxidation performance and increase the quantity of removed NOx.
(a)
(b)
Fig. 5 Time-dependent gas concentrations at Q = 10 L/min with different spray flow rate; (a) q = 5.0 mL/min and (b) q = 7.0 mL/min.
4.3. Effect of flue gas flow rate on denitrification/desulfurization performance
Here, we evaluated the changes in the concentrations of NO, NOx, and SO2 as the simulated flue gas flow rate (Q) was varied. The experiment was conducted at Q = 5, 8, and 15 L/min, q = 7.0 mL/min, initial NO concentration of 100 ppm, and initial SO2 concentration of 100 ppm. The nozzle spray position was kept constant at z = 400 mm, NaOH concentration at 0.10%, the SO concentration at 1.0%, the O3 concentration at 11 g/m3, whereas the O2 flow rate was
0
5
10
15
20
25
30
0
20
40
60
80
100
120
0
2
4
6
8
10
12
14
16
18
20
Elapsed time (min)
N
O
, N
O
x, S
O
2co
n
ce
n
tr
a
tio
n
(
p
p
m
)
Q = 10 L/min q = 5.0 mL/min NaOH solution = 0.10% SO32- solution = 1.0%O2 flow rate = 0.20 L/min
Spray position (z =) 400 mm O3 = 11 g/m3 NO NOx SO2 O2
O
2c
o
n
ce
n
tr
a
tio
n
(
%
)
O3 = 0 g/m30
5
10
15
20
25
0
20
40
60
80
100
120
0
2
4
6
8
10
12
14
16
18
20
Elapsed time (min)
N
O
, N
O
x, S
O
2c
o
n
ce
n
tr
at
io
n
(
p
p
m
)
Q = 10 L/min q = 7.0 mL/min NaOH solution = 0.10% SO32- solution = 1.0%O2 flow rate = 0.20 L/min
Spray position (z =) 400 mm O3 = 11 g/m3 NO NOx SO2 O2
O
2co
n
ce
n
tr
a
tio
n
(
%
)
O3 = 0 g/m3varied from 0.10, 0.16, to 0.30 L/min relative to Q rate in order to maintain O3/NO at 1. Figures 6(a), (b), and (c) show the time-dependent concentrations of NO, NOx, SO2, and O2 at Q = 5, 8, and 15 L/min, respectively. O3 injection was started 10 min after the start of the experiment [Fig. 6(a)] and 5 min after the start of the experiment [Figs. 6(b) and (c)]. When Q = 5 L/min, the NO concentration decreased from 86 to 13 ppm, NOx concentration decreased from 88 to 27 ppm, and SO2 concentration was reduced to 0 ppm. The mean removal efficiency for each gas was NO = 85%, de-NOx = 69%, and de-SO2 = 100%. When Q = 8 L/min, the NO concentration decreased from 91 to 2 ppm, NOx concentration decreased from 92 to 30 ppm, and SO2 concentration was reduced to 0 ppm. At this flue gas flow rate, the mean removal efficiency for each gas was de-NO = 98%, de-NOx = 67%, and de-SO2 = 100%. When Q = 15 L/min, the NO concentration decreased from 88 to 10 ppm, NOx concentration decreased from 92 to 42 ppm, and SO2 concentration was reduced to 0 ppm. At this flue gas flow rate, the mean removal efficiency for each gas was de-NO = 88%, de-NOx = 55%, and de-SO2 = 100%. When compared according to the ratio of the injected O3 to the decrease in NO (ΔNO/O3), the results were 73% (Q = 5 L/min), 88% (Q = 8 L/min), and 77% (Q = 15 L/min), indicating that the oxidation efficiency was better at Q = 8 L/min than at the other two rates. Because NO reacts immediately with ozone, the effect of the change in Q on the oxidation efficiency is small. This is because of the influence of the distribution of O3 that was injected through the O3 injection tube, perpendicular to the simulated flue gas. When Q = 5 L/min, the liquid-gas ratio q/Q was 1.4 L/m3, which suggests that the spray volume was greater than that at Q = 8 L/min. Thus, O3 will diffuse in the upstream direction because of the drag force of sprayed droplets, rather than diffusion over the entire tube radius. Distribution of O3 upstream of the gas, followed by its mixing with high-temperature simulated flue gas, enhanced the breakdown of O3, thereby reducing the oxidation efficiency. When Q = 8 L/min, the diffusion effect of the spray liquid favorably worked on O3 to diffuse it in the radial direction of the reactor, thereby increasing the NO oxidation efficiency. When Q = 15 L/min, q/Q was 0.47 L/m3, which suggests that the spray volume was lower than that at Q = 8 L/min. This indicates that O3 did not benefit from the diffusion effect of the spray liquid, and it, therefore, diffused downstream. Because the outer wall surface of the reactor was heated by a heater, the temperature of the simulated flue gas increased on the inner wall surface of the reactor, which led to a decrease in the density of the simulated flue gas, resulting in the increased local velocity of the simulated flue gas due to the forced convection current. Therefore, when O3 diffused downstream of the reactor, the quantity of O3 distributed onto the wall surface in the reactor increased, and O3 breakdown was enhanced. Based on the above results, when injecting O3 from the wall surface of the reactor, it is necessary to have q/Q that increases the NO oxidation efficiency, and NO oxidation efficiency was the highest at q/Q = 0.701.17 L/m3. The NOx concentration was low at Q = 5 L/min and at Q = 8 L/min, when the NO oxidation efficiency was the highest, and NOx concentration was highest at Q = 15 L/min. At Q = 5 L/min, despite the oxidation efficiency not being high, the reduction efficiency of NO2 was considered to have been high because of the longer residence time than that at Q = 8 L/min. At Q = 15 L/min, NOx concentration was high because of the low oxidation efficiency and short residence time. SO2 had been removed completely because sufficient NaOH had been supplied to ensure its removal.
(a)
0
5
10
15
20
25
30
0
20
40
60
80
100
120
0
2
4
6
8
10
12
14
16
18
20
Elapsed time (min)
N
O
, N
O
x, S
O
2co
n
ce
n
tr
a
tio
n
(
p
p
m
)
Q = 5 L/min q = 7.0 mL/min NaOH solution = 0.10% SO32- solution = 1.0%O2 flow rate = 0.10 L/min
Spray position (z =) 400 mm O3 = 11 g/m3 NO NOx SO2 O2
O
2co
n
ce
n
tr
a
tio
n
(
%
)
O3 = 0 g/m3(b)
(c)
Fig. 6 Time-dependent gas concentrations at q = 7.0 mL/min with different flow rates of simulated exhaust gas; (a) Q = 5 L/min, (b) Q = 8 L/min, and (c) Q = 15 L/min.
4.4. Effect of liquid-gas ratio on NO oxidation efficiency
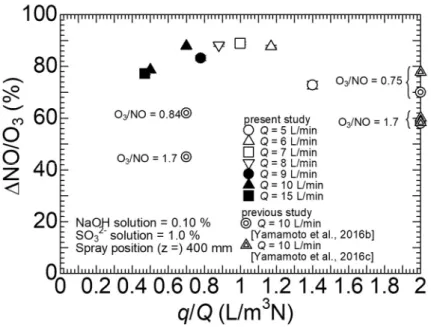
Figure 7 shows the ΔNO/O3 when the gas ratio was varied, which we used to evaluate the effect of the liquid-gas ratio on the NO oxidation efficiency. The experiment was conducted by varying Q between 5 and 15 L/min and q between 5.0 and 7.0 mL/min, with an initial NO concentration of 100 ppm and initial SO2 concentration of 100 ppm. The O3 concentration was maintained at 11 g/m3, and the O2 flow rate was varied from 0.10, 0.12, 0.14, 0.16, 0.18, 0.20, to 0.30 L/min relative to Q in order to keep O3/NO = 1. The nozzle spray position was kept constant at 400 mm, NaOH concentration was kept at 0.10%, and the SO concentration was kept at 1.0%. In addition, Fig. 7 shows the results from previous studies (Yamamoto et al., 2016b; Yamamoto et al., 2016c) that performed O3 injection from the center of the reactor, which we considered in order to evaluate how changing the O3 injection position affects the NO oxidation performance. In the previous studies, ΔNO/O3 decreases as O3/NO increases, because ozone was injected in excess of NO. Each point of the plots in the figure represent the mean values of a total of four measurements taken at 5 min intervals during a 20 min experiment, and the error bars on the points represent the standard deviation of the mean value. In the present study, the variation of ΔNO/O3 with respect to the change in q/Q wassmaller than in the previous studies because
0
5
10
15
20
25
0
20
40
60
80
100
120
0
2
4
6
8
10
12
14
16
18
20
Elapsed time (min)
N
O
, N
O
x, S
O
2c
on
ce
n
tr
a
tio
n
(
p
p
m
)
Q = 8 L/min q = 7.0 mL/min NaOH solution = 0.10% SO32- solution = 1.0%O2 flow rate = 0.16 L/min
Spray position (z =) 400 mm O3 = 11 g/m3 NO NOx SO2 O2
O
2co
n
ce
n
tr
a
tio
n
(
%
)
O3 = 0 g/m30
5
10
15
20
25
0
20
40
60
80
100
120
0
2
4
6
8
10
12
14
16
18
20
Elapsed time (min)
N
O
, N
O
x, S
O
2c
o
n
ce
n
tr
a
tio
n
(
p
p
m
)
Q = 15 L/min q = 7.0 mL/min NaOH solution = 0.10% SO32- solution = 1.0%O2 flow rate = 0.30 L/min
Spray position (z =) 400 mm O3 = 11 g/m3 NO NOx SO2 O2
O
2c
o
n
ce
n
tr
a
tio
n
(
%
)
O3 = 0 g/m3the O3/NO is constant at 1. We achieved favorable results, with an oxidation efficiency of 83% or higher in the liquid-gas ratio range of q/Q = 0.701.17 L/m3. O
3 diffuses downstream when the liquid-gas ratio was smaller than 0.50 L/m3, and upstream when the liquid-gas ratio was above 1.4 L/m3, and in both situations, the oxidation efficiency decreased. Because of this, when O3 was injected from the wall surface of the reactor, O3 diffused efficiently in the liquid-gas ratio range of 0.70 to 1.17 L/m3, and the best result achieved in this experiment was an oxidation efficiency of 89%, when the liquid-gas ratio was 1.0 L/m3. Comparisons with previously reported results (Yamamoto et al., 2016b; Yamamoto et al., 2016c) also help us see that when the liquid-gas ratio was 0.70 L/m3, the oxidation efficiency improved by 26% under the best conditions. In other words, by changing the O3 injection position from the center of the reactor to the wall surface, O3 could be diffused efficiently relative to the NO in the simulated flue gas, which improved the NO oxidation efficiency. This result indicates an important phenomenon in ozone injection technology and needs to be validated by numerical simulation or in-situ measurement in future.
Fig. 7 ΔNO/O3 varying with the liquid-gas ratio at Q between 5 and 15 L/min and q between 5.0 and 7.0 mL/min, with an initial NO concentration of 100 ppm and initial SO2 concentration of 100 ppm.
4.5.
Effect
of
NaOH
concentration
and
𝐒𝐎
𝟑𝟐concentration
on
simultaneous
desulfurization/denitrification
In an attempt to streamline the simultaneous denitrification and desulfurization treatment, we evaluated the effect that changing the NaOH and SO concentrations in the spray liquid has on de-NO, de-NOx, and de-SO2 when Q = 10 L/min and q = 7.0 mL/min, which were the conditions at which oxidation efficiency was highest. The experiment was conducted with the initial NO concentration being 100 ppm, and the initial SO2 concentration being 100 ppm. The O2 flow rate was kept at 0.20 L/min, and the O3 concentration at 11 g/m3, in order to ensure O3/NO = 1. The nozzle spray position was kept at 400 mm. Figure 8 shows de-NO, de-NOx, and de-SO2, which represent the removal efficiencies of NO, NOx, and SO2, respectively, when the SO concentration was kept constant at 1.0%, and the NaOH concentration was varied between 0, 0.025, 0.05, 0.10, 0.15, and 0.20%. Each point of the plots in the figure represents the mean values of a total of four measurements taken at 5 min intervals during a 20 min experiment, and the error bars on the points represent the standard deviation of the mean value. In order to achieve a stoichiometric reaction between the SO2 and NaOH shown in Eq. (2), 0.05% of NaOH was used when there was 100 ppm of SO2. The SO generated by NaOH is capable of reducing 50 ppm of NO2 according to Eq. (3). For this reason, in order to remove 100 ppm of NO2, a minimum of 0.05% of SO was needed in addition to the SO generated by NaOH. As shown in the figure, the value of de-NO was high at 92 to 96% regardless of the concentration of NaOH, and the NaOH concentration had no effect on de-NO between the NaOH concentrations of 0 to 0.20%. With respect to de-SO2, at a NaOH concentration of 0.05%, the de-SO2 was 96%, and between NaOH concentrations of 0 to 0.10, de-SO2 increased with increasing concentration of NaOH and between 0.10 to 0.20% of NaOH, de-SO2 was 100%, thereby indicating that sufficient NaOH has been sprayed. The
decrease in de-SO2 below 0.05% of NaOH was due to the lack of NaOH relative to SO2. Furthermore, the removal of a quantity of SO2 greater than the NaOH equivalence, even below 0.05% of NaOH is thought to be due to the dissolving of some of the SO2 in water to become sulfuric acid. In addition, de-NOx was unaffected by the concentration of NaOH, and because the SO concentration of 1.0% was sufficient for NOx removal, the removal efficiency was 574% regardless of the concentration of NaOH. When there is little to no SO in the spray liquid, the lack of NaOH leads to SO2 dissolving in water to become HSO , and the reaction of NO2 and HSO converts NO2 to NO (Cai et al., 2020). Because of this, de-NOx does not decrease significantly, even when there is a lack of sulfite. Therefore, for the cost of implementing our model toward the pilot-scale reactor, the optimum NaOH concentration would be 0.10%.
Fig. 8 NO, SO2, and NOx removal efficiency varying with NaOH concentration.
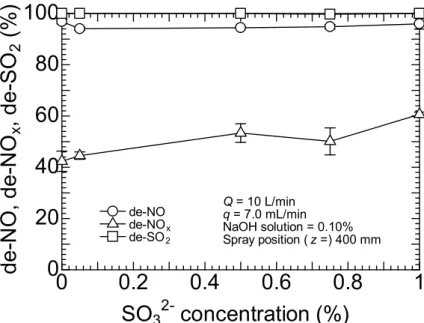
Fig. 9 NO, SO2, and NOx removal efficiency varying with SO concentration.
Next, Fig. 9 shows the removal efficiencies for NO, NOx, and SO2 when the concentration of NaOH was kept constant at 0.10%, and the concentration of SO was varied between 0, 0.05, 0.50, 0.75, and 1.0%. Each point of the plots in the figure represents the mean values of a total of four measurements taken at 5 min intervals during a 20 min experiment, and the error bars on the points represent the standard deviation of the mean value. The de-NO values ranged from 94 to 97%, which showed that there was high oxidation efficiency regardless of the concentration of SO . As can be seen in the figure, de-SO2 was 100% when NaOH concentration was 0.10%, regardless of the concentration of SO . We found
0
0.05
0.1
0.15
0.2
0
20
40
60
80
100
NaOH concentration (%)
d
e
-N
O
, d
e
-N
O
x, d
e
-S
O
2(
%
)
Q = 10 L/min q = 7.0 mL/min SO32- solution = 1.0% Spray position (z =) 400 mm de-NO de-NOx de-SO2Equivalent line for SO2
0
0.2
0.4
0.6
0.8
1
0
20
40
60
80
100
SO
32-concentration (%)
d
e
-N
O
, d
e
-N
O
x, d
e
-S
O
2(
%
)
Q = 10 L/min q = 7.0 mL/min NaOH solution = 0.10% Spray position ( z =) 400 mm de-NO de-NOx de-SO2that de-NOx increased with increasing concentration of SO , reaching a maximum of 61% when the concentration of SO was 1.0%. As SO is sprayed as particulate matter, increasing its concentration above 1.0% clogged the nozzle with SO particles, making uniform spraying difficult. Based on the above results, in this study, the SO concentration to maximize de-NOx is 1.0%.
4.6.
Effect of liquid-gas ratio on simultaneous desulfurization/denitrificationFigure 10 shows the ΔNOx/ΔNO, de-NOx and de-SO2 as the liquid-gas ratio is varied. ΔNOx/ΔNO represents the reduction efficiency of NO2 generated by O3. Each point of the plots in the figure represents the mean values of a total of four measurements taken at 5 min intervals during a 20 min experiment, and the error bars on the points represent the standard deviation of the mean value. This experiment was performed at the same time as the NO oxidation experiment shown in Fig. 7. In Fig. 10, ΔNOx/ΔNO increases as the liquid-gas ratio increases, reaching a maximum of 83% when q/Q = 1.4 L/m3. This is explained by the increase in the gas-liquid contact area with the increase in the liquid-gas ratio. Under the conditions of this experiment, de-SO2 was 100% regardless of the liquid-gas ratio. In other words, with respect to SO2, even at a liquid-gas ratio of q/Q = 0.47 L/m3, 100% desulfurization is possible if the NaOH concentration is 0.10%. As shown in Fig. 7, the NO oxidation efficiency was high between the liquid-gas ratio of q/Q = 0.70 to 1.17 L/m3, and as shown in Fig. 10, ΔNOx/ΔNO increased as the liquid-gas ratio increased. Therefore, in this experiment, de-NOx was maximum, at 74%, when the liquid-gas ratio was 1.17 L/m3.
Fig. 10 ΔNOx/ΔNO, de-NOx, and de-SO2 varying with liquid-gas ratio at Q between 5 and 15 L/min and q between 5.0 and 7.0 mL/min, with an initial NO concentration of 100 ppm and initial SO2 concentration of 100 ppm.
The residence time of simulated flue gas between the O3 injection position (z = 100 mm) and the nozzle spray position of z = 400 mm, calculated using a formula of (d2/4H)/[Q10-3(273.15+T
ave)/273.1560-1] where d is the reactor diameter (m), H is the reaction height (m) from z = 100 mm to 400 mm, and Tave is the average gas temperature (°C) at z = 100, 200, 300, and 400 mm as shown in Fig. 4, was 6.9 s at Q = 5 L/min (q/Q = 1.40 L/m3), 3.5 s at Q = 10 L/min (q/Q = 0.70 L/m3), and 2.3 s at Q = 15 L/min (q/Q = 0.47 L/m3), while q = 7 mL/min. Therefore, as shown in Fig. 10, ΔNOx/ΔNO was 65% when the residence time of simulated flue gas was 2.3 s, 72% when the residence time was 3.5 s, and 83% when the residence time was 6.9 s. This relationship between the residence time of flue gas and the reduction efficiency of NO2 can be used as an indicator for designing a treatment for exhaust gas from actual furnaces.
As indicated by the results above, laboratory experiments modeled on the exhaust gas treatment equipment of glass melting furnaces suggests that changing the O3 injection position to the wall surface inside the reactor can increase the NO oxidation efficiency and achieve simultaneous denitrification in addition to a high desulfurization effect.
0 0.2 0.4 0.6 0.8 1 1.2 1.4 1.6
0
20
40
60
80
100
q/Q (L/m
3)
N
O
x/
N
O
, d
e
-N
O
x, d
e
-S
O
2(
%
)
q = 5.0, 7.0 mL/min NaOH solution = 0.10% SO32- solution = 1.0% Spray position ( z =) 400 mm NOx/NO de-NOx de-SO2 5 L/min 6 L/min 7 L/min 8 L/min 9 L/min 10 L/min Q = 15 L/min5. Conclusions
Through laboratory experiments modeled on the exhaust gas treatment equipment of glass melting furnaces, we carried out experiments that aimed to apply the plasma-chemical hybrid desulfurization and denitrification technology to actual furnaces. Furthermore, in order to improve the efficiency of NO oxidation using O3 and through denitrification, O3 was distributed efficiently by spraying it perpendicular to the flow of the simulated flue gas from the wall surface of the reactor, and the effect of the liquid-gas ratio on the NO oxidation efficiency was evaluated. Furthermore, we carried out experiments by changing the concentrations of NaOH and SO under the conditions of low liquid-gas ratio to determine the optimum concentration for simultaneous denitrification and desulfurization to achieve further streamlined denitrification and desulfurization.
The main results of the study are as listed below.
1. Experiments that evaluated the temperature inside the semi-dry reactor confirmed that at the nozzle spray position of z = 400 mm, the simulated gas temperature in the reactor can be reduced to a temperature at which NO and O3 can react efficiently at a gas flow rate between 5 and 15 L/min, and that the gas temperature at the reactor outlet is reproducible for the exhaust gas temperatures of the pilot-scale reactor above 200°C.
2. For evaluating the denitrification and desulfurization performance by varying q, it is found that by increasing the liquid flow rate, the oxidation performance can be improved and the NOx removal efficiency can be increased.
3. For evaluating the denitrification and desulfurization performance by varying Q, it is found that there is optimum liquid-gas ratio for NO oxidation when O3 is injected perpendicular from the reactor wall surface to the center of the reactor.
4. For examining the effect of the liquid-gas ratio on the NO oxidation efficiency, it is found that O3 diffuses downstream as the liquid-gas ratio decreases, and diffuses upstream as the liquid-gas ratio increases, in both cases, the oxidation efficiency decreases. Furthermore, by changing the O3 injection position from the center of the reactor to the wall surface, O3 could be diffused efficiently relative to the flow of NO in the simulated flue gas, which would result in improving the oxidation efficiency of NO.
5. When the SO concentration is 1.0%, the concentration of NaOH had almost no effect on NO and de-NOx, while de-SO2 was 96% with one stoichiometric equivalence of NaOH, and 100% when the NaOH concentration was at 0.10%, which is slightly higher than one equivalent. Furthermore, when the concentration of NaOH was sufficient, the concentration of SO had almost no effect on NO and de-SO2, and it is found that de-NOx increased with increasing concentration of SO .
6. When evaluating the effect of the liquid-gas ratio on simultaneous denitrification and desulfurization, it is found that ΔNOx/ΔNO increases as the liquid-gas ratio increases. Because the oxidation efficiency of NO was favorable when the liquid-gas ratio was q/Q = 0.701.17 L/m3, de-NO
x was at its maximum of 74% when q/Q = 1.17 L/m3. Furthermore, we showed that ΔNOx/ΔNO can be 65% or higher when the residence time of the simulated flue gas between the O3 gas and spray injection position was 2.3 s; thus, this relationship between the residence time of flue gas and the reduction efficiency of NO2 can be used as an indicator for designing a treatment for exhaust gas from actual furnaces.
Acknowledgment
Some of the experimental data were acquired from co-investigators Mr. Ryosuke Nishioka and Mr. Yuta Fukuda, who are students of the Osaka Prefecture University. Furthermore, this study is subsidized by a project fund (Strategic Innovation Program for Energy Conservation Technologies: JPNP12004) of the New Energy and Industrial Technology Development Organization (NEDO).
References
Atkinson, R., Baulch, D. L., Cox, R. A., Crowley, J. N., Hampson, R. F., Hynes, R. G., Jenkin, M. E., Rossi, M. J. and Troe, J., Evaluated kinetic and photochemical data for atmospheric chemistry: Volume I – gas phase reactions of Ox, HOx, NOx and SOx species, Atmospheric Chemistry and Physics, Vol. 4 (2004), pp. 1461–1738.
Cai, M., Liu, X., Zhu, T., Zou, Y., Tao, W., and Tian, M., Simultaneous removal of SO2 and NO using a spray dryer absorption (SDA) method combined with O3 oxidation for sintering/pelleting flue gas, Journal of Environment Sciences, Vol. 96 (2020), pp. 64–71.
Cha, M. S., Song, Y. H., Lee, J. O., and Kim, S. J., NOx and soot reduction using dielectric barrier discharge and NH3 selective catalytic reduction in diesel exhaust, International Journal of Plasma Environmental Science and Technology, Vol. 1, No. 1 (2007), pp. 28– 33.
Chang, J. S., Urashima, K., Arquillq, M., and Ito, T., Reduction of NOx from combustion flue gases by corona discharge activated methane radical injections, Combustion Science and Technology, Vol. 133, No. 1–3 (1998), pp. 31–47. Chang, MB., Lee, HM., Wu, F., Lai, and C., Simultaneous removal of nitrogen oxide/nitrogen dioxide/sulfur dioxide
from gas streams by combined plasma scrubbing technology, Journal of Air & Waste Management Association, Vol. 54, No. 8 (2004), pp. 941–949.
DeMore, W. B., Golden, D. M., Hampson, R. F., Howard, C. J., Kolb, C. E., and Molina, M. J., Chemical kinetics and photochemical data for use in stratospheric modeling, JPL Publication, Evaluation number 12, Vol. 97-4 (1997). Dinelli, G., Civitano, L., and Rea, M., Industrial experiments on pulsed corona simultaneous removal of NOx and SO2
from flue gas, IEEE Transactions on Industry Applications, Vol. 26, No. 3 (1990), pp. 535–541.
Fujishima, H., Haruna, T., Kuroki, T., Okubo, M., Yamamoto, T.: NOx treatment technology using an indirect plasma-chemical hybrid process (comparison of air-activated gas injection and direct oxidation), Transactions of the Japan Society of Mechanical Engineers. B., Vol. 71, No. 711 (2005), pp. 2816–2822 (in Japanese).
Fujishima, H., Takekoshi, K., Kuroki, T., Tanaka, A., Otsuka, K. and Okubo, M., Towards ideal NOx control technology for bio-oils and a gas multi-fuel boiler system using a plasma-chemical hybrid process, Applied Energy, Vol. 111 (2013), pp. 394–400.
Fujishima, H., Tatsumi, A., Kuroki, T., Tanaka, A., Otsuka, K., Yamamoto, T. and Okubo, M., Improvement in NOx removal performance of the pilot-scale boiler emission control system using an indirect plasma-chemical process, IEEE Transactions on Industry Applications, Vol. 46, No. 5 (2010), pp. 1722–1729.
Hayakawa, Y., Inoue, Y., Takeyama, A., and Kambara, S., Reaction mechanism of De-NOx by activated ammonia generated by dielectric barrier discharge, International Journal of Plasma Environmental Science & Technology, Vol. 10, No. 1 (2016), pp. 20–23.
Kuroki, T., Yamamoto, H., Fujishima, H., Takada, D., Yamato, Y., Okubo, M.: Ozone injection – chemical hybrid denitrification system for glass melting furnaces -Experiments using a semi-dry model equipment-, Proceedings of the Institute of Electrostatics Japan, Vol. 38, No. 1 (2014), pp. 52–58 (in Japanese).
Kuwahara, T., Nakaguchi, H., Kuroki, T., and Okubo, M., Continuous reduction of cyclic adsorbed and desorbed NOx in diesel emission using nonthermal plasma, Journal of Hazardous Materials, Vol. 308 (2016), pp. 216–224.
Min’ko, N. I. and Binaliev, I. M., Role of sodium sulfate in glass technology, Glass and Ceramics, Vol. 69, No. 11–12 (2013), pp. 361–365.
Nelo, S. K., Leskela. K. M., and Sohlo, J. J. K., Simultaneous oxidation of nitrogen oxides and sulfur dioxide with ozone and hydrogen peroxide, Chemical Engineering & Technology, Vol. 20 (1997), pp. 40–42.
Noda, S., Parwatha, I. G., Nada, Y., Nishio, S., and Fukushige, S., Effect of flow field on NOx emission properties of jet nonpremixed flames in cylindrical furnaces, Journal of Environment and Engineering, Vol. 2, No. 4 (2007), pp. 730– 739.
Oda, T., Kato, T., Takahashi, T., and Shimizu, K., Nitric oxide decomposition in air by using non-thermal plasma processing-with additives and catalyst, IEEE Transactions on Industry Applications, Vol. 34, No. 2 (1998), pp. 268– 272.
Okubo, M., Kuroki, T., Kitaura, K., and Yamamoto, T., Diesel engine emission control using pulsed corona plasma-wet chemical hybrid process, Journal of Environment and Engineering, Vol. 1, No. 1 (2006), pp. 29–38.
Sano, K. and Yoshioka, Y., Effect of oxygen injection and HC addition on NO removability of ozone injection method, IEEJ Transactions on Fundamentals and Materials, Vol. 123, No. 10 (2003), pp. 1030–1035.
Yamamoto, H., Kuroki, T., Fujishima, H. and Okubo, M., Pilot-scale exhaust gas treatment for a glass manufacturing system using a plasma combined wet chemical process, Mechanical Engineering Journal, Vol. 3, No. 1 (2016a), DOI: 10.1299/mej.15-00549.
Yamamoto, H., Kuroki, T., Fujishima, H., Yamamoto, Y., Yoshida, K., Okubo, M.: A dry desulfurization and denitrification treatment for glass melting furnaces using plasma-chemical hybrid process technology, Transactions
of the Japan Society of Mechanical Engineers (in Japanese). Vol. 82, No. 843 (2016b), DOI:10.1299/transjsme.16-00255.
Yamamoto, T., Fujishima, H., Okubo, M. and Kuroki, T., Pilot-scale NOx and SOx removal from boiler emission using indirect plasma and chemical hybrid process, IEEE Transactions on Industry Applications, Vol. 46, No. 1 (2010), pp. 29–37.
Yamamoto, T., Yang, C. L., Kravets, Z., and Beltran, M., Plasma-assisted chemical process for NOx control, IEEE Transactions on Industry Applications, Vol. 36, No. 3 (2000), pp. 923–927.
Yamamoto, Y., Yamamoto, H., Takada, D., Kuroki, T., Fujishima, H. and Okubo, M., Simultaneous removal of NOx and SOx from flue gas of a glass melting furnace using a combined ozone injection and semi-dry chemical process, Ozone: Science & Engineering, Vol. 38, No. 3 (2016c), pp. 211–218.
Yang, B., Shen, Y., Shen, S. and Zhu, S., Regeneration of the deactivated TiO2-ZrO2-CeO2/ATS catalyst for NH3-SCR of NOx in glass furnace, Journal of Rare Earths, Vol. 31, No. 2 (2013), pp. 130–136.
Yoshida, K., Okubo, M., Kuroki, T., and Yamamoto, T., Diesel emission control system using combined process of nonthermal plasma and exhaust gas components' recirculation, Thin Solid Films, Vol. 518, No. 3 (2009), pp. 987– 992.
Zhou, Q., Yao, SC., Russell, A., Boyle, J., Flue gas NOx reduction using ammonia radical injection, Journal of Air & Waste Management Association, Vol. 42, No. 9 (1992), pp. 1193–1197.