Title page
Two-dimensional temperature measurement in a high
temperature and high pressure combustor using
CT-TDLAS with a wide scanning laser at 1335-1375nm
Zhenzhen Wang1,2, Wangzheng Zhou1, Takahiro Kamimoto2, Yoshihiro Deguchi2,1*,Junjie Yan1,2, Shunchun Yao3, Krunal Girase2, Min-Gyu Jeon2, Yoshiyuki Kidoguchi2, Yuzuru Nada2
1State Key Laboratory of Multiphase Flow in Power Engineering, Xi’an Jiaotong University, Xi’an
710049, China
2Graduate School of Advanced Technology and Science, Tokushima University, Tokushima 770-8501,
Japan
3School of Electric Power, South China University of Technology, Guangzhou 510640, China
Corresponding author: Yoshihiro Deguchi
ORCID iD: https://orcid.org/0000-0002-1806-3136
Graduate School of Advanced Technology and Science, Tokushima University
TEL: (+81)-88-656-7375
FAX: (+81)-88-656-9082
Email address:ydeguchi@tokushima-u.ac.jp
Postal address: 2-1, Minamijyosanjima, Tokushima 770-8506 Japan
Zhenzhen Wang, Wangzheng Zhou, Takahiro Kamimoto, Yoshihiro Deguchi, Junjie Yan, Shunchun Yao, Krunal Girase, Min-Gyu Jeon, Yoshiyuki Kidoguchi, Yuzuru Nada, Two-Dimensional Temperature Measurement in a High-Temperature and High-Pressure Combustor Using Computed Tomography Tunable Diode Laser Absorption Spectroscopy (CT-TDLAS) with a Wide-Scanning Laser at 1335–1375 nm, Applied Spectroscopy (Volume: 74 issue: 2) pp. 210-222. Copyright ©2020 SAGE Publications. DOI: 10.1177/0003702819888214.
Abstract
Tunable diode laser absorption spectroscopy (TDLAS) technology is a developing method for temperature and species concentration measurements with the features of non-contact, high precision, high sensitivity, etc. The difficulty of two-dimensional (2D) temperature measurement in actual combustors has not yet been solved because of pressure broadening of absorption spectra, optical accessibility, etc. In this study, the combination of computed tomography (CT) and TDLAS with a wide scanning laser at 1335-1375nm has been applied to a combustor for 2D temperature measurement in high temperature of 300-2000K and high pressure of 0.1-2.5MPa condition. An external cavity type laser diode with wide wavelength range scanning at 1335-1375nm was used to evaluate the broadened H2O absorption spectra due to the high temperature and high
pressure effect. The spectroscopic database in high temperature of 300-2000K and high pressure of 0.1-5.0MPa condition has been revised to improve the accuracy for temperature quantitative analysis. CT reconstruction accuracy was also evaluated in different cases, which presented the consistent temperature distribution between CT reconstruction and assumed distributions. The spatial and temporal distributions of temperature in the high temperature and high pressure combustor were measured successfully by CT-TDLAS using the revised spectroscopic database.
Keywords: Two-dimensional (2D) temperature measurement; High temperature and
high pressure field; Tunable diode laser absorption spectroscopy (TDLAS); Computed tomography (CT); Combustion
Introduction
Development of combustion technique, such as high pressure and high temperature combustors of automotive engine, aero or industrial gas-turbine, etc. has led to improve the combustion efficiency and reduce the consumption of fossil fuels and pollutant discharge.1,2 Computation fluid dynamics (CFD) has been widely used in the optimization analyses of combustion parameters such as temperature and species concentration to design and develop the new generation combustors. However, it is difficult to accurately predict these parameters in actual combustors due to the very complicated interactions in turbulent flow structures and flame dynamic. Therefore, the experimental measurement technologies in these combustors are necessary to optimize the analyses of combustion parameters and expedite the development of high-efficient combustors. The current measurement methods include contact and no-contact measurement. The various thermocouples and sampling probes have been used as the temperature and concentration measurement equipment. However, these contact point measurement methods are difficult to precisely measure temperature and concentration distributions in combustion fields. The no-contact temperature measurement methods have been developed and applied in combustion fields due to the merit of no-contact feature, such as optical radiation,3 laser spectroscopy,4-7 CO
2 absorption spectroscopy,8
acoustic method,9 etc.
In past decades, tunable diode laser absorption spectroscopy (TDLAS) technology has been widely studied and applied for temperature and concentration measurements in actual combustion processes even if in the harsh environments such as intense flame
emission, particles and dusts.10-14 However, it is only the average measurement method of temperature and concentration along the laser path. Recently, combination of computed tomography (CT) and TDLAS has been studied and applied for two-dimensional (2D) measurements of temperature and concentration in combustion processes.15-24 In past studies, H2O absorption spectra using narrow wavelength range
scanning lasers were used for 2D temperature measurement.20-24 However, these lasers are not applicable for temperature measurement in high pressure condition, such as 1.0-5.0MPa. The absorption lines overlap in high pressure condition due to the pressure broadening. Therefore, an external cavity type laser diode with wide wavelength range scanning at 1335-1375nm including H2O absorption spectra can be used for
temperature measurement in high pressure fields. These spectra can be distinguished by scanning wide wavelength range even if there is severe pressure broadening. In this study, CT-TDLAS with an external cavity type laser diode for 2D temperature measurement in high pressure and high temperature condition was evaluated. Accuracy of 2D temperature measurement technology inhigh temperature and high pressure field was discussed using the revised spectroscopic database. The CT-TDLAS method was applied for a constant volume combustor to measure its time-resolved 2D temperature distribution in high temperature of 300-2000K and high pressure of 0.1-2.5MPa condition.
Theory
The combination of CT and TDLAS is used to reconstruct 2D temperature distribution with H2O absorption spectra. TDLAS is one of spectroscopic methods for temperature
and concentration measurements. When laser light at wavelengths permeates target gas, the relationship of transmitted light intensity through an absorption medium and the absorber concentration is described by Lambert Beer's law. The number density of measured species n is related to the amount of absorbed light:25
λ / λ0 exp λ exp i i j, ( ) Vi j, ( , , )i i j I I A n L S T G n T p
(1)Here, Iλ0 is the incident light intensity. Iλ is the transmitted light intensity. Aλ is the
absorbance. ni is the number density of species i. L is the path length. Si,j is the
temperature dependent absorption line strength of the absorption line j. GVi,j is the line
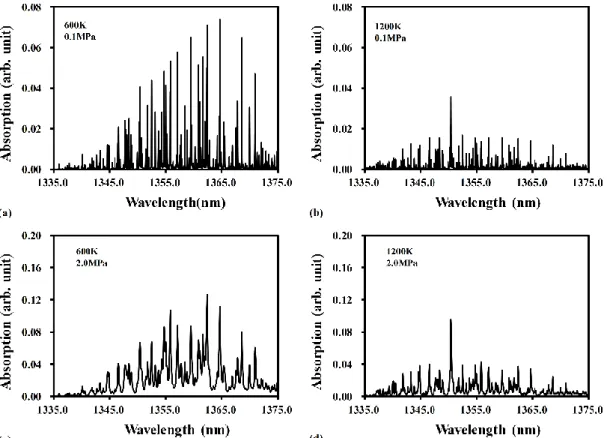
broadening function which depends on temperature, pressure and co-existing species concentrations. Because the spectral shape depends on broadening parameters. Absorption spectrum in practical applications is not always directly proportional to the number density. Theoretical H2O absorption spectra from 1335-1375nm at 600K and
1200K in 0.1MPa and 2.0MPa calculated by HITRAN database26 are shown in Figure 1. These spectra illustrated the severe pressure broadening, which has to be evaluated to measure the temperature and species concentrations. Several methods have been applied to evaluate pressure broadening effects. One of the examples is the use of several narrow-linewidth lasers. Two or three different lasers with narrow linewidths were simultaneously employed to be merged to evaluate the pressure broadening effects.27 This method, however, has the measurement accuracy problem because of the limited number of data according to the wavelength. In this study, a wide wavelength range scanning laser at 1335-1375nm was employed to evaluate the temperature measurement in high pressure field. 300 data between 1335-1375nm was measured
during the scanning in this wavelength range. The measurement accuracy was improved by evaluating the whole spectra.
In this study, the TDLAS evaluation is based on the spectral fitting method12 as a function of broadening parameters such as temperature and pressure. This fitting method employs a theoretical absorption spectra database in which absorption spectra can be calculated in each temperature and pressure condition. The theoretical absorption spectra database should be revised according to the experimental data. Pressure is usually an input parameter measured by a pressure sensor. The effect of co-existing species concentrations on the line broadening function is smaller compared to those of temperature and pressure effects, and it is rather insensitive to this spectral fitting method. This method is also effective to reduce the noise by extracting the shape of measured signals. In the actual applications for high pressure combustors such as car engines, the pressure and temperature vary in the wide ranges (300-2000K, 0.1-5.0MPa) and the requirement of time resolution is less than 1ms. The line widths of low pressure conditions are narrower compared to those of the high pressure conditions and the data acquisition rate must be fast enough to detect the narrower line shape in low pressure conditions. Considering the data acquisition of absorption spectra, it is better to uniform the absorption line width of measured absorption spectra in different pressure and temperature conditions. This uniformity of line width of measured absorption spectra can be accomplished by using the tunable laser with rather wide laser line width. Figure 2 shows the H2O absorption spectra from 1355-1365nm at 600K in 0.1MPa and 2.0MPa
line widths of absorption spectra become uniform in different pressure conditions by using the laser with wider line width of 1.3cm-1.
TDLAS is a line of sight measurement technique, which is based on the total amount of absorption along laser path. 2D distributions of concentration and temperature can be reconstructed by applying CT to TDLAS. Optical paths are embedded in the measurement area. The spatially integrated absorbance in the path p is defined as following:28-32
λ,p p q, p q,αλ, ,p q p q, p q, λ( p q, ) V,λ( p q, , p q, , )
q q
A
n L
n L S T G n T P (2)Here, Aλ,p is spatially integrated absorbance of some wavelength λ in a path p. np,q is
the species number density in a path p inside a position q. αλ,p,q is absorption coefficient
of some wavelength λ inside a position q on the path and it depends on temperature and density of species. Lp,q is the path length inside the position q.
The measurement errors depend on the factors such as laser beams number, view angles, CT-algorithm, uncertainty of spectral database and so on.17-20 There are various CT reconstruction methods,33-36 such as algebraic reconstruction technique (ART), multiplicative algebraic reconstruction technique (MART), Gauss-Newton’s algorithm and so on. Usually, the reconstruction of 2D spatial scale distribution is determined according to the rectangular coordinate. The reconstruction accuracy is strongly affected by laser paths and its configuration. The accuracy tends to become poor near the edge of measurement area because the number of laser paths is few compared to the central area. In this study, the novel algorithm is developed to realize the stable CT reconstruction. The spectral fitting method was employed to detect the temperature and
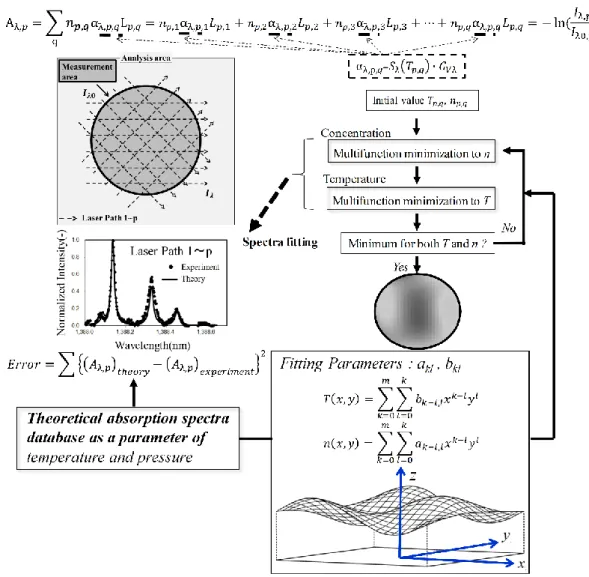
concentration simultaneously using the revised spectroscopic database based on HITRAN database. The 2D temperature and concentration distributions can be defined to employ the 2D polynomials as presented in Eq. (3) and Eq. (4). According to these mathematical equations, the reconstruction of 2D spatial scale distribution can be determined by polynomial parameters and polynomial order, and the fitting parameter becomes independent on the rectangular coordinate. 2D temperature and concentration information is used to calculate the absorption coefficient at each point to improve the accuracy and flexibility.
, , 0 0 ( , ) ( ) m k k l l k l l T k l k l T x y b x y F b
(3) , , 0 0 ( , ) ( ) m k k l l k l l n k l k l n x y a x y F a
(4)Where x and y are the axes of measurement area. a and b are the polynomial parameters.
m is the polynomial order, which is determined by the number of laser paths and the
laser path configuration. m is usually chosen as 8-10 for p=16, 10-14 for p=32, and 14-18 for p=64, and the spatial resolution tends to be inversely proportional to m. In this study, p was 16, q was 40, m was 10 and 300 wavelength measurement points were detected during the wavelength scanning.
Temperature and concentration at each point are determined using a multi-function minimization method to minimize the spectral fitting error. The error minimization of Eq. (6) can be performed as a function of a and b.
λ, , , λ , ,λ , , ( p theory) p q n( k l) ( T( k l)) V ( n( k l), T( k l), ) q A
L F a S F b G F a F b P (5)
2 λ, λ, exp λ, p theory p eriment p Error
A A (6)Concept of this reconstruction procedure is shown in Figure 3. Since p was 16 and there was 300 wavelength measurement points, Equation (5) consisted of 4800 equations and there were 132 unknown factors including 66 ak,l and 66 bk,l. Using this method, the
unknown factors in the CT algorism becomes much smaller than the number of equations. The minimum characteristic spatial scale in the reconstructed temperature and concentration distributions can be determined by m and the pixel size of reconstructed image can be minimized arbitrarily. The influence of the random noise in the measured absorption spectra, which has the effect on the 4800 equations in Eq. (5), is reduce dramatically for the determination of 132 unknown ak,l and bk,l. One of the
most prominent merits of this method is its stability of reconstruction, especially at the edge of measurement area where the laser path number is usually small compared to that at the central area. This is because the minimum characteristic spatial scale is determined by the polynomial order m and is not determined locally. The downhill simplex and Levenberg-Marquardt methods for multifunction minimization were used in this study.
Experimental System
TDLAS system with external cavity type laser diode
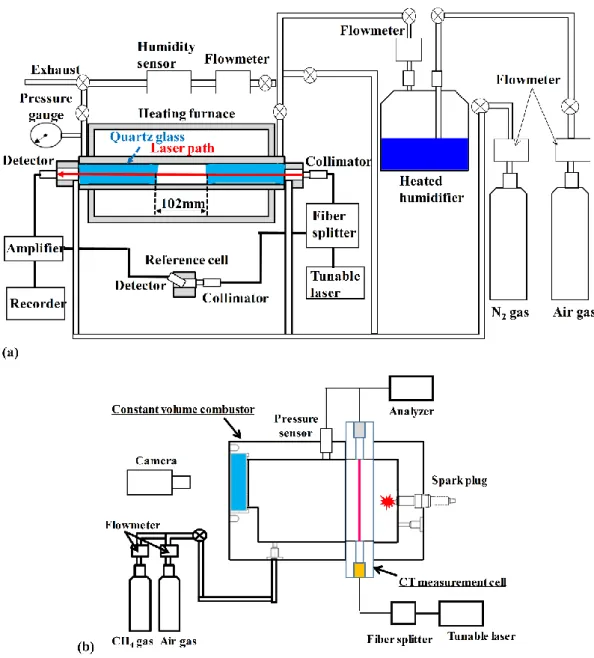
Absorption spectra of water vapor at 1335-1375nm were measured by TDLAS with an external cavity type laser diode in a high temperature and high pressure cell and a flat flame burner to revise the spectroscopic database for the improvement of temperature measurement accuracy. The revision of spectroscopic database to match the measurement results could lead better accuracy for temperature analysis. Figure 4(a)
shows the experimental setup of high temperature and high pressure cell to detect the absorption spectra of water vapor at 1335-1375nm from 373K to 773K and 0.1MPa to 0.9MPa by TDLAS. The cell was put into a heating furnace to increase its temperature and pressure. The cell was designed to detect these absorption spectra at pressure up to 1MPa and temperature up to 800K. Optical length of the cell was 102mm. Both ends of the cell were covered with a fused-silica wedge prism that transmits near-infrared light. In order to introduce and control water vapor into the cell, the air as the carrier gas was connected to the inlet with a heated humidifier and the humidity of water vapor was detected by a humidity sensor. Temperature of the heated humidifier was set at 373K. Nitrogen (N2) was used to purge the cell and the laser path. The flat flame-type
burner of Methane (CH4) and air mixture was employed to detect the absorption spectra
of water vapor at 1335-1375nm from 1000K to 2000K in 0.1MPa by TDLAS. The temperature was also measured using the thermocouple in different conditions. The detailed description for the experimental setup of flat flame-type burner was presented elsewhere.37
External cavity type laser diode (Santec, HSL -200-30-TD, Line width: 1.3cm-1) was used to obtain H2O absorption spectra at 1335-1375nm. Direct absorption spectroscopy
was employed using the 30 kHz wavelength scanning, which shows more distinct spectral evaluation than that of sinusoidal modulation. Since the employed laser had the line width of 1.3cm-1, the H2O absorption spectra at different pressure had similar
wavelength resolution as shown in Figure 2(c) and Figure 2(d). The requirement of data acquisition rate became slower to be several tens of MHz. The laser beam was irradiated
into a high temperature and high pressure cell (SL&PS, TDLAS-1LP-HTPC-L100T500) or the flat flame burner37 using a collimator (Optizone,
C-20-S-1-C-200-2-L-0.95-S). The transmitted light intensity was detected by a photodiode (Hamamatsu Photonics, G12180-010A). The photodetector signal was amplified by an amplifier (cosmowave, FP150MSA) and directly stored by a recorder (HIOKI E.E. Co., 8861 Memory Highcoda HD Analog16) at 20MHz sampling rate.
CT-TDLAS system for 2D temperature measurement in a constant volume combustor
The experimental setup of a constant volume combustor to evaluate 2D temperature measurement in high temperature and high pressure condition using CT-TDLAS is shown Figure 4(b), which consists of a 16 laser-path CT-TDLAS measurement cell (Smart Laser & Plasma Systems Co., CT-TDLAS-16LP-HTPC-R70) for 2D temperature measurement in the combustion chamber, a pressure sensor (KELLER, PA-23), a spark plug (NGK, BKR5E-11) with ignition coil (HITACHI, U0818-COIL) and an optical imaging system. The combustor has been designed to resist pressure up to 7MPa and temperature up to 2000K during combustion processes. The combustor had a cylindrical shape with a diameter of 70mm and a length of 110mm. The pressure sensor was set at 37.5mm from the measurement cell. The CT-TDLAS measurement cell was settled at 32.5mm from the spark plug as one part of the combustor. As optical access ports, 16 collimators and 16 detectors were embedded in the 16-path CT-TDLAS measurement cell. The external cavity type laser diode was splitted by the fiber splitter to 16 laser paths.22,23 The absorption signals of 16 paths were detected and recorded
simultaneously. The CT reconstruction rate was 1ms/image using the absorption spectra with 30 times average. The signal (transmitted light intensity) to noise ratio of each wavelength scanning (30kHz) was 90-100 for 16 laser paths and this ratio became 500-560 by 30 times average. The signal to noise ratio is proportional to the intensity of transmitted light. There are several factors for the attenuation of transmitted light such as the window grime, the laser path flection by the refraction index of measured gases, and so on. The transmittance of laser light excluding to the H2O absorption was
over 30% throughout the experiments. It is also worth noting that the important factor for CT reconstruction is the simultaneity of data acquisition of each laser path and the laser path pointing stability within each wavelength scanning time (33ms). In this point of view, the 30kHz wavelength scanning rate was necessary to secure the requirement above.
The initial condition was set at a given pressure of 0.4MPa by introducing the fuel/air mixture (equivalence ratio ϕ=1) in the combustion chamber. The mixture was thermally equilibrated for 1 min and then ignited to form the high pressure flame. Time-resolved 2D temperature distribution in the combustion chamber was measured by CT-TDLAS. Two parameters including ignition trigger and pressure were simultaneously monitored in the combustion chamber. The combustion flame was also observed by a CCD camera (Panasonic, HX-WA30-K) at 480fps to confirm the flame characteristics.
Results and Discussion
Spectra fitting method and the revised spectroscopic database were employed to evaluate the stable and accurate CT reconstruction in this study. First, the theoretical H2O absorption spectra database was revised according to the experimental data.
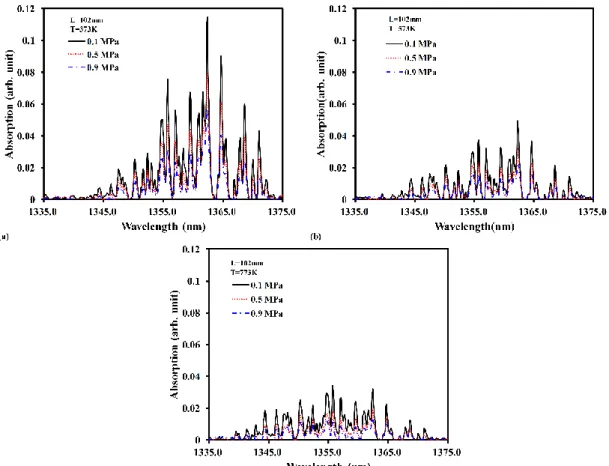
Absorption spectra of water vapor at 1335-1375nm in different temperature and pressure conditions were measured by TDLAS with an external cavity type laser diode with 1.3cm-1 laser line width. These results are shown in Figure 5, which were normalized to the maximum in condition of 373K and 0.1MPa. In the same temperature condition, the absorption spectra intensity decreased when increasing the pressure due to the collisional broadening effect. Similarly, the absorption spectra intensity decreased with the increase of temperature at the same pressure due to the effects of Doppler broadening and collisional broadening. These changes, however, were much smaller than H2O absorption spectra without any line broadening by the laser line width,
which was preferable to the measurement of absorption spectra in different pressure and temperature conditions. It was supported by the analysis of theoretical water vapor absorption spectra with different laser line widths shown in Figure 2. The theoretical absorption spectra of water vapor can be revised by these measured spectral parameters considering the laser line width, which include the set of temperature and pressure dependence between 1335-1375nm.25
The absorption spectra of water vapor at 1335-1375nm from 1000K to 2000K in 0.1MPa were detected by TDLAS with an external cavity type laser diode using the flat flame-type burner. The temperature at the same position of laser path was also measured by the thermocouple. Along the laser path, the temperature was almost
consistent, except for the edges of burner, which verified the stable combustion and temperature in the flat flame-type burner.37 When employing the revised spectroscopic
database, the comparison between measured absorption spectra and calculated spectra using the revised spectroscopic database presents the consistent results (refer to Supplemental Material).
In this study, the temperature from 300K to 2000K was measured by TDLAS and thermocouple. The measured temperature between TDLAS using revised spectroscopic database and thermocouple presented the good consistency and linearity.37,38 It is demonstrated that the measurement accuracy can be enhanced by the revision of spectroscopic database.
Evaluation of CT reconstruction accuracy by simulation
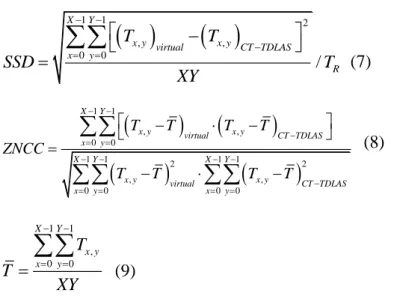
The CT reconstruction accuracy was evaluated quantitatively using SSD (sum of squared difference) and ZNCC (zero-mean normalized cross-correlation).39,40 SSD
value is the area range of recognized pattern in the image recognition by comparing the sum of squared difference between the pixels of specified area and the pixels of target pattern. ZNCC value is a zero-mean normalized cross-correlation representing a correlation between CT calculation result and simulation result. The assumed temperature distributions using the centrosymmetric Cauchy distribution in different pressure cases were employed in the measurement area of 16-path measurement cell. The 16-path spectra were calculated using the spectroscopic database under the assumed temperature distribution conditions and then the temperature distributions were reconstructed by CT algorithm according to the 16-path spectra. SSD value and
ZNCC value are defined by Eq. (7) and Eq. (8). If SSD value is close to “0”, the two profiles of assumed temperature distribution and CT-reconstructed temperature distribution have the almost same values. If ZNCC value is close to “1”, these two profiles have almost same patterns and the correlation between the two profiles is very high.
1 1 2 , , 0 0 / X Y x y virtual x y CT TDLAS x y R T T SSD T XY
(7)
1 1 , , 0 0 1 1 1 1 2 2 , , 0 0 0 0 X Y x y virtual x y CT TDLAS x y X Y X Y x y virtual x y CT TDLAS x y x y T T T T ZNCC T T T T
(8) 1 1 , 0 0 X Y x y x y T T XY
(9)Here, Tx,y is the temperature at each point in calculation area. TR is the representing
temperature 2100K. X is the total number of meshes along x-axis in the calculation area, and Y is the total number of meshes along y-axis in the calculation area.
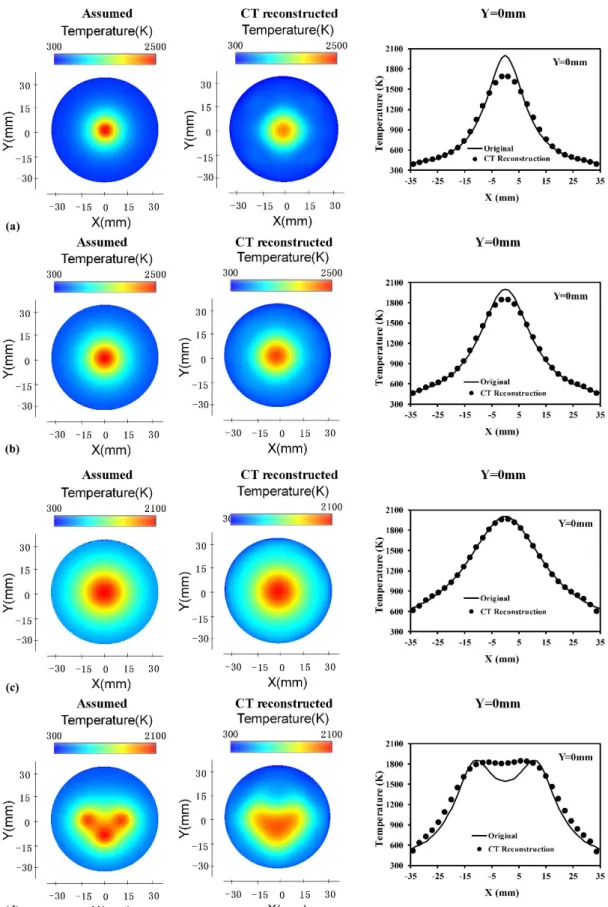
Figure 6 shows the comparison of 2D temperature distributions between assumed distribution and CT reconstructed distribution. Due to the calculation of CT reconstruction based on the limited number of absorbance, the CT reconstructed distribution spread more widely than that of the assumed distribution. The temperature distributions at Y=0mm calculated by 16-path CT-algorithm and assumed temperature were compared in different cases, as also shown in Figure 6, which present the almost consistent temperature distributions. The CT reconstructed temperature distributions in some zones were not completely consistent with the assumed distributions because of
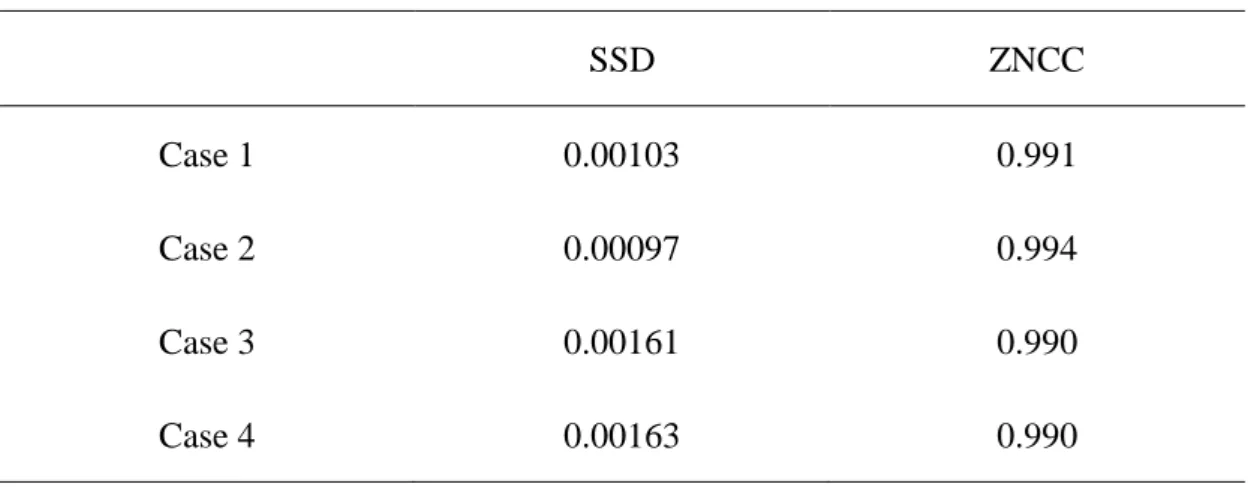
the limited laser paths of 16 paths in this study. Its corresponding SSD and ZNCC in different pressure cases are listed in Table I, which indicate the high similarity between these two profiles. The random noise mentioned above, such as the signal (transmitted light intensity) to noise ratio of 500, added to the absorption spectra affected less than 1% (relative values) to the reconstructed temperature and concentration results because the spectral fitting method can eliminate the random noise effect. It is demonstrated that the CT reconstructed distribution in the measured area agreed well with the assumed distribution. Therefore, the feasibility for temperature distribution calculation by this CT-algorithm was clarified according to these results.
Because m in Eq. (3) and Eq. (4) was 10, the spatial resolution was evaluated to be 17mm (FWHM) by the comparison between the assumed and CT reconstructed distributions. The spatial resolution depends on the number of laser paths and their configuration and the better spatial resolution can be obtained by increasing the number of laser paths, which was demonstrated by 60 laser paths experiment19 to have a spatial resolution of 7.8mm in an imaged subject of diameter 60mm.
2D temperature measurement in a constant volume combustor using CT-TDLAS
2D temperature measurement in the constant volume combustor using CT-TDLAS with an external cavity type laser diode was studied. The initial pressure was set at 0.4MPa. Figure 7 shows the pressure time history from 0 to 0.4s measured by the pressure sensor. The pressure increased from the combustor ignition and then decreased after sufficient combustion, which can be verified according to the combustion flame characteristics. The CCD camera was utilized to observe the combustion flame during the combustion
processes. The ignition and the flame development processes were clearly distinguished, which was consistent with the pressure time history. According to the observation of flame at different times, the front face of flame reached to the plane of CT-TDLAS measurement cell at 30ms.
The employed external cavity diode laser featured more than 40nm wavelength scanning range for the measurement of absorption spectra of water vapor at 1335-1375nm. It was possible to evaluate the broadened absorption spectra and reconstruct 2D temperature distribution by the CT algorithm in high pressure fields. The absorption spectra of water vapor at 1335-1375nm during the combustion processes were uniquely well suitable for the revised spectroscopic database in high temperature and high pressure condition. The 2D temperature and H2O concentration distributions were
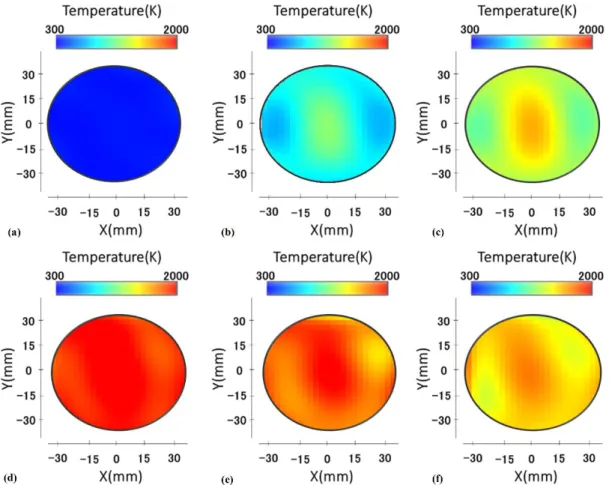
simultaneously reconstructed using the sets of water vapor absorption spectra measured by the CT-TDLAS measurement cell. Figure 8 shows the time-resolved 2D temperature measurement results in the constant volume combustor using CT-TDLAS, which illustrated that the temperature increased first and then decreased during the combustion processes from Figure 8(a) to Figure 8(f). The temperature variation was consistent with the pressure variation. According to the 2D temperature distributions in the combustor, the temperature distributions at t=39ms and t=42ms showed that the high temperature region was at the center (X=Y=0mm) and expanded to the internal surface of combustor with time. The temperature variation and distribution were determined by the combustion flame characteristics in the constant volume combustor. The time-resolved 2D H2O concentration distributions were also measured (refer to Supplemental
Material). H2O concentration distributions showed the similar trend to the temperature
distribution between t=0-90ms and it became unchanged after 90ms because H2O
concentration of the burnt gases was constant. The correlation between time-resolved 2D temperature and H2O concentration distributions can be clarified according to CH4
-air combustion processes. The time of maximum temperature distribution should correspond to the passage of flame through the plane that was imaged by the CT-TDLAS system. At that time, the flame was still in the process of converting the CH4
-air mixture to the burnt gases of H2O and CO2. The expansion of burnt gases behind
the flame also pushed the flame forward and those burnt gases such as H2O was only
then able to come into the measurement plane of CT-TDLAS cell. In the measurement period, the H2O concentration of burnt gases was constant at the measurement plane
after certain combustion time. It is demonstrated that CT-TDLAS enables the 2D temperature and concentration measurements in the constant volume combustor in high temperature and high pressure combustion conditions using the wide scanning laser diode at 1335-1375nm.
Conclusion
A time-resolved measurement of 2D temperature distribution in a constant volume combustor was investigated using CT-TDLAS with an external cavity type laser diode at 1335-1375nm. The revision of spectroscopic database in high temperature and high pressure condition led to better temperature measurement accuracy with the stable and accurate CT reconstruction. CT reconstruction accuracy of 16 laser paths was evaluated by simulation using SSD and ZNCC in different cases, which demonstrated that the CT
reconstructed distribution in the measured area agreed well with the assumed distribution. The spatial and temporal distributions of temperature and H2O
concentration in a high temperature and high pressure constant volume combustor were reconstructed simultaneously and successfully based on these results with CT reconstruction rate of 1ms/image. The obtained results showed the advanced features of CT-TDLAS as a promising diagnostic tool for high temperature and high pressure combustors, such as automotive engine, aero or industrial gas-turbine, etc. to develop the high-efficient combustion technique. Future studies are planned to apply the CT-TDLAS measurement system for the real engine cylinder. The measurement system will be developed for 2D simultaneous measurement of temperature and CO2/fuel
concentration distributions.
Acknowledgement
This work was supported by National Key R&D Program of China (2018YFB0604303) and the National Key Basic Research Development Plan (2015CB251504).
Supplemental Material
All supplemental material mentioned in the text, consisting of theoretical and experimental absorption spectra of water vapor at 1335-1375nm in flat flame burner measured by TDLAS at different temperature, time-resolved 2D H2O concentration distributions measured by CT-TDLAS, as well as the dynamic presentation of time-resolved 2D temperature measurement in a constant volume combustor using CT-TDLAS, are available in the online version of the journal.
[1] F. Tagliante, T. Poinsot, L.M. Pickett, P. Pepiot, L.M. Malbec, G. Bruneaux, C. Angelberger. “A Conceptual Model of the Lame Stabilization Mechanisms for A Lifted Diesel-Type Flame Based on Direct Numerical Simulation and Experiments”. Combust. Flame. 2019. 201: 65-77.
[2] J. Salinero, A. Gómez-Barea, D. Fuentes-Cano, B. Leckner. “Measurement and Theoretical Prediction of Char Temperature Oscillation During Fluidized Bed Combustion.” Combust. Flame. 2018. 192: 190-204.
[3] Q.J. Lin, N. Zhao, K. Yao, Z.D. Jiang, B. Tian, P. Shi, F. Chen. “Ordinary Optical Fiber Sensor for Ultra-High Temperature Measurement Based on Infrared Radiation”. Sensors. 2018. 18: 4071.
[4] E. Boigné, P. Muhunthan, D. Mohaddes, Q. Wang, S. Sobhani, W. Hinshaw, M. Ihme. “X-Ray Computed Tomography for Flame-Structure Analysis of Laminar Premixed Flames”. Combust. Flame. 2019. 200: 142-154.
[5] F. Förster, C. Crua, M. Davy, P. Ewart. “Temperature Measurements Under Diesel Engine Conditions Using Laser Induced Grating Spectroscopy”. Combust. Flame. 2019. 199: 249-257.
[6] T. Benoy, D. Wilson, M. Lengden, I. Armstrong, G. Stewart, W. Johnstone. “Measurement of CO2 Concentration and Temperature in An Aero Engine Exhaust
Plume Using Wavelength Modulation Spectroscopy”. IEEE Sens. J. 2017. 17(19): 6409-6417.
[7] J.A. Nwaboh, S. Pratzler, O. Werhahn, V. Ebert. “Tunable Diode Laser Absorption Spectroscopy Sensor for Calibration Free Humidity Measurements in Pure Methane and Low CO2 Natural Gas”. Appl. Spectrosc. 2017. 71(5): 888-900.
[8] A. Hänsel, A. Reyes-Reyes, S.T. Persijn, H.P. Urbach, N. Bhattacharya. “Temperature Measurement Using Frequency Comb Absorption Spectroscopy of CO2”. Rev. Sci. Instrum. 2017. 88: 053113.
[9] A. Minamide, K. Mizutani, N. Wakatsuki. “Temperature Distribution Measurement with Acoustic Computerized Tomography Using Rectangular Arrangement of Transducers”. Jpn. J. Appl. Phys. 2009. 48: 07GC02.
[10] M.A. Bolshov, Y.A. Kuritsyn, Y.V. Romanovskii. “Tunable Diode Laser Spectroscopy as A Technique for Combustion Diagnostics”. Spectrochim. Acta, Part B. 2015. 106: 45-66.
[11] S. Sur, K. Sun, J.B. Jeffries, J.G. Socha, R.K. Hanson. “Scanned-Wavelength-Modulation-Spectroscopy Sensor for CO, CO2, CH4 and H2O in A High-Pressure
Engineering-Scale Transport-Reactor Coal Gasifier”. Fuel. 2015. 150: 102-111. [12] M. Yamakage, K. Muta, Y. Deguchi, S. Fukada, T. Iwase, T. Yoshida.
“Development of Direct and Fast Response Exhaust Gas Measurement”. SAE Tech. Pap. 2008-01-2758.
[13] G.B. Rieker, H. Li, X. Liu, J.T.C. Liu, J.B. Jeffries, R.K. Hanson, M.G. Allen, S.D. Wehe, P.A. Mulhall, H.S. Kindle, A. Kakuho, K.R. Sholes, T. Matsuura, S. Takatani. “Rapid Measurements of Temperature and H2O Concentration in IC
Engines with A Spark Plug-Mounted Diode Laser Sensor”. Proc. Combust. Inst. 2007. 31: 3041-3049.
[14] V.R. Mironenko, Y.A. Kuritsyn, V.V. Liger, M.A. Bolshov. “Data Processing Algorithm for Diagnostics of Combustion Using Diode Laser Absorption Spectrometry”. Appl. Spectrosc. 2018. 72(2): 199-208.
[15] H. McCann, P. Wright, K. Daun. “Chemical Species Tomography, Industrial Tomography: Systems and Applications”. Inc. Elsevier. 2015. 135-174.
[16] L. Ma, X. Li, S.T. Sanders, A.W. Caswell, S. Roy, D.H. Plemmons, J.R. Gord. “50-kHz-Rate 2D Imaging of Temperature and H2O Concentration at the Exhaust Plane
of A J85 Engine Using Hyperspectral Tomography”. Opt. Express. 2013. 21(1): 1152-1162.
[17] S.A. Tsekenis, N. Tait, H. McCann. “Spatially Resolved and Observer-Free Experimental Quantification of Spatial Resolution in Tomographic Images”. Rev. Sci. Instrum. 2015. 86: 035104.
[18] C. Liu, L. Xu, Z. Cao, H. McCann. “Reconstruction of Axisymmetric Temperature and Gas Concentration Distributions by Combining Fan-Beam TDLAS with Onion-Peeling Deconvolution”. IEEE Trans. Instrum. Meas. 2014. 63(12): 3067-3075.
[19] C. Liu, Z. Cao, Y. Lin, L. Xu, H. McCann. “Online Cross-Sectional Monitoring of a Swirling Flame Using TDLAS Tomography”. IEEE Trans. Instrum. Meas. 2018. 67(6): 1338-1348.
[20] X. An, M.S. Brittelle, P.T. Lauzier, J.R. Gord, S. Roy, G. Chen, S.T. Sanders. “2015 Demonstration of Temperature Imaging by H2O Absorption Spectroscopy
Using Compressed Sensing Tomography”. Appl. Opt. 2015. 54(31): 9190-9199. [21] A. Seidel, S. Wagner, A. Dreizler, V. Ebert. “Robust, Spatially Scanning,
Open-Path TDLAS Hygrometer Using Retro-Reflective Foils for Fast Tomographic 2-D Water Vapor Concentration Field Measurements”. Atmos. Meas. Tech. 2015. 8: 2061-2068.
[22] Y. Deguchi, T. Kamimoto, Y. Kiyota. “Time Resolved 2D Concentration and Temperature Measurement Using CT Tunable Laser Absorption Spectroscopy”. Flow Meas. Instrum. 2015. 46: 312-318.
[23] T. Kamimoto, Y. Deguchi, N. Zhang, N. Nakao, T. Takagi, J.Z. Zhang. “Real-Time 2D Concentration Measurement of CH4 in Oscillating Flames Using CT Tunable
Diode Laser Absorption Spectroscopy”. Journal of Applied Nonlinear Dynamics. 2015. 4(3): 295-303.
[24] Y. Deguchi, T. Kamimoto, Z.Z. Wang, J.J. Yan, J.P. Liu, H. Watanabe, R. Kurose. “Applications of Laser Diagnostics to Thermal Power Plants and Engines”. Appl. Therm. Eng. 2014. 73: 1453-1464.
[25] Y. Deguchi. “Tunable Diode Laser Absorption Spectroscopy”. Industrial Applications of Laser Diagnostics. New York: CRS Press Taylor & Francis, 2011. Chap. 6, 167-205.
[26] L.S. Rothman, I.E. Gordon, A. Barbe, D. ChrisBenner, P.F. Bernath, M. Birk, V. Boudon, L.R. Brown, A. Campargue, J.P. Champion, K. Chance, L. Coudert, V.
Dana, V.M. Devi, S. Fally, J.M. Flaud, R.R. Gamache, A. Goldman, D. Jacquemart, I. Kleiner, N. Lacome, W.J. Lafferty, J.Y. Mandin, S.T. Massie, S.N. Mikhailenko, C.E. Miller, N. Moazzen-Ahmadi, O.V. Naumenko, A.V. Nikitin, J. Orphal, V.I. Perevalov, A. Perrin, A. Predoi-Cross, C.P. Rinsland, M. Rotger, M. Simeckova, M.A.H. Smith, K. Sung, S.A. Tashkun, J. Tennyson, R.A. Toth, A.C. Vandaele, J. VanderAuwera. “The HITRAN2008 Molecular Spectroscopic Database.” J. Quant. Spectrosc. Radiat. Transfer. 2009. 110: 533-572.
[27] S. Karagiannopoulos, E. Cheadle, P. Wright, S. Tsekenis, H. McCann. “Multiwavelength Diode-Laser Absorption Spectroscopy using External Intensity Modulation by Semiconductor Optical Amplifiers”. Appl. Opt. 2012. 51(34): 8057-8067.
[28] L. Ma, W.W. Cai. “Numerical Investigation of Hyperspectral Tomography for Simultaneous Temperature and Concentration Imaging”. Appl. Opt. 2008. 47(21): 3751-3759.
[29] W.W. Cai, C.F. Kaminski. “A Tomographic Technique for the Simultaneous Imaging of Temperature, Chemical Species, and Pressure in Reactive Flows Using Absorption Spectroscopy with Frequency-Agile Lasers”. Appl. Phys. Lett. 2015. 104: 034101.
[30] X. An, T. Kraetschmer, K. Takami, S.T. Sanders, L. Ma, W. Cai, X. Li, S. Roy, J.R. Gord. “Validation of Temperature Imaging by H2O Absorption Spectroscopy
Using Hyperspectral Tomography in Controlled Experiments”. Appl. Opt. 2011. 50(4): A29-A37.
[31] F. Wang, K.F. Cen, N. Li, J.B, Jeffries, Q.X. Huang, J.H. Yan, Y. Chi. “Two-Dimensional Tomography for Gas Concentration and Temperature Distributions Based on Tunable Diode Laser Absorption Spectroscopy”. Meas. Sci. Technol. 2010. 21: 045301.
[32] V.L. Kasyutich, P.A. Martin. “Towards a Two-Dimensional Concentration and Temperature Laser Absorption Tomography Sensor System”. Appl. Phys. B: Lasers Opt. 2011. 102: 149-162.
[33] M.G. Jeon, Y. Deguchi, T. Kamimoto, D.H. Doh, G.R. Cho. “Performances of New Reconstruction Algorithms for CT-TDLAS (Computer Tomography-Tunable Diode Laser Absorption Spectroscopy)”. Appl. Therm. Eng. 2017. 115: 1148-1160. [34] N. Polydorides, A. Tsekenis, E. Fisher, A. Chighine, H. McCann, L. Dimiccoli, P.
Wright, M. Lengden, T. Benoy, D. Wilson, G. Humphries, W. Johnstone “A Constrained Solver for Optical Absorption Tomography”. Appl. Opt. 2018. 57: B1-B9.
[35] D. Liu, Y.X. Zhao, A.K. Khambampati, A. Seppanen, J.F. Du. “A Parametric Level set Method for Imaging Multiphase Conductivity Using lectrical Impedance Tomography”. IEEE Trans. Instrum. Meas. 2018. 4(4): 552-561.
[36] S.Y. Ren, J. Lei, Z.P. Jia. “Reconstruction Method for Temperature Field Measurement using Ultrasonic Tomography”. Chem. Eng. Sci. 2018. 183: 177-189.
[37] T. Kamimoto, Y. Deguchi, Y. Kiyota. “High Temperature Field Application of Two Dimensional Temperature Measurement Technology Using CT Tunable Diode Laser Absorption Spectroscopy”. Flow Meas. Instrum. 2015. 46: 51-57. [38] T. Kamimoto, Y. Deguchi. “2D Temperature Detection Characteristics of Engine
Exhaust Gases Using CT Tunable Diode Laser Absorption Spectroscopy”. Int. J. Mech. Syst. Eng. 2015, 1: 109.
[39] L.M. Po, K. Guo. “Transform-Domain Fast Sum of the Squared Difference Computation for H.264/AVC Rate-Distortion Optimization”. IEEE Trans. Circuits Syst. Video Technol. 2007. 17(6): 765-773.
[40] B. Pan. “Recent Progress in Digital Image Correlation”. Exp. Mech. 2011, 51: 1223-1235.
Figure 1 Theoretical water vapor absorption spectra at 1335-1375nm. (a) 0.1MPa and 600K; (b) 0.1MPa and 1200K; (c) 2.0MPa and 600K; (d) 2.0MPa and 1200K.
Figure 2 Water vapor absorption spectra with different laser line widths. (a) Line width of 0.01cm-1 (0.1MPa and 600K); (b) Line width of 0.01cm-1 (2.0MPa and 600K); (c)
Line width of 1.3cm-1 (0.1MPa and 600K); (d) Line width of 1.3cm-1 (2.0MPa and
Figure 4 Schematic diagrams of experimental systems. (a) Experimental system for spectroscopic database correction measured by TDLAS in a high temperature and high pressure cell; (b) Experimental system for evaluation of 2D temperature measurement in constant volume combustor using CT-TDLAS. (Online version in color.)
Figure 5 Absorption spectra of water vapor at 1335-1375nm at different temperature from 0.1MPa to 0.9MPa. (a) 373K; (b) 573K; (c) 773K. (Online version in color.)
Figure 6 Comparision of assumed and CT reconstructed temperature distributions in different pressure cases. (a) Case 1; (b) Case 2; (c) Case 3; (d) Case 4. (Online version in color.)
Figure 7 Pressure time history during combustion processes at initial pressure of 0.4MPa.
Figure 8 Time-resolved 2D temperature distributions measured by CT-TDLAS. (a) t=0ms; (b) t=39ms; (c) t=42ms; (d) t=90ms; (e) t=141ms; (f) t=213ms. (Online version in color.)
Table I Accuracy of CT reconstruction SSD ZNCC Case 1 0.00103 0.991 Case 2 0.00097 0.994 Case 3 0.00161 0.990 Case 4 0.00163 0.990