Empirical global value chain analysis in
electronics and automobile industries :An
application of Asian international
input-output tables
著者
Oikawa Hiroshi
権利
Copyrights 日本貿易振興機構(ジェトロ)アジア
経済研究所 / Institute of Developing
Economies, Japan External Trade Organization
(IDE-JETRO) http://www.ide.go.jp
journal or
publication title
IDE Discussion Paper
volume
172
year
2008-10-01
INSTITUTE OF DEVELOPING ECONOMIES
IDE Discussion Papers are preliminary materials circulated to stimulate discussions and critical comments
Keywords: Global Value Chains (GVCs), Foreign Direct Investment (FDI),
Electronics, Automobile, Input-Output Analysis
JEL classification: C67, F23, L62, L63,
* Associate Professor, University of Nagasaki, Siebold Campus ([email protected])
IDE DISCUSSION PAPER No. 172
Empirical Global Value Chain Analysis
in Electronics and Automobile Industries:
An Application of Asian International
Input-Output Tables
Hiroshi Oikawa *
Abstract
This study aims to examine the international value distribution structure among major East Asian economies and the US. The mainstream trade theory explains the gains from trade; however, global value chain (GVC) approach emphasises uneven benefits of globalization among trading partners. The present study is mainly based on this view, examining which economy gains the most and which the least from the East Asian production networks. Two key industries, i.e., electronics and automobile, are our principle focus. Input-output method is employed to trace the creation and flows of value-added within the region. A striking fact is that some ASEAN economies increasingly reduce their shares of value-added, taken by developed countries, particularly by Japan. Policy implications are discussed in the final section.
The Institute of Developing Economies (IDE) is a semigovernmental, nonpartisan, nonprofit research institute, founded in 1958. The Institute merged with the Japan External Trade Organization (JETRO) on July 1,
1998. The Institute conducts basic and comprehensive studies on economic
and related affairs in all developing countries and regions, including Asia, the Middle East, Africa, Latin America, Oceania, and Eastern Europe.
The views expressed in this publication are those of the author(s). Publication does not imply endorsement by the Institute of Developing Economies of any of the views expressed within.
INSTITUTE OF DEVELOPING ECONOMIES (IDE), JETRO
3-2-2, WAKABA,MIHAMA-KU,CHIBA-SHI
CHIBA 261-8545, JAPAN
©2008 by Institute of Developing Economies, JETRO
No part of this publication may be reproduced without the prior permission of the IDE-JETRO.
1. Introduction
Over the past several decades, a fundamental change has continued in the economic structure of East Asia, in which regional production networks have been steadily expanded and deepened. A growing number of firms in the region have been increasingly embedded into the regional production system. Petri (2006) clearly shows that the inter-dependence of the regional economies has reached the historically high; moreover, other studies suggest that the East Asia is more advanced, deeply-integrated, and closely-connected in trade and investment networks than other developing areas (Lall et al 2004, Kimura & Ando 2003, Ng & Yeats 1999).
There are several salient features in the structure and process of East Asian economic integration. First, transnational corporations (TNCs) have been an important driving force for the regional network formation. Second, the East Asian economy has shown an outstanding economic performance, particularly in comparison with other developing areas, in which firms and industries of this region have reaped enormous benefits from the regional production networks. Obviously, these two features are closely related each other. The regional networks provide important opportunities for learning, capability building, marketing channels, and financial sources for local firms to meet global competition. TNCs have played a central role in organising and coordinating cross-border economic activities. Close and interactive relationships with TNCs are inevitable for local firms in acquiring, refining, and upgrading their technological and managerial capabilities (Ernst and Kim 2002). Thus, the regional trade and investment networks are a key to explain successful East Asian industrialisation.
However, several important questions remain unsolved, addressing the issues on the impact of the regional integration on East Asia’s economic development. The questions are principally related to the gains from external networks. For instance, does the commitment to the regional production networks provide even benefits for all participants at country, firm and individual levels? Do some economies gain more at the loss of others? In what ways is each economy embedded into the networks? Turning to the country studies, is Japanese economic dominancy in the region still sustained; otherwise, is it enhanced or eroded? What role has the US economy played in East Asia’s production networks? What is the impact of Asian financial crisis on the structure of regional production networks, and what is its economic consequence?
literature, since the growing number of studies on East Asian integration has been largely confined to examine underlying trend in regional trade and investment flows (Sohn 2002, Kawai 2005, Kimura and Ando 2005). These studies have shown undisputable evidence that the East Asian economy has been deeply integrated and TNCs play a central role in this process; however, little is known about the economic
consequence of such integration. This is the focus of the present study.
The electronics and automobile production networks are my principle concerns. The reasons of my choice are explained as follows. First, these industries are particularly important for export-oriented industrialisation in East Asia. The industries have been successful in generating an immense amount of employment and wages, and providing opportunities of outsourcing and technological upgrading for local suppliers. Second, the industries have extensively created dense production networks within the region. Third, in general, the development of these industries has been heavily fuelled by a massive inflow of foreign direct investment (FDI), resulting in TNC-driven regional networks in the sectors. Fourth, due to different FDI policies adopted by the East Asian governments, it is expected the nature of the production networks differ widely among individual countries as well as between the two industries. These features provide ideal samples to examine the nature and implications of regional production networks.
A core variable to use in my study is value-added, as the overall welfare of a country can be easily measured with this. My study aims to estimate how much value-added is created and retained at home and flown-out externally. For this calculation, the input-output analysis is the main tool. In the analysis, value is created by inter-industrial linkages of the economy as a system, and is distributed in the form of wages, profits, taxes, and other rewards. As a result, Input-output method lucidly reveals the inter-industry value flows. The Asian international input-output tables in 1990, 1995, and 2000 are used for this calculation. Empirical results are carefully reviewed in author’s fieldwork in several Southeast Asian countries as well as in Japan.
The present study is structured as follows. Section 2 briefly reviews the theories to approach the issue concerned. Global value chain (GVC) analysis is mainly examined. Section 3 reviews the development of electronics and automobile industries, mainly focusing on the differences in FDI and trade policies among East Asian governments. The methodological issues are discussed in section 4 where the input-output method is explained and applied to the estimation of international value distribution. Section 5
offers the result and implications. A summary of the findings and the conclusion are presented in the final section.
2. Global Value Chains and Uneven Development
Questions related to the impact and implications of globalisation on international distribution of income have stimulated intellectual concerns. There are two theoretical frameworks to approach this issue. The first is the mainstream trade theory. The theory tends to emphasise the gains from trade, demonstrating that the international division of labour benefit all participating countries. Each country should be specialised in the production in which the country has a comparative advantage. However, the theory does not provide a clear explanation about the allocation of gains among trade partners.
The second approach is to focus on this aspect, under the heading of the global value chain (GVC) analysis (Gereffi and Korzeniewicz 1994, Henderson 1998, Gereffi 1999, Kaplinsky 2000, Gereffi and Kaplinsky 2001). Global value chains refer to the full range of activities from upstream to final stage of production, encompassing design, processing, manufacturing, and marketing of a product. The initiative to form global networks is normally taken by leading TNCs; therefore, the focus of the analysis is centred on firms, especially TNCs which coordinate and control the organisation of the entire production process. TNCs’ governance often leads to making contributions to the upgrading of the entire global value chain. However, the analysis puts more stress on the fact that “the value-added capacities of companies at each nodal point in the chain tend to vary and in any case are constrained by the way the chain is organized and by the nature of corporate power within it.” (Henderson 1998: 369). As a result, this approach tends to emphasise uneven gains from trade and the underlying role of TNCs in exaggerating this tendency. The approach sees that uneven benefit from trade and investment is closely associated with the spread and penetration of TNCs’ global activities. A country possessing only weak technological capabilities are forced to offer falling real wages to attract TNCs and serve themselves as simple manufacturing bases (Fröbel et al. 1980). Profit is greatest in the relatively concentrated nodes of the upstream and downstream chains which are usually located in developed areas, while less profitable segments are left to less developed locations. Moreover, the TNC dependence often results in outflows of value-added in terms of payment for imported materials, license fees, loyalty, and repatriation of profit. Based on this perspective, the GVC approach posits that the economic consequence of TNC-led production networks
often result in uneven development among network participants.
It is important to note that the two approaches do not necessarily show a conflicting view on the gains from trade. Instead, the difference between the two is the points they emphasise. The former highlights the gains from trade; on the contrary, the latter pays a lager attention to the distributive aspects of the gains. The GVC approach is applicable to the present study, as our main concern is to examine the distribution of value in the region. It is highly possible that the East Asian economies enjoy the gains from trade in an absolute term; however, no study has examined which economy gains the most and which the least. This study aims to investigate this.
3. Electronics and Automobile Value Chains in East Asia
The East Asian electronics and automobile industries are chosen as the primary focuses of this study. These industries are selected for the following reasons.
First, electronics and automobile industries have been one of the major driving forces for remarkable economic development in this region. The industries have been one of the fastest growing industries in world production and export. This is particular in East Asia, as the region’s export and output growth of these industries have far exceeded the world average, steadily gaining the market shares over the last few decades. In addition to the export expansion, the industries have played a central role in region’s successful industrialisation, making a tremendous contribution to employment creation, value-added generation and technological advancement. Second, their rapid development in output and export has long been boosted by massive inflows of FDI from developed nations. An important outcome of FDI-led industrialisation was to create a closer, more complex regional production links than traditional arm’s length trade. Huge FDI inflows often allow a number of local firms in this area to share some fractions of international production networks. Finally, for a technical reason, electronics and automobile productions are more easily fragmented than other industries. These industries cover a broad range of products that include truly high-tech products such as microprocessors and engines as well as fairly traditional mass-produced commodities such as coils, simple computer memory, and plastic parts. At the same time, the industries produce and use a larger number of intermediate goods, providing wider opportunities for local and international outsourcing and subcontracting. Thus, the focus on the electronics and automobile industries may enable us to capture a great variety of sectoral characteristics and structure of regional production networks.
A comparative study between the two industries is one of the main focuses of this study. Despite their similarities in many points such as the TNC-dependence and the aggressive roles of governments in supporting indigenous sectors, in a closer examination, there are slight differences in nature between the two industries. First, electronics is more export-oriented than automobiles. During the decade of the 1990s, East Asian electronics exports grew by 13.3% p.a., while the auto export only by 4.7%. Second, technically, electronics products are more easily fragmented than autos’. Such differences in product natures reflect different industrial organisation of each industry. Electronics value chains are relatively open, on short-term basis, decentralised, and nimble in supplier switching, while automobile production networks are relatively cautious, centralised, long-term oriented and stable.
In addition to the industrial study, a comparison of each country’s performance is integral in the present study. This also aims to clarify the different characteristics of regional production networks. Actually, East Asia’s government policies in supporting local industries differ widely, particularly in the policies to attract FDI and TNCs. For example, except for a few cases like Korea, East Asian electronics industry has long enjoyed relatively liberalised and open-door policies for FDI, while selective and heavily interventionist policies were often introduced to the automobile sectors. Based on this view, it is reasonable to assume that different government policies will result in different economic performances among East Asian economies. In this regard, Lall (1992; 10) categorises wide spectrum of industrial and FDI policies of East Asian governments simply into the following four categories.
(1) Passive open-door policies on TNCs without intervention in other ways to promote selectively industrial development (e.g., Hong Kong)
(2) Active industrial policies and promotion of local enterprises in certain activities, but effectively open-door, non-interventionist policies in most export-oriented industries such as electronics (e.g., Thailand and Malaysia).
(3) Heavy TNC participation in manufacturing without seeking to promote local industrialist, but pervasive and selective intervention to guide and induce investors to upgrade their activities and increase local technological activities (e.g., Singapore). (4) Selective restricted FDI to maximise reliance on externalised forms of technology transfer in the context of comprehensive set of industrial policies to deepen the manufacturing sector, promote local linkages and increase local innovative capabilities
(e.g., Korea, Taiwan, and former Japan).
Korea and Taiwan, or NIEs in general, have pursued a similar type of industrial policies that aimed to promote indigenous firms for technology deepening. FDI is assigned as a second role in importing and transferring advanced technologies. Such FDI strategies were fairly consistent with other industrial polices the economies adopted. The domestic market was not fully opened to free trade in order to provide domestic ready markets for national champion companies. The harmful effects of protection were partly offset by incentives and pressures to export their products in competitive international markets. The government heavily controlled financial flows to secure low cost capital for them. As a reasonable corporate strategy pursued under such restricted and controlled FDI scheme, Korean and Taiwanese firms began to seek product assembly joint ventures with US, Japanese, and European companies. As firms acquired more knowledge and production know-how about assembly, the OEM (original equipment manufacture) was gradually introduced as an alternative to joint ventures (Hobday 1995). Furthermore, in successful latecomer firms which aggressively accumulated process and product design capabilities, the OEM began to overlap with ODM (own-design and manufacture) which requires more comprehensive technological capabilities including system design, product-process interfacing, automation technology, component design and post-production skills. The important role of FDI and TNCs in industrialisation is still undeniable in Korea and Taiwan; however, TNCs’ local activities were severely constrained and guided to maximise the spillovers to indigenous firms, rather than to replace them. Hobday (2001) calls this catch-up mechanism as OEM/ODM system, in which Korea and Taiwan are referred as the successful cases.
In stark contrast to Korea and Taiwan, several ASEAN countries such as Malaysia and Thailand, have largely admitted the dominance of TNC investments. The government’s primary role has been in providing infrastructure and incentives, including tax-free holidays and the establishment of free trade zones under relatively stabilised macroeconomic environment. These factors have successfully facilitated as major attractions for TNCs, particularly in electronics. Such industrial strategy allows large TNCs to decide on corporate strategy, technology transfer and local technology development, rather than relying on the development of indigenous firms as pursued by Korea and Taiwan. Hobday (2001) calls their development strategies as TNC-led industrialisation.
TNCs’ overwhelming presence in ASEAN’s core industrial sectors is partly explained by the relative absence of competitive local firms. The economies are still relatively at an earlier stage of development. Thus, TNC-led industrial strategy is rather inevitable for such an economy which is not capable of economically technological deepening. Under such circumstances, better outcomes are expected by inviting TNCs to maximise the spill-over effects from their local operation, rather than by keeping them out to make more spaces for indigenous firms. It seems that ASEAN economies, particularly Malaysian electronics and Thai automobile industries, have principally followed this principle.
If the above interpretation is acceptable, an important question arises. Have those economies in East Asia enjoyed even benefits from those different types of industrialisation? Instead, have the different industrial strategies resulted in different economic performances? Furthermore, the issue is closely related to the following concerns. In Korea and Taiwan, have the indigenous capabilities been suitably enhanced with a relatively small presence of local TNCs? On the other hand, have TNC participation successfully enhanced, or at least compensated, relatively weak technological capabilities of ASEAN economies? Instead, is there any evidence that TNCs have repressed local entrepreneurship and take benefits away from local economies? What benefits have TNCs enjoyed from the regional production networks in East Asia? These are highly empirical questions and may not derive decisive conclusions a priori. The next section explains a quantitative method to approach this issue.
4. Methodology
This section explains the methodological issues related to identifying relative ‘winners and losers’ in regional production networks.
As is examined in Section 2, value is an important concept in the GVC studies. In an accounting system, value is captured as the sum of value-added such as wages, profits, and natural resource rents. In addition, government taxes are defrayed from value-added. This study sees that value-added is a proper working definition of value in the context of my study. Although economic success is often explained by the growth of output, employment, and exports, value-added generation is a fundamental variable for a country’s well-being. Based on this view, this study uses the variable ‘value-added’ to
assess the relative performance in each individual economy in the region.
Value is normally generated in a profit-seeking activity conducted by an individual corporation for which a number of intermediate inputs are used. Such intermediates are products or services supplied by, in turn, other firms. Therefore, value-added, or value in general, is created within industrial linkages as a unit of system. The system normally involves not only domestically-produced goods but also imported inputs produced by foreign agents. As a result, a dependence on external intermediate inputs comes into view as an international transfer of value-added among different industries and countries. Obviously, the inter-industry relationships cannot be stable: some industries in a country are successful to gain increasing value-added while others are not. Thus, mapping the distribution of value-added among internationally linked sectors examines the successful performance.
In this study, the following three types of indexes are mainly used to examine the performance of the industries and the countries concerned.
(a) International Value Distribution index (IVD), indicating how many percentages of value is retained within the concerned economy and flown-out to other economies, regions, and disappeared as tariffs or transportation costs.
(b) Regional Value Share index (RVS), indicating how much the industry contributed to the creation of regional value-added, measuring by the percentage shares of the value-added the concerned industry created to the total amount of value-added created in the region.
(c) Value Origin Share index (VOS), indicating how many percentages of value-added originated ether from the domestic sector or other economies in the region.
Model
For quantifying the regional value distribution, a simple input-output method is applied to my study. The immediate advantage of the ‘value-added’ definition is an applicability of input-output methods for mapping the flows of value-added among industries. Input-output analysis sees an economy as a system of inter-linkages between all inputs and outputs. The Asian International Input-Output tables 1990, 1995 and 2000 are used. An important feature of the tables is that all listed countries are treated as non-competitive and endogenous. The analysis simply follows the works of Matsumura & Fujikawa (1998), Oikawa (2005), and Fujikawa et al (2005).
Suppose that the total numbers of sectors and countries are n and s, respectively. Then, the following supply-demand balance equation holds in the matrix form.
X = A X + F (1) where X = { x11,...xn1; x12,..xn2; ... ;x1s,..xns }′ F = { f11,...fn1; f12,..fn2; ... ; f1s,..fns }′ ≡
[
]
nn n1 21 1n 12 11 A ... ... A : : : : : A A ... A A A where[
]
... ... : : : : : : : ... ≡ 1 21 1 12 11 hk nn hk n hk hk n hk hk hk α α α α α α AIn equation (1) x and ns f denote vectors of gross output and final demands of sns th
country’s nth sector, respectively. A dot (‘) demotes the transpose. Ahk is the coefficient
matrix of hth county’s product used for kth county’s unit output. aijhk, an element of
hk
A matrix, represents the value-termed coefficient of the hth country’s ith sector to use
for the unit output of the jth sector in kth country (αijhk≥0). A is a large square matrix
of(ns×ns).
The two points should be noted for the subsequent argument. First, as is explained in a
standard textbook,
[
I- A]
-1 is the Leontief’s inverse matrix, representing how muchthe incremental gross output is induced directly and indirectly by the unit increase in final demand. The word ‘indirectly’ refers to the recursive increase of the concerned products due to every sectors’ interdependence. The following argument does not explicitly mention this; however, both direct and indirect impact is always considered. Second, for simplicity, the final demand vector F is omitted hereafter, assuming the increase of final demands is set to unity evenly across the all relevant sectors.
By pre-multiplying this with the diagonal matrix of value-added ratio, G , the
international distribution of value among s countries is obtained as follows.
where
[
]
... ... 0 : : : : : ... : 0 ... ... ≡ 2 1 n g g g G where[
]
... ... 0 : : : : 0 : 0 0 ... 0 ≡ 2 1 k n k k k r r r gI is the identity matrix. rji denotes the value-added ratio of ith country’s jth sector. D
appears as(ns×ns)matrix, specifically expressed in the matrix form as follows.
[
]
... ... : : : : : ... = 1 21 1 12 11 nn n hk n D D D D D D D D where[
]
... ... : : : : : : : ... ≡ 1 21 1 12 11 hk SS hk S hk hk S hk hk hk v v v v v v DIn the above matrices, vijhk, which represents the share of the value-added gained by hth
country’s ith sector which was originally generated by the production activities conducted in jth sector of kth country. In other words, the unit production of kth
country’s jth sector outflows the amount of vijhkvalue-added to hth country’s ith sector.
Imports from Hong Kong and the rest of the world (ROW) are exogenous in the Asian International Input-Output tables. Therefore, it is not possible to trace the outflows of value-added to these areas. Due to such a technical constraint, the leakages of import costs from these areas are treated as parallels to value-added. The direct and indirect cost leakages to Hong Kong and ROW are calculated by the following formula.
Mh = ah
[
I-A]
-1 where h = HKG and ROW (3)In equation (3), aHKGandaROWare (1×ns)row vectors whose elements are import
coefficients from Hong Kong and ROW. Note again that this is not value, but payments
for imported materials from Hong Kong and ROW. The matrixM appears as of h
a(1×ns row vector. )
The principle focus of this study is NOT to obtain the absolute scale of value-added multipliers, but to examine the relative distributions of value-added among the sectors of the economies concerned. Thus, standardization of scale is required. For this, the
column sum ofD , MHKGand MROWshould be re-calculated to be set to equal to unity.
After this manipulation, the modified elements of D , MHKGand MROWmatrices are
Finally, it is of more convenient use to transform the variables into aggregated index. With the notations used above, the three key indexes, IVD, RVS, and VOS, are defined as follows. IVD: ^ 1 = → ≡
∑
hk ij n i h k j v V (4) RVS: ^ 1 = =1 =1 ^ 1 =∑∑∑
∑
/ ≡ hk ij n i n j s h hk ij n i k j v v R (5) VOS: ^ 1 = 1 = ^ 1 =∑
∑
∑
/ ≡ hk ij s h n j hk ij n j k i v vO (for domestic origin) (6)
^ 1 = 1 = ^ 1 = ^ 1 = =1
∑
∑
∑
∑∑
) / ( ≡ hk ij s h n j hk ij n j hk ij n j s h v vv (for foreign origins)
The IVD index refers to the total share of value-added retained domestically as well as that of flown-out to other economies. The index clearly shows how much of value-added out-flown from the industry and which country gains how much from this leakage. Next, the RVS index indicates the relative contribution of the industry to the total value-added generation of the all other sectors in the region. In other words, this index shows the industry’s relative scale of value creation in the region. Finally, the index VOS shows a relative share of origin (i.e., either domestic or external) in value-added creation. This may need more explanations for clear understanding. Total value-added a country enjoys can be decomposed into home and foreign origins. Now let us take the Japanese electronics industry for an instance. The total amount of value-added Japan can enjoys form all East Asian electronics industries depends on two elements; (i) how much home electronics sector produce value-added and retain it inside Japan, and (2) how much Japan capture the value-added the other countries’ electronics sectors create. The latter is explained by means of Japanese intermediate goods used directly and indirectly for the foreign electronics sectors. Note that, in this formulation, direct and indirect intermediates may include Japanese goods and services other than electronics products, such as agricultural products, natural resources, steel, chemical water, electricity as well as business services like trade and finance. In this context, the VOS index is useful to show the relative shares of external gains of the sector concerned.
Measuring the’ relative’ winners and losers
The mainstream trade theory posits that the international division of labour will benefits all participating agents. Whether this is true is not a central concern of this paper. Instead, this study is to evaluate the gains in a relative term; which country’s which industry gains the most value-added, while which gains the least. The implication of the word ‘relative’ may be important in the context of East Asian development, as East Asia as a whole has enjoyed larger benefits from international trade than other developing economies. Simple statistical data clearly support this presumption; in the 1990s, developing country exports in electronics and automobile far outpaced those of the world average, more than 90% of which was grasped by East Asia in electronics and 35% in autos. Thus, East Asia shows a remarkable development both in electronics and automobile industrialisation. The point this study emphasises is that, however, this does not necessarily mean sharing equal benefits among East Asian economies. In this regard, the word ‘relative’ is to use to admit the uneven international distribution of gains among regional trading partners.
A method of performance matrix is proposed for a proper evaluation. This is because an assessment with only single index may fail to grasp a complex nature of industry’s performance. To overcome this problem, I propose to introduce the world market shares to combine with IVD index. Four possible cases of the industry performance are presented in Table 1.
increased decreased
increased Absolute Winners Substantial Winners
decreased Questionable Winners Absolute Losers
IV
D In
d
ex
Table 1. Performance Matrix of East Asian Industrialisation
World Market Shares
First, ‘absolute winners’ are defined as the industry which increases not only the world export shares but also the percentage shares in IVD index. This case clearly implies that the industry captures more value-added from regional production networks. The second category is ‘substantial winners’ refer to the industry whose world export share decreases but the point of IVD index increases. This is an interesting case in which that
the industry looses the world market; however, it may still enjoy more gains due to less value leakages to other countries. The third category is ‘questionable winners,’ an opposite case to the previous one. The last category is ‘absolute losers’ whose world export shares decreases and more value-added leaked-out to other economies.
5. The Results
5-1. Data Sources and Notes
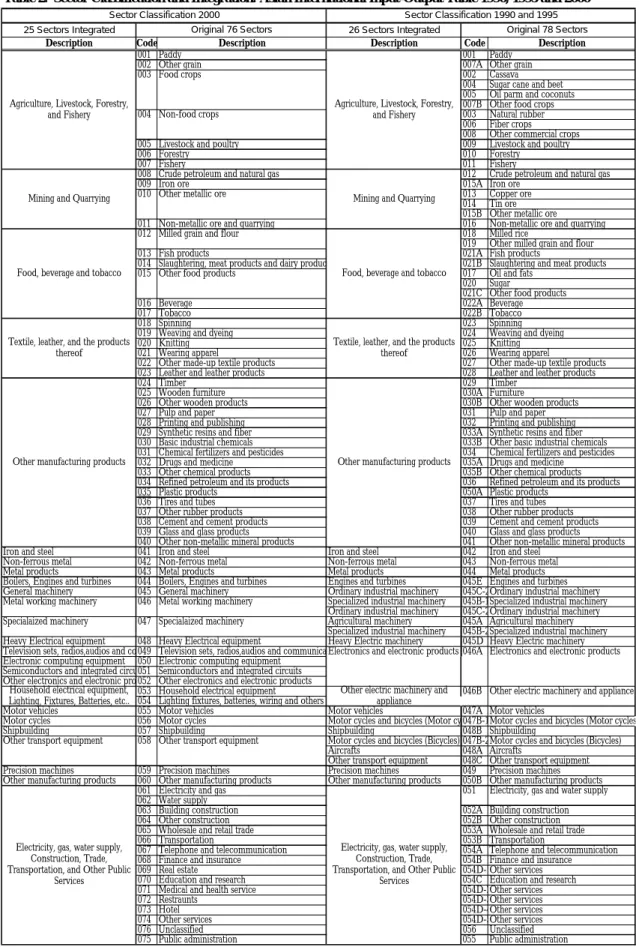
Two data sets are principal sources of information in this study. The first one is the Asian International Input-Output Table in 1990, 1995 and 2000, published by Institute of Developing Economies, Japan. 78 and 76 sectors are available for 1990, 1995 and 2000 tables, respectively; however, for a technical reason, irrelevant sectors are integrated to reduce totally 26 sectors in 1990 and 1995 and 25 sectors in 2000. Table 2 explains the sector classification modified for this study. Another data set is UN Comtrade database to obtain the world markets shares of the electronics and automobile industries. The industrial classification of trade we use is, in most cases, on two-digit basis of SITC Rev.2.
***** Tables 2 here *****
This study focuses on ten major economies in the Asia-Pacific region; i.e., China, Indonesia, Japan, Korea, Malaysia, Philippines, Singapore, Taiwan, Thailand, and the United States. These economies appear on the Asian International Input-Output tables as endogenous, while the imports form Hong Kong and the rest of the world (ROW) is treated as non-competitive and exogenous. This study explicitly involves USA, as its economic influence is thought tremendous on East Asian production networks; therefore, for the following arguments, the word ‘East Asia’ includes USA, otherwise noted. Electronics and automobile industries are the central focus of this study; therefore, the following analysis is concentrated on the two industries.
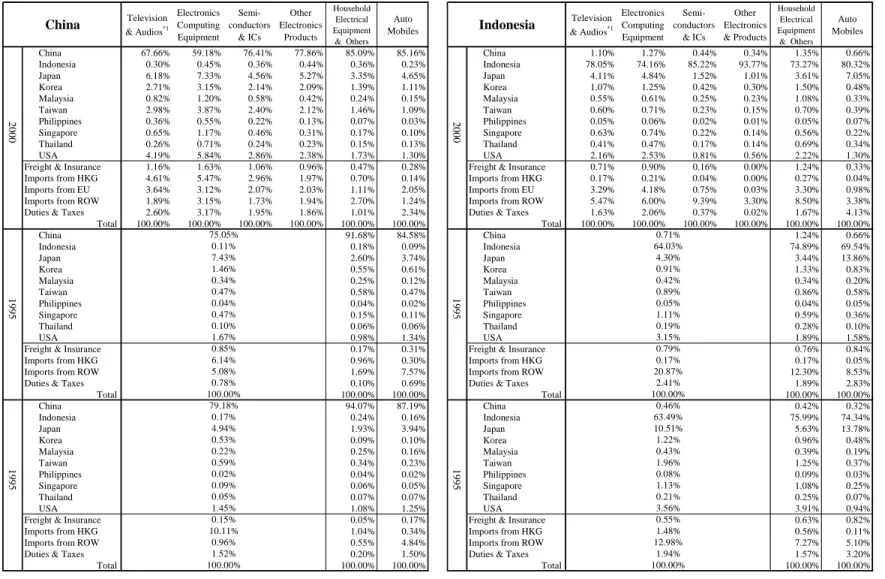
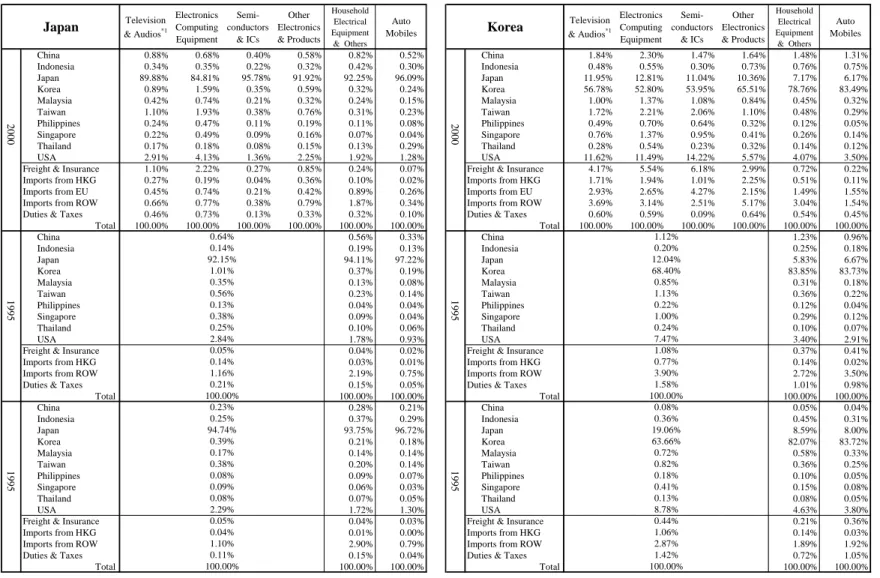
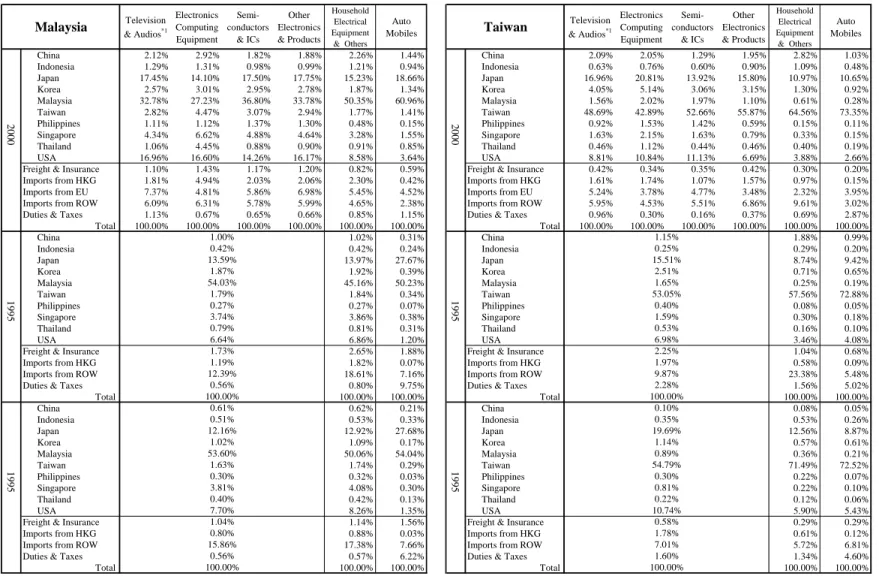
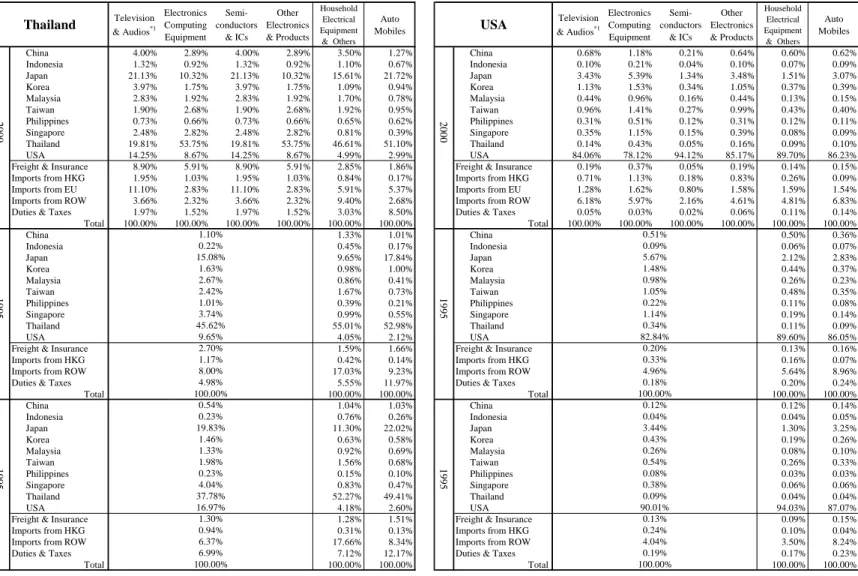
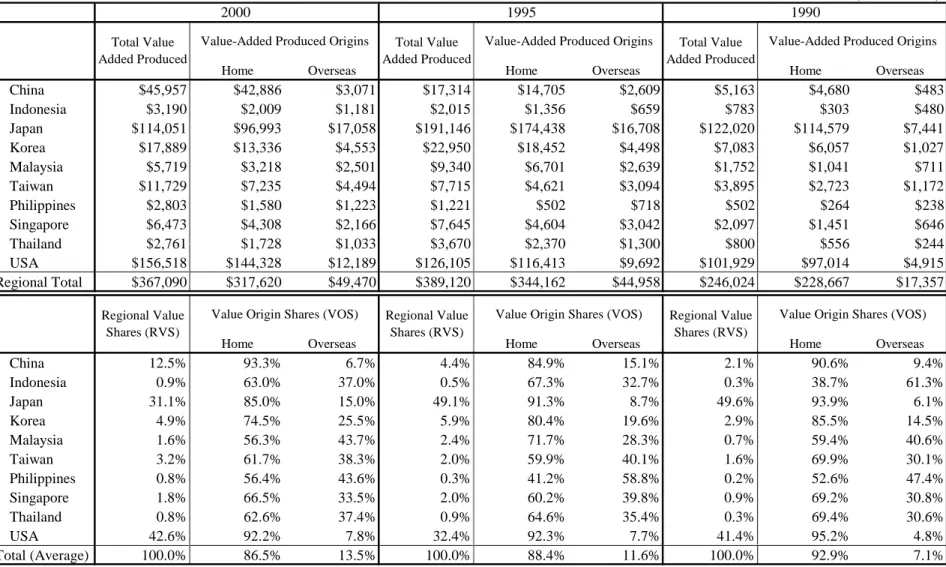
***** Tables 3, 4, 5 here *****
Tables 3, 4 and 5 set out the main results. Table 3 presents the IVD (international value distribution) index by industry and country. The tables aim to show the relative value-loss out-flown from the country concerned. It shows the percentage shares of the industries’ value-added retained by home country as well as those out-flown to other
economies. For instance, in 2000, China retained 85.16% of total value-added generated by home automobile industries; however, the rest was out-flown to other economies or disappeared as freight and insurance costs or tariffs. In this year, Japan was the largest beneficiary who captured 4.65% of value-added which Chinese automobile sector created. Note hereafter that the word ‘home’ implies territorial dimensions and, therefore, does not necessarily mean the locally-owned; it often includes foreign-owned companies operating within the country concerned. Table 4 shows the world market shares of the East Asia’s electronics and automobile industries in 1990, 1995 and 2000. Table 5 also shows the regional value share (RVS) structure of electronics and automobile industries among the ten countries concerned. It also shows the international value distribution but gives a slightly different picture from Table 3. It shows the relative contributions of the industry concerned to the total value-added creation in East Asia. The figures in the upper tables show an absolute term of value-added gained in the ten economies while the lower shows its percentage shares; that is, regional value shares (RVS) and value origin shares (VOS). The following examples may be helpful for clear understanding. In 2000, for instance, China gains US$ 45,957 million value in regional electronics industries, constituting 12.5% of total value-added the regional electronics industry created, of which US$ 43 billion (93.3%) was produced and retained within its home electronics industries and the rest of US$ 3 billion (6.7%) was in-flown from other economies’ electronics sectors. Such value-added inflows are explained by China’s contribution to foreign electronics sectors by means of intermediates used directly and indirectly for those sectors.
5-2. Results
The results can be summarised by the four categories proposed in the previous section. Mixed samples which are unfitted for those categories are omitted from discussion.
a) Absolute Winners (gaining larger world market shares and RVS) All regional electronics industries except for Japan and USA
b) Questionable Winners (gaining world market shares but the relative value-added loss) Automobile industries of Korea and Thailand
c) Potential Winners (loosing world market shares but gains more value-added) Automobile industry of China and electronics industry of USA
d) Absolute Loser (loosing world market shares and regional value-added shares) Electronics and automobile industries of Japan
The following part of this section examines these four cases.
5-2-a. Absolute Winners
During the 1990s, East Asian electronics industry (excluding Japan) achieved a remarkable development. The result clearly confirms this. The industry has gained growing shares of the world export market. The typical winner is China, increasing its share in the world export market rapidly from 1.02% in 1990 to 5.03% in 2000. Other East Asian economies also show similar trends but with a lesser extent.
In addition to this achievement, the industries have enjoyed growing shares of regional value-added. The value-added capture can be explained by two different sources. The first factor is RVS, country’s relative share to total value-added which the regional electronics industry created. Regarding this point, Table 5-1 clearly indicates that all of these industries have enjoyed gaining larger shares of regional value-added creation. The overall gains have been attributed to the steady reduction of Japan’s share.
The second factor is IVD, what extent value-added is retained within the local economy. The result is, however, rather mixed. As table 3 shows, the electronics industries in Malaysia, Philippines and Thailand have failed to retain increasing percentages of value-added within local economies, allowing larger shares of value-added out-flown to overseas. The largest beneficiary is Japan, implying the increasing dependence of these countries on the intermediates imported from Japan.
5-2-b. Questionable Winners
My result suggests that Korean and Thai automobile industries fall into this category. The industries have steadily gained the world market shares; however, their success is questionable since they may not have enjoyed larger value-added. The following passage examines this.
Bangkok has aggressively attracted global automobile companies and the city is becoming ASEAN’s centre of the automobile production, as is often called ‘Southeast Asia’s Detroit’; however, Table 5-2 shows that, in RVS index, Thailand’s contribution to the total regional value-added creation was only 0.8% in 2000, accompanied with a slightly declining trend from 0.9% in 1990. Meanwhile, Korea is the third largest automobile producer in the region; however, this country also decreased in RVS from 5.1% in 1990 to 3.7% in 2000.
These results are rather puzzling, as the automobile industrialisation of Korea and Thailand has been often referred as successful cases. One of the possible explanations is
the impact of the Asian financial crisis. Due to the heavy devaluation of the local currencies, the performance of Korean and Thai automobile sectors might be underestimated. However, the puzzle still remains, as the electronics sectors of both economies show a relatively good performance in export and value capture.
5-3-c. Potential Winners
This category includes China’s automobile and US’s electronics industries. The industries have witnessed a slight loss in the world market shares but remarkably increasing gains in the regional value shares (RVS). Thus, the net effects can be positive. They also show relatively higher percentage in retaining value-added which the home industries produced. Therefore, the industries can be seen as substantial winners in the regional production networks.
It is reasonable to assume that these features are related to the massive inflows of FDI into the industries during the 1990s. Larger FDI inflows would contribute to building a larger local production base, resulting in the reduction of the external dependence in terms of value-added out-flows.
5-2-d. Losers
In my study, only Japanese electronics and automobile industries appear as losers. Table 4 and 5 clearly shows this; the shares of the world markets, as well as the shares to total regional value-added (RVS), have substantially decreased in both industries. Such significant downdraft of Japan can be partly explained by relative higher growth of other vital economies in the region; however, a more fundamental factor may lie in Japanese economy itself. The economy experienced an extremely tough period after the Bubble boom burst in 1989, and the recession prolonged over the decade. Companies could not afford additional investments in production, R&D, human resources, and so on, resulting in loosing international competitiveness in electronics and automobile sectors. This is often called ‘Japan’s lost decade of the 1990s’. My result clearly confirms the Japanese declining presence in regional economy over the 1990s.
5-3. Japan’s Retreat and the Resurgence of US?
Several important remarks should be added to explain the role of Japan and the US economies in the regional production networks of East Asia. In this regard, the following two points should be noted.
First, a qualitative change has been witnessed in the role of Japan in the regional production networks. The result clearly suggests that, in terms of exports, output, and
value-creation, Japan’s declining presence in the East Asian electronics and automobile industries is undoubted. However, this does not necessarily means that Japan’s role in the regional production networks has been less important. Instead, its role has been gradually changed qualitatively; from inward-oriented to more external networks-oriented. In terms of the value origin shares, the country increasingly gains from external economies, implying that the Japanese economy is more embedded into the regional production networks, especially in the electronics sector.
Second, the US economy shows a remarkable increase in its importance in some East Asian economies. This is particular in the semiconductor industries of China and Malaysia. During the decade of the 1990s, the IVD indexes increases from 1.45% to 5.84% and from 7.70% to 14.26%, respectively. Other sectors also show, in general, increasing trends of US contributions in value-added. This implies that the East Asian economy has involved more US participations into the regional production networks as a supplier base.
5-4. Differences between electronics and automobile production networks
As Table 3 and 5 clearly show, there is a general tendency that the automobile industry is more inward-oriented than the electronics in terms of the value-added distributions. For instance, for most East Asian economies, the automobile sectors enjoy retaining more than 80% of total value-added within the home economies. Malaysia, Korea, Taiwan, Philippines and Thailand enjoy smaller percentages than this; however, the electronics sectors of those economies show even smaller percentages. The fact implies that the automobile sector may have a larger spillover impact on indigenous industries in terms of value-added creation than that of the electronics sector.
6. Summary and Conclusion
This study examined the international value distributions in the regional production networks of East Asia. The East Asian economies, in general, have achieved successful export-oriented industrialisation; however, my principle concern is to investigate the unevenness of value allocation among regional individual economies; which economy gains the most and which the least? The input-output method is employed to trace the creation and flows of value-added among the ten Asia-Pacific economies including the US. The performance was evaluated both by value-added acquisition and world export market shares. The findings were summarised as follows.
have been successful to reap a large benefit from the regional production networks in terms of gaining more value-added and world market shares. Second, Japanese electronics and automobile industries shrank drastically during the 1990s, allowing other East Asian economies to enjoy more value-added capture. Third, Korean and Thai automobile sectors appeared as unsuccessful cases in terms of value capture.
For a general conclusion, the following points should be noted.
First, our results clearly show rather unsuccessful economic performance of TNC-led industrialisation pursued in ASEAN economies. The industrialisation policy has largely allowed TNCs to decide how much value-added would remain in the host economy. The outcome is considerably unfavourable for the host economy. An extreme case is Malaysia which could retain only less than 40% of total value-added the country’s electronics sectors created in 2000, and the rest has been flown-out externally. Moreover, such value outflows have been exaggerated as time goes. A similar tendency is reported in other ASEAN economies. Thus, this study concludes that a larger value loss is one of the economic consequences of TNC dependence.
The second consideration is the impact of Asian financial crisis. Indonesia, Korea, Malaysia, and Thailand were the countries which were most seriously hit by the crisis. After the crisis, these economies have increased world export market shares both in electronics and automobile, mainly thanks to the currency devaluations. However, there is no general tendency in the change of the IVD index. While Korean and Malaysian electronics sectors shows the loss of the value-added shares after the crisis, the industries in Indonesia and Thailand shows relatively stable, or even increasing, trends. Automobile sectors are also relatively stable in IVD index. Thus, the overall result is mixed; some countries incurred loss while others did not.
Finally, it is important to mention the role of the US economy in the East Asian production networks. As the result of my study shows, the US economic resurgence is confirmed, particularly after the economic crisis. However, this is somehow surprising to our conventional knowledge. It is generally believed that the US large companies have widely outsourced their peripheral activities to external agents including foreign manufactures. East Asian companies are seen as one of the largest beneficiaries from their outsourcing activities. This should have provided wider opportunities for them to capture more value-added; however, the result shows the contrary. However, this is what the GVC analysis predicted; the largest value-added nodes remain within the US home and less profitable segments were outsourced externally. The study clearly shows that the US increasingly reaps the benefits from the East Asian production networks.
- References -
Ernst, D. and L. Kim (2002) "Global Production Networks, Knowledge Diffusion, and Local Capability Formation" Research Policy 31(8-9): 1417-29.
Fröbel, F., Jürgen, H. & Otto, K. (1980) The New International Division of Labour. Cambridge, Cambridge University Press.
Fujikawa, K., M. Shimoda, and Watanabe, T. (2005) "The Structure of International Division of Labor in the Asia-Pacific Region" Konan Ronshu 46(3): 1-34. Gereffi, G. (1999) “International Trade and Industrial Upgrading in the Apparel
Commodity Chain” Journal of International Economics, 48(1) 37-70
Gereffi, G. and R. Kaplinsky (2001) The Value of Value Chains: Spreading the Gains from Globalisation. IDS Bulletin
Gereffi, G. and Korzeniewicz, M. (Eds.) (1994) Commodity Chains and Global Capitalism Westport, CT; Praeger
Henderson, J. (1998). Danger and Opportunity in the Asia-Pacific” In G. Thompson (Ed.). Economic Dynamism in the Asia-Pacific. Routledge
Hobday, M. (1995) "East Asian Latecomer Firms: Learning the Technology of
Electronics." World Development 23(7): 1171-93.
Hobday, M. (2001) "The Electronics Industries of the Asia-Pacific: Exploiting International Production Networks for Economic Development." Asian Pacific Economic Literature 15(1): 13-29.
Kaplinsky, R. (2000). Globalisation and Unequalisation: What Can Be Learned from Value Chain Analysis? Journal of Development Studies, 37(2), 117-146.
Kawai, M. (2005) "East Asian Economic Regionalism: Progress and Challenges." Journal of Asian Economics 16(1): 29-55.
Kimura, F. and M. Ando (2003) "Fragmentation and Agglomeration Matter: Japanese Multinationals in Latin America and East Asia" North American Journal of Economics and Finance 14: 287-317.
Kimura, F. and M. Ando (2005) "Two-Dimensional Fragmentation in East Asia:
Conceptual Framework and Empirics." International Review of Economics and
Finance 14(3): 317-48.
Lall, S. (1995) "Industrial Strategy and Policies on Foreign Direct Investment in East Asia" Transnational Corporations 4(3): 1-26.
Lall, S., M. Albaladejo, J. Zhang (2004) "Mapping Fragmentation: Electronics and Automobiles in East Asia and Latin America." Oxford Development Studies
32(3): 407-32.
Matsumura, F. and K. Fujikawa (1998) Economic Analysis of "Home Production", Iwanami Shoten (in Japanese).
Ng, F. and A. Yeats (1999) Production Sharing in East Asia: Who Does What for Whom, and Why?, World Bank; World Bank.
Oikawa, H. (2004). Is Proton Car Really Made by Malaysians? mimeo
Petri, P. A. (2006) "Is East Asia Becoming More Interdependent?" Journal of Asian
Economics 17: 381-394.
Sohn, B. H. (2002) “Regionalization of Trade and Investment in East Asia and Prospects for Further Regional Integration.” Journal of the Asia Pacific Economy, 7(2), pp.160-181.
Table 2. Sector Classification and Integration: Asian International Input-Output Table 1990, 1995 and 2000
25 Sectors Integrated 26 Sectors Integrated
Description Code Description Description Code Description
001 Paddy 001 Paddy
002 Other grain 007A Other grain 003 Food crops 002 Cassava
004 Sugar cane and beet 005 Oil parm and coconuts 007B Other food crops 004 Non-food crops 003 Natural rubber
006 Fiber crops 008 Other commercial crops 005 Livestock and poultry 009 Livestock and poultry 006 Forestry 010 Forestry 007 Fishery 011 Fishery
008 Crude petroleum and natural gas 012 Crude petroleum and natural gas 009 Iron ore 015A Iron ore
010 Other metallic ore 013 Copper ore 014 Tin ore 015B Other metallic ore 011 Non-metallic ore and quarrying 016 Non-metallic ore and quarrying 012 Milled grain and flour 018 Milled rice
019 Other milled grain and flour 013 Fish products 021A Fish products
014 Slaughtering, meat products and dairy produc 021B Slaughtering and meat products 015 Other food products 017 Oil and fats
020 Sugar
021C Other food products 016 Beverage 022A Beverage 017 Tobacco 022B Tobacco 018 Spinning 023 Spinning 019 Weaving and dyeing 024 Weaving and dyeing 020 Knitting 025 Knitting 021 Wearing apparel 026 Wearing apparel
022 Other made-up textile products 027 Other made-up textile products 023 Leather and leather products 028 Leather and leather products
024 Timber 029 Timber
025 Wooden furniture 030A Furniture
026 Other wooden products 030B Other wooden products 027 Pulp and paper 031 Pulp and paper 028 Printing and publishing 032 Printing and publishing 029 Synthetic resins and fiber 033A Synthetic resins and fiber 030 Basic industrial chemicals 033B Other basic industrial chemicals 031 Chemical fertilizers and pesticides 034 Chemical fertilizers and pesticides 032 Drugs and medicine 035A Drugs and medicine
033 Other chemical products 035B Other chemical products 034 Refined petroleum and its products 036 Refined petroleum and its products 035 Plastic products 050A Plastic products
036 Tires and tubes 037 Tires and tubes 037 Other rubber products 038 Other rubber products 038 Cement and cement products 039 Cement and cement products 039 Glass and glass products 040 Glass and glass products 040 Other non-metallic mineral products 041 Other non-metallic mineral products Iron and steel 041 Iron and steel Iron and steel 042 Iron and steel
Non-ferrous metal 042 Non-ferrous metal Non-ferrous metal 043 Non-ferrous metal Metal products 043 Metal products Metal products 044 Metal products Boilers, Engines and turbines 044 Boilers, Engines and turbines Engines and turbines 045E Engines and turbines General machinery 045 General machinery Ordinary industrial machinery 045C-2Ordinary industrial machinery Metal working machinery 046 Metal working machinery Specialized industrial machinery 045B-1Specialized industrial machinery
Ordinary industrial machinery 045C-2Ordinary industrial machinery Specialaized machinery 047 Specialaized machinery Agricultural machinery 045A Agricultural machinery
Specialized industrial machinery 045B-2Specialized industrial machinery Heavy Electrical equipment 048 Heavy Electrical equipment Heavy Electric machinery 045D Heavy Electric machinery Television sets, radios,audios and co049 Television sets, radios,audios and communica Electronics and electronic products 046A Electronics and electronic products Electronic computing equipment 050 Electronic computing equipment
Semiconductors and integrated circu051 Semiconductors and integrated circuits Other electronics and electronic pro 052 Other electronics and electronic products
053 Household electrical equipment 046B Other electric machinery and appliance 054 Lighting fixtures, batteries, wiring and others
Motor vehicles 055 Motor vehicles Motor vehicles 047A Motor vehicles
Motor cycles 056 Motor cycles Motor cycles and bicycles (Motor cy 047B-1Motor cycles and bicycles (Motor cycles Shipbuilding 057 Shipbuilding Shipbuilding 048B Shipbuilding
Other transport equipment 058 Other transport equipment Motor cycles and bicycles (Bicycles) 047B-2Motor cycles and bicycles (Bicycles) Aircrafts 048A Aircrafts
Other transport equipment 048C Other transport equipment Precision machines 059 Precision machines Precision machines 049 Precision machines Other manufacturing products 060 Other manufacturing products Other manufacturing products 050B Other manufacturing products
061 Electricity and gas 051 Electricity, gas and water supply 062 Water supply
063 Building construction 052A Building construction 064 Other construction 052B Other construction 065 Wholesale and retail trade 053A Wholesale and retail trade 066 Transportation 053B Transportation
067 Telephone and telecommunication 054A Telephone and telecommunication 068 Finance and insurance 054B Finance and insurance 069 Real estate 054D-1Other services 070 Education and research 054C Education and research 071 Medical and health service 054D-2Other services 072 Restraunts 054D-3Other services 073 Hotel 054D-4Other services 074 Other services 054D-5Other services 076 Unclassified 056 Unclassified 075 Public administration 055 Public administration Other manufacturing products Other manufacturing products
Electricity, gas, water supply, Construction, Trade, Transportation, and Other Public
Services Electricity, gas, water supply,
Construction, Trade, Transportation, and Other Public
Services
Other electric machinery and appliance Household electrical equipment,
Lighting, Fixtures, Batteries, etc..
Food, beverage and tobacco
Textile, leather, and the products thereof
Original 78 Sectors Sector Classification 2000 Sector Classification 1990 and 1995
Original 76 Sectors
Food, beverage and tobacco
Textile, leather, and the products thereof Agriculture, Livestock, Forestry,
and Fishery
Mining and Quarrying
Agriculture, Livestock, Forestry, and Fishery
Table 3. International Value Distribution Index Television & Audios*1 Electronics Computing Equipment Semi-conductors & ICs Other Electronics Products Household Electrical Equipment & Others Auto Mobiles Television & Audios*1 Electronics Computing Equipment Semi-conductors & ICs Other Electronics & Products Household Electrical Equipment & Others Auto Mobiles China 67.66% 59.18% 76.41% 77.86% 85.09% 85.16% China 1.10% 1.27% 0.44% 0.34% 1.35% 0.66% Indonesia 0.30% 0.45% 0.36% 0.44% 0.36% 0.23% Indonesia 78.05% 74.16% 85.22% 93.77% 73.27% 80.32% Japan 6.18% 7.33% 4.56% 5.27% 3.35% 4.65% Japan 4.11% 4.84% 1.52% 1.01% 3.61% 7.05% Korea 2.71% 3.15% 2.14% 2.09% 1.39% 1.11% Korea 1.07% 1.25% 0.42% 0.30% 1.50% 0.48% Malaysia 0.82% 1.20% 0.58% 0.42% 0.24% 0.15% Malaysia 0.55% 0.61% 0.25% 0.23% 1.08% 0.33% Taiwan 2.98% 3.87% 2.40% 2.12% 1.46% 1.09% Taiwan 0.60% 0.71% 0.23% 0.15% 0.70% 0.39% Philippines 0.36% 0.55% 0.22% 0.13% 0.07% 0.03% Philippines 0.05% 0.06% 0.02% 0.01% 0.05% 0.07% Singapore 0.65% 1.17% 0.46% 0.31% 0.17% 0.10% Singapore 0.63% 0.74% 0.22% 0.14% 0.56% 0.22% Thailand 0.26% 0.71% 0.24% 0.23% 0.15% 0.13% Thailand 0.41% 0.47% 0.17% 0.14% 0.69% 0.34% USA 4.19% 5.84% 2.86% 2.38% 1.73% 1.30% USA 2.16% 2.53% 0.81% 0.56% 2.22% 1.30%
Freight & Insurance 1.16% 1.63% 1.06% 0.96% 0.47% 0.28% Freight & Insurance 0.71% 0.90% 0.16% 0.00% 1.24% 0.33%
Imports from HKG 4.61% 5.47% 2.96% 1.97% 0.70% 0.14% Imports from HKG 0.17% 0.21% 0.04% 0.00% 0.27% 0.04%
Imports from EU 3.64% 3.12% 2.07% 2.03% 1.11% 2.05% Imports from EU 3.29% 4.18% 0.75% 0.03% 3.30% 0.98%
Imports from ROW 1.89% 3.15% 1.73% 1.94% 2.70% 1.24% Imports from ROW 5.47% 6.00% 9.39% 3.30% 8.50% 3.38%
Duties & Taxes 2.60% 3.17% 1.95% 1.86% 1.01% 2.34% Duties & Taxes 1.63% 2.06% 0.37% 0.02% 1.67% 4.13%
Total 100.00% 100.00% 100.00% 100.00% 100.00% 100.00% Total 100.00% 100.00% 100.00% 100.00% 100.00% 100.00% China 91.68% 84.58% China 1.24% 0.66% Indonesia 0.18% 0.09% Indonesia 74.89% 69.54% Japan 2.60% 3.74% Japan 3.44% 13.86% Korea 0.55% 0.61% Korea 1.33% 0.83% Malaysia 0.25% 0.12% Malaysia 0.34% 0.20% Taiwan 0.58% 0.47% Taiwan 0.86% 0.58% Philippines 0.04% 0.02% Philippines 0.04% 0.05% Singapore 0.15% 0.11% Singapore 0.59% 0.36% Thailand 0.06% 0.06% Thailand 0.28% 0.10% USA 0.98% 1.34% USA 1.89% 1.58%
Freight & Insurance 0.17% 0.31% Freight & Insurance 0.76% 0.84%
Imports from HKG 0.96% 0.30% Imports from HKG 0.17% 0.05%
Imports from ROW 1.69% 7.57% Imports from ROW 12.30% 8.53%
Duties & Taxes 0.10% 0.69% Duties & Taxes 1.89% 2.83%
Total 100.00% 100.00% Total 100.00% 100.00% China 94.07% 87.19% China 0.42% 0.32% Indonesia 0.24% 0.16% Indonesia 75.99% 74.34% Japan 1.93% 3.94% Japan 5.63% 13.78% Korea 0.09% 0.10% Korea 0.96% 0.48% Malaysia 0.25% 0.16% Malaysia 0.39% 0.19% Taiwan 0.34% 0.23% Taiwan 1.25% 0.37% Philippines 0.04% 0.02% Philippines 0.09% 0.03% Singapore 0.06% 0.05% Singapore 1.08% 0.25% Thailand 0.07% 0.07% Thailand 0.25% 0.07% USA 1.08% 1.25% USA 3.91% 0.94%
Freight & Insurance 0.05% 0.17% Freight & Insurance 0.63% 0.82%
Imports from HKG 1.04% 0.34% Imports from HKG 0.56% 0.11%
Imports from ROW 0.55% 4.84% Imports from ROW 7.27% 5.10%
Duties & Taxes 0.20% 1.50% Duties & Taxes 1.57% 3.20%
Total 100.00% 100.00% Total 100.00% 100.00%
Note: The sectors 'Television and Audios' includes radios and communication equipment, 'Household electrical equipment include lighting fixtures, batteries, wiring and others; and 'Automobile' include its component. The names and sectoral classifications are taken directly from Asian International Input-Output Tables. On 1990 and 1995 tables, the first four electronics sectors are aggregated into one sector.
1.13% 0.21% 3.56% 100.00% 0.55% 1.48% 12.98% 1.94% 2.41% 100.00% 199 5 0.46% 63.49% 10.51% 1.22% 0.43% 1.96% 0.08% 3.15% 0.79% 0.17% 20.87% 199 5 0.71% 64.03% 4.30% 0.91% 0.42% 0.89% 0.05% 1.11% 0.19% 1.52% 100.00% 1.45% 0.15% 10.11% 0.96% 199 5 79.18% 0.17% 4.94% 0.53% 0.22% 0.59% 0.02% 0.09% 0.05% 0.78% 100.00% 199 5 0.10% 1.67% 0.85% 6.14% 0.34% 0.47% 0.04% Indonesia China 2 000 5.08% 0.47% 75.05% 0.11% 7.43% 1.46% 2 000
Table 3. International Value Distribution Index (Continued 1) Television & Audios*1 Electronics Computing Equipment Semi-conductors & ICs Other Electronics & Products Household Electrical Equipment & Others Auto Mobiles Television & Audios*1 Electronics Computing Equipment Semi-conductors & ICs Other Electronics & Products Household Electrical Equipment & Others Auto Mobiles China 0.88% 0.68% 0.40% 0.58% 0.82% 0.52% China 1.84% 2.30% 1.47% 1.64% 1.48% 1.31% Indonesia 0.34% 0.35% 0.22% 0.32% 0.42% 0.30% Indonesia 0.48% 0.55% 0.30% 0.73% 0.76% 0.75% Japan 89.88% 84.81% 95.78% 91.92% 92.25% 96.09% Japan 11.95% 12.81% 11.04% 10.36% 7.17% 6.17% Korea 0.89% 1.59% 0.35% 0.59% 0.32% 0.24% Korea 56.78% 52.80% 53.95% 65.51% 78.76% 83.49% Malaysia 0.42% 0.74% 0.21% 0.32% 0.24% 0.15% Malaysia 1.00% 1.37% 1.08% 0.84% 0.45% 0.32% Taiwan 1.10% 1.93% 0.38% 0.76% 0.31% 0.23% Taiwan 1.72% 2.21% 2.06% 1.10% 0.48% 0.29% Philippines 0.24% 0.47% 0.11% 0.19% 0.11% 0.08% Philippines 0.49% 0.70% 0.64% 0.32% 0.12% 0.05% Singapore 0.22% 0.49% 0.09% 0.16% 0.07% 0.04% Singapore 0.76% 1.37% 0.95% 0.41% 0.26% 0.14% Thailand 0.17% 0.18% 0.08% 0.15% 0.13% 0.29% Thailand 0.28% 0.54% 0.23% 0.32% 0.14% 0.12% USA 2.91% 4.13% 1.36% 2.25% 1.92% 1.28% USA 11.62% 11.49% 14.22% 5.57% 4.07% 3.50%
Freight & Insurance 1.10% 2.22% 0.27% 0.85% 0.24% 0.07% Freight & Insurance 4.17% 5.54% 6.18% 2.99% 0.72% 0.22%
Imports from HKG 0.27% 0.19% 0.04% 0.36% 0.10% 0.02% Imports from HKG 1.71% 1.94% 1.01% 2.25% 0.51% 0.11%
Imports from EU 0.45% 0.74% 0.21% 0.42% 0.89% 0.26% Imports from EU 2.93% 2.65% 4.27% 2.15% 1.49% 1.55%
Imports from ROW 0.66% 0.77% 0.38% 0.79% 1.87% 0.34% Imports from ROW 3.69% 3.14% 2.51% 5.17% 3.04% 1.54%
Duties & Taxes 0.46% 0.73% 0.13% 0.33% 0.32% 0.10% Duties & Taxes 0.60% 0.59% 0.09% 0.64% 0.54% 0.45%
Total 100.00% 100.00% 100.00% 100.00% 100.00% 100.00% Total 100.00% 100.00% 100.00% 100.00% 100.00% 100.00% China 0.56% 0.33% China 1.23% 0.96% Indonesia 0.19% 0.13% Indonesia 0.25% 0.18% Japan 94.11% 97.22% Japan 5.83% 6.67% Korea 0.37% 0.19% Korea 83.85% 83.73% Malaysia 0.13% 0.08% Malaysia 0.31% 0.18% Taiwan 0.23% 0.14% Taiwan 0.36% 0.22% Philippines 0.04% 0.04% Philippines 0.12% 0.04% Singapore 0.09% 0.04% Singapore 0.29% 0.12% Thailand 0.10% 0.06% Thailand 0.10% 0.07% USA 1.78% 0.93% USA 3.40% 2.91%
Freight & Insurance 0.04% 0.02% Freight & Insurance 0.37% 0.41%
Imports from HKG 0.03% 0.01% Imports from HKG 0.14% 0.02%
Imports from ROW 2.19% 0.75% Imports from ROW 2.72% 3.50%
Duties & Taxes 0.15% 0.05% Duties & Taxes 1.01% 0.98%
Total 100.00% 100.00% Total 100.00% 100.00% China 0.28% 0.21% China 0.05% 0.04% Indonesia 0.37% 0.29% Indonesia 0.45% 0.31% Japan 93.75% 96.72% Japan 8.59% 8.00% Korea 0.21% 0.18% Korea 82.07% 83.72% Malaysia 0.14% 0.14% Malaysia 0.58% 0.33% Taiwan 0.20% 0.14% Taiwan 0.36% 0.25% Philippines 0.09% 0.07% Philippines 0.10% 0.05% Singapore 0.06% 0.03% Singapore 0.15% 0.08% Thailand 0.07% 0.05% Thailand 0.08% 0.05% USA 1.72% 1.30% USA 4.63% 3.80%
Freight & Insurance 0.04% 0.03% Freight & Insurance 0.21% 0.36%
Imports from HKG 0.01% 0.00% Imports from HKG 0.14% 0.03%
Imports from ROW 2.90% 0.79% Imports from ROW 1.89% 1.92%
Duties & Taxes 0.15% 0.04% Duties & Taxes 0.72% 1.05%
Total 100.00% 100.00% Total 100.00% 100.00%
Note: The sectors 'Television and Audios' includes radios and communication equipment, 'Household electrical equipment include lighting fixtures, batteries, wiring and others; and 'Automobile' include its component. The names and sectoral classifications are taken directly from Asian International Input-Output Tables. On 1990 and 1995 tables, the first four electronics sectors are aggregated into one sector.
100.00% 0.08% 0.09% 0.08% 2.29% 0.05% 0.04% 1.10% 0.11% 199 5 1.16% 0.21% 0.64% 0.23% 0.25% 94.74% 0.39% 0.17% 0.38% 0.25% 2.84% 0.05% 0.14% 2 000 100.00% 199 5 0.14% 92.15% 1.01% 0.35% 0.56% 0.13% 0.38% 2 000 199 5 1.12% 0.20% 12.04% 68.40% 0.85% 1.13% 0.22% 1.00% 0.24% 7.47% 1.08% 0.77% 199 5 0.08% 0.36% 19.06% 63.66% 0.72% 0.82% 8.78% 3.90% 1.58% 100.00% Japan Korea 100.00% 0.44% 1.06% 2.87% 1.42% 0.18% 0.41% 0.13%
Table 3. International Value Distribution Index (Continued 2) Television & Audios*1 Electronics Computing Equipment Semi-conductors & ICs Other Electronics & Products Household Electrical Equipment & Others Auto Mobiles Television & Audios*1 Electronics Computing Equipment Semi-conductors & ICs Other Electronics & Products Household Electrical Equipment & Others Auto Mobiles China 2.12% 2.92% 1.82% 1.88% 2.26% 1.44% China 2.09% 2.05% 1.29% 1.95% 2.82% 1.03% Indonesia 1.29% 1.31% 0.98% 0.99% 1.21% 0.94% Indonesia 0.63% 0.76% 0.60% 0.90% 1.09% 0.48% Japan 17.45% 14.10% 17.50% 17.75% 15.23% 18.66% Japan 16.96% 20.81% 13.92% 15.80% 10.97% 10.65% Korea 2.57% 3.01% 2.95% 2.78% 1.87% 1.34% Korea 4.05% 5.14% 3.06% 3.15% 1.30% 0.92% Malaysia 32.78% 27.23% 36.80% 33.78% 50.35% 60.96% Malaysia 1.56% 2.02% 1.97% 1.10% 0.61% 0.28% Taiwan 2.82% 4.47% 3.07% 2.94% 1.77% 1.41% Taiwan 48.69% 42.89% 52.66% 55.87% 64.56% 73.35% Philippines 1.11% 1.12% 1.37% 1.30% 0.48% 0.15% Philippines 0.92% 1.53% 1.42% 0.59% 0.15% 0.11% Singapore 4.34% 6.62% 4.88% 4.64% 3.28% 1.55% Singapore 1.63% 2.15% 1.63% 0.79% 0.33% 0.15% Thailand 1.06% 4.45% 0.88% 0.90% 0.91% 0.85% Thailand 0.46% 1.12% 0.44% 0.46% 0.40% 0.19% USA 16.96% 16.60% 14.26% 16.17% 8.58% 3.64% USA 8.81% 10.84% 11.13% 6.69% 3.88% 2.66%
Freight & Insurance 1.10% 1.43% 1.17% 1.20% 0.82% 0.59% Freight & Insurance 0.42% 0.34% 0.35% 0.42% 0.30% 0.20%
Imports from HKG 1.81% 4.94% 2.03% 2.06% 2.30% 0.42% Imports from HKG 1.61% 1.74% 1.07% 1.57% 0.97% 0.15%
Imports from EU 7.37% 4.81% 5.86% 6.98% 5.45% 4.52% Imports from EU 5.24% 3.78% 4.77% 3.48% 2.32% 3.95%
Imports from ROW 6.09% 6.31% 5.78% 5.99% 4.65% 2.38% Imports from ROW 5.95% 4.53% 5.51% 6.86% 9.61% 3.02%
Duties & Taxes 1.13% 0.67% 0.65% 0.66% 0.85% 1.15% Duties & Taxes 0.96% 0.30% 0.16% 0.37% 0.69% 2.87%
Total 100.00% 100.00% 100.00% 100.00% 100.00% 100.00% Total 100.00% 100.00% 100.00% 100.00% 100.00% 100.00% China 1.02% 0.31% China 1.88% 0.99% Indonesia 0.42% 0.24% Indonesia 0.29% 0.20% Japan 13.97% 27.67% Japan 8.74% 9.42% Korea 1.92% 0.39% Korea 0.71% 0.65% Malaysia 45.16% 50.23% Malaysia 0.25% 0.19% Taiwan 1.84% 0.34% Taiwan 57.56% 72.88% Philippines 0.27% 0.07% Philippines 0.08% 0.05% Singapore 3.86% 0.38% Singapore 0.30% 0.18% Thailand 0.81% 0.31% Thailand 0.16% 0.10% USA 6.86% 1.20% USA 3.46% 4.08%
Freight & Insurance 2.65% 1.88% Freight & Insurance 1.04% 0.68%
Imports from HKG 1.82% 0.07% Imports from HKG 0.58% 0.09%
Imports from ROW 18.61% 7.16% Imports from ROW 23.38% 5.48%
Duties & Taxes 0.80% 9.75% Duties & Taxes 1.56% 5.02%
Total 100.00% 100.00% Total 100.00% 100.00% China 0.62% 0.21% China 0.08% 0.05% Indonesia 0.53% 0.33% Indonesia 0.53% 0.26% Japan 12.92% 27.68% Japan 12.56% 8.87% Korea 1.09% 0.17% Korea 0.57% 0.61% Malaysia 50.06% 54.04% Malaysia 0.36% 0.21% Taiwan 1.74% 0.29% Taiwan 71.49% 72.52% Philippines 0.32% 0.03% Philippines 0.22% 0.07% Singapore 4.08% 0.30% Singapore 0.22% 0.10% Thailand 0.42% 0.13% Thailand 0.12% 0.06% USA 8.26% 1.35% USA 5.90% 5.43%
Freight & Insurance 1.14% 1.56% Freight & Insurance 0.29% 0.29%
Imports from HKG 0.88% 0.03% Imports from HKG 0.61% 0.12%
Imports from ROW 17.38% 7.66% Imports from ROW 5.72% 6.81%
Duties & Taxes 0.57% 6.22% Duties & Taxes 1.34% 4.60%
Total 100.00% 100.00% Total 100.00% 100.00%
Note: The sectors 'Television and Audios' includes radios and communication equipment, 'Household electrical equipment include lighting fixtures, batteries, wiring and others; and 'Automobile' include its component. The names and sectoral classifications are taken directly from Asian International Input-Output Tables. On 1990 and 1995 tables, the first four electronics sectors are aggregated into one sector.
2 000 100.00% 199 5 0.40% 1.00% 1.63% 0.30% 3.81% 199 5 1.73% 1.19% 12.39% 0.56% 0.61% 0.51% 12.16% 1.02% 53.60% 100.00% 0.42% 13.59% 1.87% 54.03% 1.79% 0.27% 3.74% 0.79% 6.64% 0.56% 7.70% 1.04% 0.80% 15.86% 2 000 199 5 1.15% 0.25% 15.51% 2.51% 1.65% 53.05% 0.40% 1.59% 0.53% 6.98% 2.25% 1.97% 199 5 0.10% 0.35% 19.69% 1.14% 0.89% 54.79% 10.74% 9.87% 2.28% 100.00% Malaysia Taiwan 100.00% 0.58% 1.78% 7.01% 1.60% 0.30% 0.81% 0.22%