JAIST Repository
https://dspace.jaist.ac.jp/Title Analyzing the Impact of Mitigation Strategies on the Spread of a Virus
Author(s) Nguyen, Thanh Dang; Bonnet, Francois; Defago, Xavier
Citation
Research report (School of Information Science, Japan Advanced Institute of Science and
Technology), IS-RR-2014-002: 1-16 Issue Date 2014-05-19
Type Technical Report
Text version publisher
URL http://hdl.handle.net/10119/12085 Rights
Description リサーチレポート(北陸先端科学技術大学院大学情報
Analyzing the Impact of Mitigation Strategies
on the Spread of a Virus
Thanh Dang Nguyen Fran¸cois Bonnet Xavier D´efago
School of Information Science, JAIST, Japan
Abstract
The spread of a virus and the containment of the spread have been widely studied in the literature. These two problems can be generalized in an abstraction of a two-side problem in which one side tries to spread the infection as much as possible while the other side tries to detect and limit the spread. The spread of a virus and the containment of the spread have been widely studied in the literature. These two problems can be generalized in an abstraction of a two-side problem in which one side tries to spread the infection as much as possible while the other side tries to detect and limit the spread.
Three parameters play an important role: (1) the probability of a successful infection, (2) the probability of a successful detection, and (3) the topology of the network. The existing studies consider both sides of this problem separately. They either study the spread without detection or study the containment when detection is perfectly accurate. A natural question that arises when attack detection may possibly be inaccurate, is whether it is possible to contain the spread and, if it is, then under what conditions?
This paper studies the two-side problem with defense strategies that can be grouped into two main classes; (1) Killing strategies, where a node decides to sacrifice itself and possibly deactivate some of its neighbors, and (2) Cutting strategies, where a node decides to cut or deactivate some communication links. Both classes aim at containing the epidemic by disconnecting infected nodes from healthy ones.
1
Introduction
The spread of a virus Consider the propagation of a virus in a large distributed system, such as the Internet, a sensor network, or a social network. An epidemic starts with an arbitrary node being initially infected, and then continues with every infected node continuously attempting to infect its neighbors. Obviously, if nothing is done, all connected nodes are eventually infected, and the time it takes only depends on the infection rate (i.e. the probability of success for each infection attempt), the topology of the network, and the location of the initial node.
There are already many studies on the propagation of computer virus. Most of them focus on these two aspects:
• Propose a realistic model to understand and reproduce accurately the spread of a partic-ular virus or worms in the real world [5, 23, 27, 30, 31].
• Analyze the effect of the network topology to the spread; calculating or measuring the epidemic threshold associated to that topology [4, 11, 12, 20, 21, 24–26].
The defense against a virus spread Consider now that, upon an unsuccessful infection attempt from a neighbor, a target node has a chance of detecting this attempt and possibly react to it. Can the infection be contained or slowed down? If yes, then under what circumstances, and what strategy would be effective in doing so?
With the appearance of worms, many researches investigate how to contain or quarantine the virus in different network environments [19, 28, 29, 31]. However, existing studies are based on the assumption of a perfect detection: when a node detects the virus attack and transmits some information (on how to detect) to other nodes, these other nodes can always detect the virus attack (i.e. the successful rate of detection is 1).
An imperfect virus detector Consider a smart virus that always evolves to make the de-tector unreliable quickly (such as polymorphic virus). The dede-tector can still detect the infection but with a successful rate smaller than 1. In this situation, what mechanism a node can do to globally contain the spread and what reliability level is required for the detector? Especially, in a topological network where nodes only have access to local information, strategies can only be based on simple criteria.
One of the simplest strategies consists in letting a node deactivate itself upon detecting an infection attempt, in the hope that this will create a “fence” of deactivated nodes to isolate the infected nodes from the remaining sane ones. This strategy is motivated by the classical approach used by firefighters, which is formally defined in [7, 9, 18] as a combinatorial problem: a fire spreads in a graph and one must deploy firefighters to contain its spread. The goal is similar but results are usually developed in a centralized model. Under that strategy, what are the probabilities of infection and detection such that the propagation is contained and some nodes remain sane?
Flooding and Percolation This containment problem is equivalent to probabilistic broad-cast (or information flooding) albeit with an opposite objective. Sasson et al. [22] and later Hu et al. [10] both study the question and show the relationship with the theory of percolation [2]. In short, this can be stated as follows. For a given topology, there exists a threshold (percolation threshold or critical probability) such that, with high probability, the entire system is infected if the infection rate is above that threshold, whereas the propagation is contained if it is below. This behavior is known as a phase transition.
Even after half a century of research on the topic, the value of the percolation threshold is known exactly for only very few classes of graphs. In particular, in the case of the infinite grid (square lattice), no exact value is known for the threshold. The currently best-known approximation is 0.59274598(4) [15] and was obtained through Monte-Carlo simulations. Contributions In this paper, we limit our study to three classical topologies; the regular square torus, the unit-disk graphs (a geometric random graph), and one family of small-world networks. We investigate the trade-offs involved in the propagation and its containment by studying the effect that different reactions may have on the critical probability with the idea that a higher threshold means that propagation is contained for higher values of the infection rate (and/or lower values of the detection probability).
We consider two families of strategies; some strategies that rely on the deactivation (killing) of nodes, while other strategies rely on cutting communication links. Even in a topology as simple and regular as the torus and under the simplest strategy, it is unlikely that an analytic solution exists (c.f., percolation threshold). For this reason, we have opted to study the problem through simulations.
We present an exhaustive study on the problem of propagation containment in computer networks. We study the effect of various strategies grouped into killing and cutting strategies. Our study covers three types of graphs, namely, the torus as representative of mesh structures, the unit-disk graph as representative of wireless sensor networks, and small-world graphs as a representative of overlay networks, social networks, and other infrastructure networks.
Structure The rest of the paper is structured as follows. Section 2 gives an overview of related work. Section 3 defines the model. Section 4 presents the topologies studied in this paper and the simulation settings. In Section 5 we present the containment strategies. Section 6, 7, and 8 analyze the containment strategies in the torus, the unit-disk graph, and small-world graphs, respectively. Finally Section 9 concludes the paper.
2
Related work
2.1 On the spread of a virus
Starting from the epidemiology in human community, much research has been conducted on propagation. The first mathematical models appeared in the 18th century, but modern models were essentially developed in the middle of the 20th century (e.g., [1, 13, 17]). While origi-nal models did not consider geographic distributions, more recent epidemic models consider geographic topologies, such as an infinite grid [8]).
Epidemic threshold Kephart and White [11] propose a birth-death model to study the spread of computer viruses in homogeneous sparse graphs and conclude that a pandemic occurs only when the infection rate exceeds a finite threshold that depends on the connectivity of the network (phase transition). They also extend their model to allow doing a virus scan [12].
Later, many works improve the results on the birth-death model and compute new epidemic thresholds. Pastor-Satorras and Vespignani [20, 21] look at the dynamics of epidemics in power-law scale free networks for which they find the critical threshold. Chakrabarti et al. [4] study an epidemic model with recovery and find that the propagation threshold is related to the eigenvalues of the adjacency matrix of the network. Lately, Van Mieghem et al. use mean field approximation to transform from individual random infection rates into an average infection rate [24, 25]. Their model is called N -intertwined Markov chain.
Modeling actual virus/worms In another direction, after the propagation of Code Red in 2001, many researches look for the most accurate model to reflect the spread of different kinds of viruses in the Internet. They propose different models from the scanning worms [23, 27, 30] to the event-based worms [28, 31]. Here, the question is to predict, as accurately as possible, the evolution of the expected number of infected entities in the network after the virus starts propagating.
2.2 On defense against a virus propagation
In virus defense area, there are many works studying how to contain or quarantine the virus or worms in different network environments [19, 29, 31]. The containment strategies can be classified into two main classes; proactive or reactive. In the first one, some nodes are initially immune to the virus and only other nodes can be infected. In the latter, all nodes are initially susceptible, but eventually any node may become immune if it detects the virus (or receive some informations from other nodes).
Moore et al. in [19], propose a model for scanning worms in complete graph topology and give a comparison between two reactive strategies; (1) blacklisting, upon detection of an infection, a node adds the attacker into a blacklist; and (2) filtering-content, upon detection of a virus, a node transmits its signature to all other nodes. They assume that when a node detects an infection, the information (blacklisted IP address, or virus’ signature) will be available to all other nodes after some time. They study the efficiency of both strategies when this delay varies. Under this model, filtering-content strategies perform better than blacklisting strategies.
Later, Zhou et al. [29] study the containment of worms in peer-to-peer network when an infected node randomly selects some of its neighbors to attack. Among the peers, some are proactively immune (called guardian nodes) and can detect any attack; the others are always infected (no chance of detection). With this model, by simulation of some classical peer-to-peer networks (Gnutella and KaZaA), they study the relationship between the final fraction of infected nodes and the fraction of guardian nodes. Not surprisingly, they found that choosing for guardians the nodes with a large number of neighbors helps to contain the infection.
In [31], Zou et al. deeply analyze the existing models of computer viruses propagation and propose an event-based model to study the defense of email worms spread in three topologies power-law, small-world, random graph. They first show that mathematical models usually largely overestimate epidemic spreading speed, justifying the need of simulations. Moreover they also introduce and study two proactive strategies: (1) random immunization in which immune nodes are randomly chosen and (2) selective immunization where the p percents of most connected nodes are immunized.
In all these works, immune nodes can always detect virus attack successfully. However, with a polymorphic (such as Sality [6]) or metamorphic virus, it may not be always possible to detect the virus correctly. In this context, several detectors are introduced in [3, 14, 16]. We call imperfect detection the ability to detect a virus but not always successfully. If we only have an imperfect detection, what the network should do to mitigate a spread? The proposed model in this work aims to study this question by varying the probability of detection.
3
Model and Definitions
Let G = (V, E) be a (potentially infinite) connected undirected graph, where V is the set of vertices (also called nodes), and E the set of edges. The graph G models a network, in which edge eij ∈ E represents a communication link between the two nodes i, j ∈ V . For any vertex
i ∈ V , let N [i] be its closed set of neighbors (i.e. including i itself). By an abuse of notation, for any set S of vertices, let N [S] be defined as N [S] = S
i∈S
N [i].
The network is synchronous and communication happens in rounds, also called timeslot. Starting from timeslot t = 1 the system evolves for an infinite number of timeslots. Initially, one node is infected by the virus. Then, in each timeslot, the virus can propagate from infected nodes to their neighbors via communication links.
3.1 States of nodes
At anytime, a node is in one of the following states; susceptible, infected, killed, or sane. The state of node i at the end of timeslot t is denoted by si(t) with si(t) ∈ {sus, inf , killed , sane}.
The meaning of these states is explained below:
• Infected : a node which is infected with the virus.
• Killed : a deactivated node; it does not participate in the network anymore. Deactivation can be decided by itself or may be triggered by one of its neighbors. Intuitively, a node decides to deactivate when it detects the infection in order to mitigate the spread. • Susceptible: a node which is neither infected nor killed, but can still be infected in the
future. A susceptible node is either a neighbor of an infected node, or there exists a path of susceptible nodes toward an infected node.
• Sane: a node which is neither infected nor killed, and has no risk of being infected in the future. A sane node is isolated from all infected nodes.
The state si(t) of node i at the end of timeslot t also corresponds to the state of i at the
beginning of timeslot t+1. Initially, only one node is infected and all other nodes are susceptible. The model does not consider recovery mechanisms; hence when a node is infected, killed, or sane; it is a permanent state. At the end of an execution, there is no more susceptible nodes. Either the entire system is infected, or it is partitioned by killed nodes into infected and sane components. As stated in the introduction, the goal is to contain the spread and possibly maximize the number of sane nodes.
3.2 States of edges
At any time, an edge is in one of the following two states; active or cut. The state of edge e at the end of timeslot t is denoted by se(t) with se(t) ∈ {active, cut }.
An edge is considered cut, when one (or both) of its extremities decides to stop using the corresponding communication link. Such unilateral decision (to cut a link) can be taken when a node detects or suspects one of its neighbors to be contaminated by the virus.
The state se(t) of edge e at the end of timeslot t also corresponds to the state of e at the
beginning of timeslot t + 1. Initially, all edges are active.
3.3 Virus propagation
In the network, the virus can propagate from infected nodes to susceptible neighbors via active communication links. The contamination is probabilistic and relies on two parameters p and q, respectively the infection probability and the detection probability. Both parameters are uniform for all edges. The risk of contamination of a susceptible node depends on its number of infected neighbors.
Single attack When, at the beginning of a timeslot t, a susceptible node j has only one infected neighbor i connected via an active edge, the virus may propagate from i to j. Formally, there can be a contamination from i to j if:
si(t − 1) = inf ∧ sj(t − 1) = sus ∧ seij(t − 1) = active
When these conditions are satisfied, there is an attack from i to j which leads to an infection, a detection, or a status quo:
• The attack is successful with probability p (where 0 ≤ p ≤ 1). In this case, the node j becomes infected and sj(t) = inf .
• The attack is detected with probability q (where 0 ≤ q ≤ 1 − p). In this case, the node j detects the attack; it does not become infected. Depending on the containment strategy, the reaction will change. The node may decide (1) to sacrifice itself (sj(t) = killed ), (2)
to cut the infectious link (seij(t) = cut ), or (3) to follow a more complex strategy, as
described later.
• The attack is neither successful nor detected with probability 1 − p − q.
Multiple attacks Multiple attacks can occur when a susceptible node j has more than a single infected neighbors connected with active edges. In our model, the multiple attacks are considered sequentially. Since the probabilities p and q are uniform for all edges, the order of attacks is not relevant.
• If a given attack is successful, the subsequent attacks are not considered. The targeted node becomes infected.
• If a given attack is neither successful nor detected, this attack is ignored and the subse-quent attacks have to be considered.
• If an attack is detected, the consideration of subsequent attacks depends on the contain-ment strategy followed by the targeted node:
– If it sacrifices itself, this sacrifice is prioritized compared to other attacks: the sub-sequent attacks are not considered. The targeted node changes to the killed state. – If it does not sacrifice itself (for example, it only cut the link carrying the attack):
the subsequent attacks are considered. The targeted node may detect other attacks and/or may become infected from another attack.
3.4 Containment strategies
This paper studies the possible actions that a susceptible node can take when it detects an infectious attack. In the following, we call a detector a node that detects an attack. We propose two families of strategies a detector can follow to mitigate the spread.
• Killing strategies (K-strategies): The detector decides to sacrifice itself by its deactivation (i.e. it updates to the killed state). In some strategies, it may also trigger the deactivation of some of its neighbors. The success of these additional deactivations depend on the state of these neighbors; infected nodes ignore the deactivation messages and remain in the infected state.
• Cutting strategies: The detector decides to cut the communication link carrying the attack. In some strategies, it also tries to cut some other links by sending link-removal messages to its neighbors. Similarly, these additional cuts depend on the state of the neighbors.
4
Topologies and simulation settings
4.1 Topologies
This paper focuses on three classical graph topologies; square torus, unit-disk graph, and one kind of small-world. The first one is a regular topology which allows to understand more easily the behaviors of different strategies. As explained later, this regularity allows us to find an equivalence with percolation theory, but these graphs are not so interesting from a practical point of view.
Therefore we also study the two other topologies since they represent more realistic networks. Unit-disk graphs are typically used to model ad-hoc wireless networks, while small-world topolo-gies can be used to model some types of social networks. In both cases, the graphs are generated randomly using different parameters (such as the number of nodes, the number of links, . . . ).
We define below more precisely each of these graphs.
Regular square torus We consider two-dimensional tori of size m × m, with m2 nodes. A torus corresponds to an undirected square grid where the left side is connected to the right side and, similarly, the top and bottom sides are also connected. Contrary to a grid, the torus exhibits a uniform structure “without sides.”
Unit-disk graph We consider two-dimensional unit-disk graphs U DG(n, x × y). A set of n nodes are deployed uniformly randomly on an x × y rectangle area. There is a communication link between two nodes if they are at Euclidean distance at most 1. Let ∆ be the average degree of a U DG(n, x × y), we use the notation GU DG(n, ∆) to refer to a unit disk graph having
average degree ∆. Parameters are chosen such that the generated graphs are connected with high probability.
Small-world graph We consider small-world graphs that are generated from unit-disk graphs. Given a unit-disk graph GU DG(n, ∆), we add ` random edges for each node. These “long edges”
are chosen uniformly randomly. We use the notation SW (n, ∆, `) to represent such generated small-world.
4.2 Simulation settings
We wrote a discrete simulation in C++ to study our containment strategies. We measure the number of infected, sacrificed, and sane nodes at the end of the spread. The number of nodes varies from 100 to 10, 000. For the two random topologies, other parameters (density, number of long links) also vary. The probability of infection p and the probability of detection q are changed from 0 to 1 by 0.01 steps. The results are stated at the 95% confidence interval level for absolute value. In the critical area of the phase transition, we repeat the simulation until the confidence interval is smaller than 2% of the value.
5
Containment strategies
This section describes the containment strategies that have been analyzed in this paper.
5.1 Killing strategies
We propose a family of killing strategies that differ in the number of nodes that are deac-tivated/killed. For all strategies, the detector deactivates itself, and in addition to its own
Table 1: Description of the killing strategies Kx-Hop Name List of deactivated vertices
K0-Hop detector only
K1-Hop detector and its 1-hop neighbors K2-Hop detector, its 1-hop and 2-hop neighbors Kx-Hop detector and all its neighbors up to x-hops
sacrifice, it tries to deactivate its neighbors up to a given hop count. The three main strategies are K0-Hop, K1-Hop, and K2-Hop but it can easily be generalized up to Kx-Hop as defined in Table 1.
In order to deactivate its neighbors, the detector sends deactivation messages. The behavior of a node receiving such a message depends on its current state:
• A susceptible node sacrifices itself as requested by the message, after having potentially forwarded the message as requested by the strategy.
• An infected nodes ignores the message; it does not forward the message and does not sacrifice itself.
• A deactivated node does not receive the message; it does not forward the message and is already deactivated.
The Figure 1 represents the three main killing strategies on a grid topology (for simplicity). The green node detects the infection from the red node and tries to deactivate all gray nodes. One should note that these deactivations are not always successful (see example of Figure 2).
sus./sane node, infected node, detector node, deact. node, infection msg, strategy msg.
(a) Strategy K0-Hop (b) Strategy K1-Hop (c) Strategy K2-Hop Figure 1: Representation (in a grid) of the three killing strategies
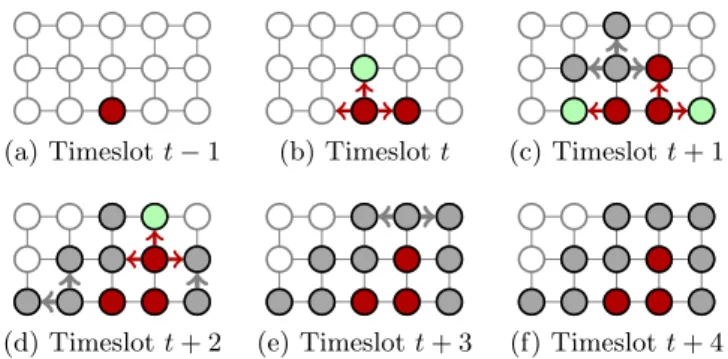
Example Figure 2 depicts a step-by-step execution of strategy K1-Hop in a 3 × 5 grid. An infected node attacks its neighbors at timeslot t; the top neighbor detects the attack, the right one becomes infected, and the left one is unaffected. Following strategy K1-Hop, the top neighbor (detector) sends deactivation messages to its own neighbors and deactivates itself; two of its neighbors (top and left) react accordingly, but the right neighbor ignores it because it was infected in the meantime. In contrast, during timeslot t + 2, a node deactivates itself after receiving both a deactivation and an infected message. The execution continues until timeslot t + 4 when the network is partitioned and the spread is contained.
(a) Timeslot t − 1 (b) Timeslot t (c) Timeslot t + 1
(d) Timeslot t + 2 (e) Timeslot t + 3 (f) Timeslot t + 4 Figure 2: Example of an execution of the strategy K1-Hop
5.2 Cutting strategies
We propose a family of cutting strategies that differ in the number of links that are cut. For all strategies, the detector cuts the link carrying the infection. It also sends messages to some of its neighbors to ask them to cut some of their links. The set of links to be cut depends on the strategy and are the ones located near the infected node. The main strategies are C0, C1, C2, and Clocand are defined in Table 2.
Table 2: Description of the cutting strategies Name Reaction of detector (node D) after infection (from node I)
C0 Cut the link carrying the infectiona
C1 Ask nodes from S1[I] = N [I] ∩ N [D] to cut all links between them
C2 Ask nodes from S2[I] = N [S1[I]] ∩ N [D] to cut all links between them
Cx Ask nodes from Sx[I] = N [Sx−1[I]] ∩ N [D] to cut links between them
Cloc Ask all local neighborsb of D to cut links between them
aDefining S
0= {I} allow to describe C0 and C1 similarly to CX. bi.e. the neighbors coming from the underlying unit-disk graph
Example To help understanding the (complex) formal definitions, we represent the main strategies in Figure 3. The node I corresponds to the infected node and D to the detector. In C0, the detector cuts only the link between I and D. In C1, the detector sends a message to nodes A, B, G, and H since they are the common neighbors of I and D. In C2, the detector sends additional messages to C and F since they are respectively neighbor of B and G. In all strategies, including Cloc, the detector do not send a message to nodes X, Y, or Z since they
are not close to I.
There are two important notes about these strategies:
• Except C0, other strategies are meaningful only for the unit-disk and small-world topolo-gies. Indeed, in the grid, two adjacent nodes do not share any common neighbor; therefore no additional edge will be cut and all strategies are equivalent to C0
• We consider only cutting strategies where nodes receiving a cutting-request also cuts the link carrying the request. At first glance, this is not a useful property; in Figure 3d, it seems (and it is) not relevant to cut links between D and E or between D and F. However it is necessary to consider only strategies with this restriction since otherwise the infected nodes could also send cutting-requests in order to weaken the network.
sus./sane node, infected node, detector node, infection msg, strategy msg, cut link. D I A B C E F G H X Y Z (a) Strategy C0 D I A B C E F G H X Y Z (b) Strategy C1 D I A B C E F G H X Y Z (c) Strategy C2 D I A B C E F G H X Y Z (d) Strategy Cloc
Figure 3: Representation of the main cutting strategies
5.3 Restriction of containment strategies
Containment strategies weaken the connectivity of a network by sacrificing the node and cutting the communication links. Without any restriction, infected node can exploit to weaken the healthy part of the network. Therefore, all strategies in this study are defined with a restriction that upon receiving a killing/cutting message the receiver must disconnect with the sender by killing itself or cutting its communication link to the sender. By this restriction, the adversary cannot exploit the strategies because it has nothing to gain from this because it only contributes in isolating the infected node from the sane ones. This behavior is equivalent to allow the sane neighbor to detect an attack with probability 1.
6
Analysis of containment strategies for the torus
We study first the simplest killing strategy K0-Hop and then compare the performance of other strategies.
6.1 Strategy K0-Hop
The main results about K0-Hop are summarized on Figure 4. Both pictures represent the number of sane nodes at the end of the propagation.
Existence of a phase transition Figure 4a shows the evolution of the number of sane nodes in the 100 × 100 torus when the probabilities p and q of infection and detection vary.1 The lighter the color is, the more sane nodes remain at the end of the simulation. As one could expect, the number of sane nodes increases when the probability of detection increases, and it decreases when the probability of infection increases.
Less expectedly, there are two clearly delimited regions; (1) the yellow region where almost all nodes are sane (i.e. very few infected or killed nodes) and (2) the black one where very few nodes are sane (i.e. mostly infected or killed nodes). The clear border indicates the existence of a phase transition. This border between the two regions consists in a line passing through the origin; it means that the transition occurs at a fixed ratio pq. Let ρ0 be this ratio. In order to
analyze more precisely this phase transition, we study the case when q = p − 1 (corresponding to the hypotenuse of the triangle where the transition is larger).
1
(a) Torus 100 × 100 (b) Different torus size (with q = 1 − p) Figure 4: Strategy K0-Hop – Number of sane nodes
Effect of the size of the torus on the phase transition Figure 4b shows the evolution of the number of sane nodes for different sizes of toruses when the probability of infection vary. For all sizes of the system, the transition between a sane network to an infected network occurs at the same probability of infection, that is between 0.5 and 0.6. We conclude that the size of the torus has very little effect on the phase transition.
Relation to the percolation theory The value of the critical probability is not surprising since it corresponds to the site percolation threshold of the square lattice (grid). Indeed, there is an intuitive mapping from our strategy K0-Hop to the percolation theory. In our model, when q = 1 − p, p corresponds to the probability that a node with at least one infected neighbor becomes infected while 1 − p corresponds to the probability that this same node sacrifices itself. Using percolation terminology, this means that the node has probability p of being open and 1 − p of being closed. Percolation theory analyzes the probability that there exists a “large” connected component of open nodes which, in our model, corresponds to a large connected component of infected nodes.
Therefore, it is consistent that the phase transition occurs just below p = 0.6 since the site percolation threshold for the grid has been experimentally calculated to be θ ' 0.593. As mentioned in the introduction, the same behavior appears in probabilistic flooding protocol where a node decides to forward a message with a fixed probability.
Conclusion 1 For the strategy K0-Hop (and it remains true for other strategies), the efficiency depends mostly on the ratio pq. The exact values of probabilities p and q are not relevant. Conclusion 2 The strategy K0-hop can contain efficiently the propagation of a virus in a square torus provided that the probability of successful infection is less than the percolation threshold ρ0' 0.59. This threshold does not depend on the size of the network.
6.2 Other killing strategies
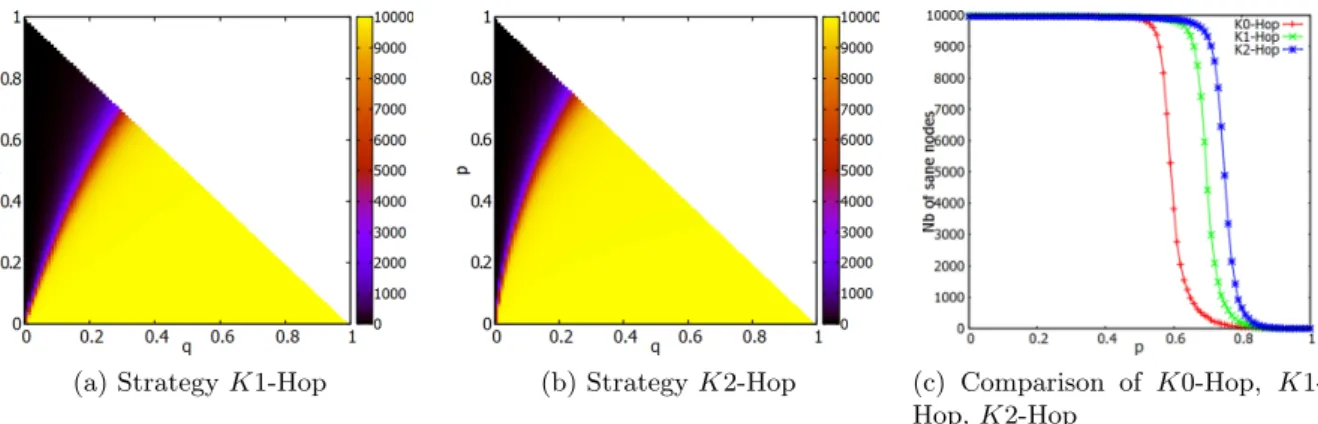
Figure 5a and 5b show the evolution of the number of sane nodes in the 100 × 100 torus for K1-Hop and K2-Hop when the probabilities of infection and detection vary. As for K0-Hop, we observe a phase transition which roughly occurs at a fixed ratio pq. Let ρ1 and ρ2 be these
(a) Strategy K1-Hop (b) Strategy K2-Hop (c) Comparison of K0-Hop, K1-Hop, K2-Hop
Figure 5: Number of sane nodes in the 100 × 100 torus
Shift of the phase transition Compared to K0-Hop, the surface of the yellow region (few infected nodes) increases with K1-Hop and K2-Hop. Said differently; ratios are ordered such that ρ0 < ρ1 < ρ2. It means that killing more nodes mitigate more efficiently the spread when
the probability of infection increases.
Figure 5c shows the comparison of K0-Hop, K1-Hop, and K2-Hop in the 100 × 100 torus when q = 1 − p. It confirms the previous observation: there is clearly a phase transition for each strategy, but they do not occur at the same probabilities. Sacrificing more nodes results in a shift of the critical probability of the phase transition to around 0.7 for K1-Hop and 0.75 for K2-Hop, when compared to 0.59 for the strategy K0-Hop.
Conclusion 3 All killing strategies can contain the propagation of a virus in a square torus provided that the probability of successful infection is less than a certain threshold.These thresh-olds increase with the number of killed nodes. However killing many nodes is not always the best strategy; when the probability of propagation is low, killing many nodes is counterproductive, especially for a small torus since there remain few sane nodes.
6.3 Cutting strategy C0
Figure 6: Comparison of K0-Hop, C0 – Size of the LCC of sane nodes
To analyze the efficiency of cutting strategies, we need to introduce a new metric. Counting the number of sane nodes is not relevant. Indeed the trivial strategy “cut-all-links” would be optimal under this metric since all nodes would be immediately isolated (and sane). Obviously
this strategy should not be considered as efficient. Therefore, instead of counting the number of sane nodes, we measure the size of the Largest Connected Component (LCC) of sane nodes. Figure 6 shows the evolution of the size of this largest component for strategies K0-Hop and C0. Similarly to killing strategies, we observe a threshold after which the cutting strategy C0 does not contain the propagation anymore. The transition occurs when the probability of infection is around 0.5. Again it is possible to relate this value with results from the percolation theory; it corresponds exactly to the bond percolation threshold of the square lattice.2
Globally, the strategy C0 is less efficient than K0-Hop (and implicitly K1-Hop and K2-Hop) since its threshold is lower. But for some very specific cases, the cutting strategy performs slightly better. When the probability of infection p is very low, there is a small advantage to use C0 instead of K0-Hop. In these situations, C0 avoids killing the nodes that detects the infection. However since the probability of detection is high, the propagation stops quickly and therefore the number of spared nodes is quite small.
Conclusion 4 The cutting strategy C0 can contain the propagation in the square torus, but is less efficient than any killing strategy. There is only a small advantage to use C0 when the probability of infection is very low.
7
Analysis of containment strategies for the unit-disk graphs
Contrary to the torus, the unit-disk graphs are randomly generated. We choose the parameters in order to guarantee the connectivity of the network with high probability. Under this con-straint, we generate random graphs with average degree of 8 or 10. Since results are the same in both cases, we present the figures only for the average degree of 10.
(a) Killing strategies and Cloc (b) Cx and Cloc
Figure 7: Comparison of all strategies in the unit disk graph GU DG(10000, 10)
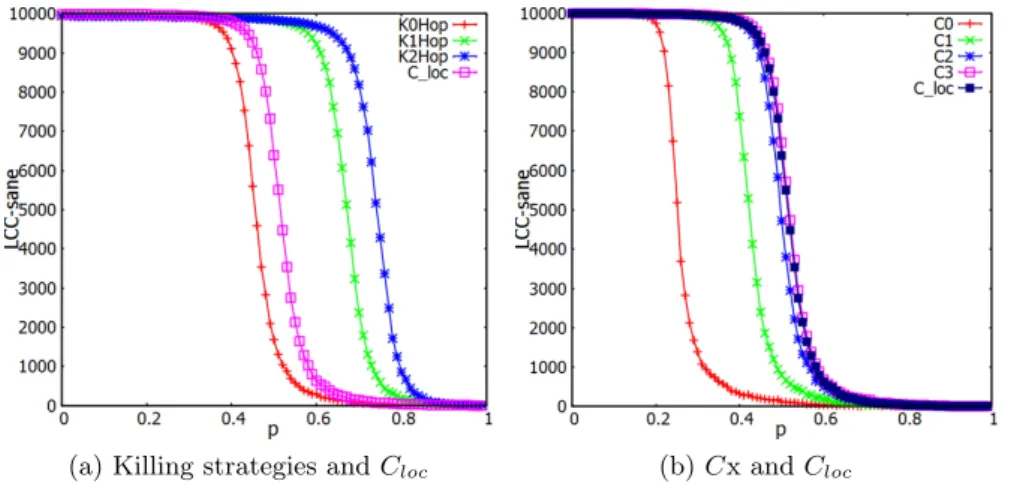
Killing strategies Figure 7a summarizes the simulations of killing strategies in the unit-disk graph GU DG(10000, 10). We observe results that are similar to the ones obtained for the torus.
Each strategy can contain the propagation until a certain probability of infection. There exists also a clear phase transition and a threshold after which a given strategy becomes inefficient. As for the square torus, the values of these thresholds are higher for strategies that kill more nodes.
2In bond percolation, each edge has a probability of being open or closed. Contrarily to the site percolation
(a) K0-Hop in Small-world (b) K1-Hop in Small-world (c) K2-Hop in Small-world Figure 8: The difference of killing strategies between Unit-disk graph and Small-world graph Cutting strategies Figure 7a summarizes the simulations of cutting strategies in the unit-disk graph GU DG(10000, 10). C0 and C1 give the worse performances than K0-Hop. Other
analyzed cutting strategies give similar performances. They are better than K0-Hop but worse than K1-Hop. As for the torus, there is no benefit here to use cutting strategies instead of killing strategies; they globally perform less efficiently.
Conclusion 5 The results for the unit disk graphs are similar to those obtained for the square torus. More generally, we can expect that it will be the same for all locality-based topologies.
8
Analysis of containment strategies for the small-world
net-works
8.1 Simulation parameters
We study the effects of different strategies on the Small-world graph defined in Section 4 to see how the long-links change the strength of the propagation and the strategies to isolate propaga-tion. Based on the existing unit-disk graphs, we vary the number of long edges for each node. The generated small-world graphs are SW (10000, 8, `), ` = 1..6, 8 and SW (10000, 10, `), ` = 1..5, 10.
The long links reduce the average diameter of network from 80 in GU DG(10000, 10) to 7
in SW (10000, 10, 1). Moreover, ` long edges added for each node of initial unit-disk graph increases 2` the average degree of network.
8.2 Informal explanation about the lack of efficient strategy
The figures 8a, 8b, 8c show the simulation results of K0-Hop, K1-Hop and K2-Hop respectively in unit-disk graph GU DG(10000, 10) and different small-world graphs SW (10000, 10, `), where
` = 1..5. When long edges are added into unit-disk graph, the phase transitions of Killing strategies K0-Hop, K1-Hop, K2-Hop are significantly shifted to the left. We also make the simulation for SW (10000, 8`), where ` = 1..6, 8, the result is similar to figures above.
For a large small-world network, the random long edges added to the unit-disk graph are likely to connect pairs of nodes that are far from each other in the initial graph. Therefore, for any node, its local neighbors (from the unit-disk graph) are likely to be far from its long neighbors (from random links). Consequently, even if some local neighbors detect the infected node, they have no mean to alert the long neighbors.
(a) Cx, Clocin SW (10000, 10, 1) (b) Cx, Cloc in SW (10000, 10, 3)
(c) K-strategies and Cloc in
SW (10000, 10, 1)
(d) K-strategies and Cloc in
SW (10000, 10, 3)
Figure 9: The comparison between K0-Hop, K1-Hop, Kloc and Clocin Small-world graph
Let us consider an infinite small-world built on top of a infinite unit-disk graph where ` random links are added for each node. In average, each node has 2` long links since added links are bidirectional. Starting from the initial infected node, there are in average 2p` nodes that are infected via these random links. If 2p` > 1, in average there are more and more “independent” nodes newly infected. Therefore it is impossible to contain the propagation, with any strategy, when p > 1/2`.
Refining the analysis by considering also the random links of the local neighbors of the infected node, we obtain the inequality 2p` + 2p2`∆ > 1 from which we can deduce that there exists no efficient strategy when p >
√
1+2∆/`−1 2∆ .
For ∆ = 10, this informal estimated threshold equals 0.18, 0.12, and 0.09 for ` = 1, 2, and 3 respectively. This analysis explains the difference of killing strategies in small-world.
Conclusion 6 Contrary to the unit-disk graph and torus, when the infection probability greater than 0.18, no killing strategy introduced in section refsec:node-sacrifice-definition can contain the infection.
8.3 Cutting local-edges is more effective than killing strategies
On the other point of view, because of the small average diameter of small-world graph, the number of killed nodes in each round is a big fraction of the total number of nodes in network. When the infection probability is small, for every attack, a node has higher chance to detect than to be infected. Another question arisen: is it interesting to save some neighbors of detector from deactivation.
Besides the cutting strategies introduced in section 5.2, strategy Klocusing 2-hop
neighbor-hood information to kill all local neighbors and keep long-edge neighbors alive is considered. With 2-hop neighborhood information, each node knows all neighbors of its 1-hop neighbors.
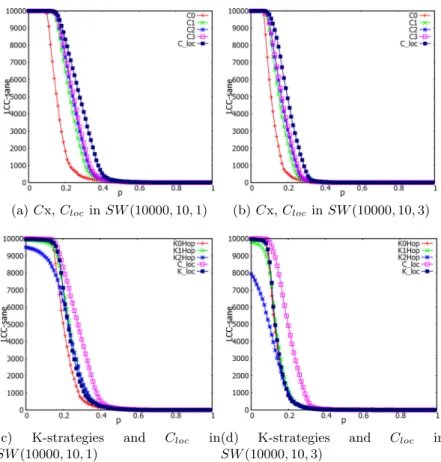
Figures 9a and 9b show the simulation results of cutting strategies in two small-world graphs SW (10000, 10, 1) and SW (10000, 10, 3) respectively. We can see that the curve of Clocis always
the last in the right side and the least sloping when compared with other cutting strategies. Figures 9c and 9d show the comparison between killing strategies K0-Hop, K1-Hop, K2-Hop, Klocand Clocsmall-world graphs SW (10000, 10, 1) and SW (10000, 10, 3) respectively. We
can see that, in both graphs, Clochas less sloping curve than the other strategies and its curve
also in the right side of other curves. The difference between Cloc and killing strategies in
SW (10000, 10, 3) is more significant than in SW (10000, 10, 1). While Kloc does not bring any
benefit than other killing strategies. It means that in small-world:
• All local edges should be cut to have the most effective performance in mitigating the propagation among the cutting strategies.
• The cutting strategy Clocsignificantly improves LCC−sane of the network. Consequently, keeping the detectors and the long-edges that connects detectors with other components except the one having infected nodes help to slowdown the phase transition.
• If there are more long edges on the top of initial unit-disk graph, the improvement of cutting strategy Cloc is more significant.
Conclusion 7 When the infection probability is small, cutting all local edges, keeping detector and all long edges from detector active (except infection edges) by using 2-hop neighborhood information helps the small-world graph to improve the performance on LCC−sane especially when the number of long-edges is large.
9
Conclusion
We have studied the propagation of a virus in three kinds of graphs (torus, unit disk, small-world) and how local strategies can help contain this propagation.
After verifying the existence of a threshold and a phase transition for all strategies, we observe that the choice of a strategy introduces a shift of that threshold.
In particular, for the two locality-based topologies, we confirm the intuition that sacrificing a larger number of nodes helps with containing the propagation, which is achieved even for higher infection rates (or lower detection probabilities).
Surprisingly, we find that strategies based on cutting communication links are not necessarily better since, although they may save more nodes (e.g. by not killing the detectors), it has no global effect as soon as the probability of infection is not very small since the saved nodes can be infected from other neighbors.
We find that using some mitigation strategy is somewhat effective in the case of the torus and the unit disk graph. The choice of strategy is important and killing strategies are significantly more effective in these two kinds of graphs.
This is not so in small-world graphs. The fact that small-world graphs have a very small diameter clearly plays against them, and little can be done to contain the propagation. Con-tainment can be achieved only for a small infection probability. In that case, killing strategies are in fact particularly harmful, and only strategies using some additional topology information about neighbors seem to provide any help, albeit a small one.
When put into the context of virus propagation, this means that propagation containment strategies must be thought as a last line of defense when the detection may possibly fail to detect the attack.
References
[1] Anderson, R.M., May, R.M.: Population biology of infectious diseases: Part i. Nature 280(5721), 361–367 (Aug 1979)
[2] Bollob´as, B., Riordan, O.: Percolation. Cambridge University Press (2006)
[3] Brumley, D., Newsome, J., Song, D., Wang, H., Jha, S.: Towards automatic generation of vulnerability-based signatures. In: Proceedings of the 27th IEEE Symposium on Security and Privacy (S&P’06). pp. 2–16 (May 2006)
[4] Chakrabarti, D., Wang, Y., Wang, C., Leskovec, J., Faloutsos, C.: Epidemic thresholds in real networks. ACM Transactions on Information and System Security 10(4) (2008) [5] Chen, Z., Gao, L., Kwiat, K.A.: Modeling the spread of active worms. In: Proceedings of
the 22nd Annual Joint Conference of the IEEE Computer and Communications Societies (INFOCOM’03). vol. 3, pp. 1890–1900 (Mar 2003)
[6] Falliere, N.: Sality: Story of a peer-to-peer viral network. http://www.symantec.com/ connect/sites/default/files/sality_peer_to_peer_viral_network.pdf (Jul 2011) [7] Fogarty, P.: Catching the fire on grids. Master’s thesis, Department of Mathematics,
Uni-versity of Vermont (2003)
[8] Grassberger, P.: On the critical behavior of the general epidemic process and dynamical percolation. Mathematical Biosciences 63(2), 157–172 (Apr 1983)
[9] Hartnell, B.: Firefighter! an application of domination, presentation. In: 20th Conference on Numerical Mathematics and Computing (1995)
[10] Hu, R., J., S., Arantes, L., Sens, P., Demeure, I.: Fair comparison of gossip algorithms over large-scale random topologies. In: Proceedings of the 31st IEEE Intl. Symp. on Reliable Distributed Systems (SRDS’12). pp. 331–340 (Oct 2012)
[11] Kephart, J.O., White, S.R.: Directed-graph epidemiological models of computer viruses. In: Proceedings of the 12th IEEE Symposium on Security and Privacy (S&P’91). pp. 343–361 (1991)
[12] Kephart, J.O., White, S.R.: Measuring and modeling computer virus prevalence. In: Pro-ceedings of the 14th IEEE Symposium on Security and Privacy (S&P’93). pp. 2–15 (1993) [13] Kermack, W.O., McKendrick, A.G.: A Contribution to the Mathematical Theory of Epi-demics. Proceedings of the Royal Society of London. Series A 115(772), 700–721 (Aug 1927)
[14] Kruegel, C., Kirda, E., Mutz, D., Robertson, W., Vigna, G.: Polymorphic worm detec-tion using structural informadetec-tion of executables. In: Proceedings of the 8th Internadetec-tional Conference on Recent Advances in Intrusion Detection (RAID’05). pp. 207–226. Springer-Verlag, Berlin, Heidelberg (Sep 2006)
[15] Lee, M.J.: Pseudo-random-number generators and the square site percolation threshold. Physical Review E 78(3), 031131–1–11 (2008)
[16] Li, Z., Sanghi, M., Chen, Y., Kao, M.Y., Chavez, B.: Hamsa: fast signature generation for zero-day polymorphic worms with provable attack resilience. In: Proceedings of the 27th IEEE Symposium on Security and Privacy (S&P’06). pp. 32–47 (May 2006)
[17] May, R.M., Anderson, R.M.: Population biology of infectious diseases: Part ii. Nature 280(5722), 455–461 (Aug 1979)
[18] Messinger, M.E.: Average firefighting on infinite grids. Australian journal of Combinatorics 41, 15–28 (2008)
[19] Moore, D., Shannon, C., Voelker, G., Savage, S.: Internet quarantine: requirements for containing self-propagating code. In: Proceedings of the 22nd Annual Joint Conference of the IEEE Computer and Communications Societies (INFOCOM’03). vol. 3, pp. 1901–1910 (Mar 2003)
[20] Pastor-Satorras, R., Vespignani, A.: Epidemic dynamics and endemic states in complex networks. Physical Review E 63(6), 066117–1–8 (2001)
[21] Pastor-Satorras, R., Vespignani, A.: Epidemic spreading in scale-free networks. Physical Review Letters 86, 3200–3203 (Apr 2001)
[22] Sasson, Y., Cavin, D., Schiper, A.: Probabilistic broadcast for flooding in wireless mobile ad hoc networks. In: Proceedings of the IEEE Wireless Communications and Networking (WCNC’03). pp. 1124–1130 (2003)
[23] Staniford, S., Paxson, V., Weaver, N.: How to own the internet in your spare time. In: Proceedings of the 11th USENIX Security Symposium (USENIX-Security’02). pp. 149–167. USENIX Association, Berkeley, CA, USA (Aug 2002)
[24] Van Mieghem, P.: The N -intertwined SIS epidemic network model. Computing 93(2-4), 147–169 (Dec 2011)
[25] Van Mieghem, P., Omic, J., Kooij, R.E.: Virus spread in networks. IEEE/ACM Transac-tions on Networking 17(1), 1–14 (2009)
[26] Wang, Y., Chakrabarti, D., Wang, C., Faloutsos, C.: Epidemic spreading in real networks: An eigenvalue viewpoint. In: Proceedings of the 22nd Symposium on Reliable Distributed Systems (SRDS’03). pp. 25–34 (2003)
[27] Xia, J., Vangala, S., Wu, J., Gao, L., Kwiat, K.: Effective worm detection for various scan techniques. Journal of Computer Security 14(4), 359–387 (Jul 2006)
[28] Xu, W., Zhang, F., Zhu, S.: Toward worm detection in online social networks. In: Pro-ceedings of the 26th Annual Computer Security Applications Conference (ACSAC’10) (Dec 2010)
[29] Zhou, L., Zhang, L., McSherry, F., Immorlica, N., Costa, M., Chien, S.: A first look at peer-to-peer worms: Threats and defenses. In: Proceedings of the 4th International Conference on Peer-to-Peer Systems (IPTPS’05). pp. 24–35. Springer-Verlag, Berlin, Heidelberg (2005) [30] Zou, C.C., Gong, W., Towsley, D.: Code red worm propagation modeling and analysis. In: Proceedings of the 9th ACM Conference on Computer and Communications Security (CCS’02). pp. 138–147. ACM, New York, NY, USA (2002)
[31] Zou, C.C., Towsley, D., Gong, W.: Modeling and simulation study of the propagation and defense of internet e-mail worms. IEEE Transactions on Dependable and Secure Computing 4(2), 105–118 (Apr 2007)