近畿大学学術情報リポジトリ
95
0
0
全文
(2) (~)(~§). Analysis of the Regulatory System for the Biosynthesis of Ascorbate in Higher Plants Takahiro Mieda March, 2006 Graduate School, Kinki University Division of Agricultural Science Major: Applied Bioscience (Adviser: Prof. Shigeru Shigeoka). ~~f@~t::S ~t.Q '7 A:J)V t: /M~~JJX:*O) ~W~ff4O)m~. J1I~*~*~~. .~liJf~f~. ~}fj ~1ftt{t~w:~. tt. (t~~. :. I¥ij¥$ m/ti1] JJX: ~~). Submitted to the Graduate School, Kinki University, to fulfill the requirement for the Doctorate Degree..
(3) ACKNOWLEDGEMENTS. I wish to express my science graduate to Dr. Shigeru Shigeoka, Professor of Faculty of Agriculture, Kinki University, for his kind guidance, valuable advice, stimulation discussion, and critical review thought the work including the manuscript of this thesis. Thanks are due to Dr. Ryutaro Utsumi and Dr. Tamo Fukamizo, Professor of Faculty of Agriculture, Kinki University, for reading the entire text in its original form. I am thankful to Dr. Yukinori Yabuta and Dr. Rapolu Madhusudhan, Faculty of Agriculture, Kinki University, Dr. Kazuya Yoshimura Graduate School of Biological Science, Nara Institute of Science and Technology, Dr. Takahiro Ishikawa, Faculty of Life and Environmental Science, Shimane University, for their valuable help, kind suggestion, and stimulating discussion throughout the work. I wish to thank Dr. Toru Takeda and Dr. Masahiro Tamoi, Faculty of Agriculture, Kinki University, for their valuable helps and valuable discussions throughout the work. Finally, special thanks are due to Ryouji Fukui, Takashi Motoki,. and. collaboration.. Ayana. Nakamura,. for. their. many. helpful. Thanks are also due to all the past and resent. members of the laboratory of Plant Molecular Physiology in the Faculty of Agriculture, Kinki University, cooperations.. for their kind.
(4) ABBREVATIONS. AOX. ascorbate oxidase. APX. ascorbate peroxidase. AsA. reduced L-ascorbate acid. cAPX. cytosolic ascorbate peroxidase. chlAPXs. chloroprastic ascorbate peroxidase isoenzymes. mAPX. microbody membrane-bound ascorbate peroxidase. sAPX. stromal ascorbate peroxidase. tAPX. thylakoid membrane-bound ascorbate peroxidase. BSA. bovine serum albumin. CAT. catalase. CaMV. cauliflower mosaic virus. Cyt c. cytochrome c. DCMU. 3-(3,4-dichlorophenyl)-1,1-dimethylurea. DHA. dehydroascorbate acid. DHAR. dehydroadcorbate reductase. D-GalUA. D-galacturonic acid. D-Glu. D-glucose. D-Man. D-mannose. DTT. dithiothreitol. Fru. fructose. Glu. glucose. GME. GDP-D-mannose pyrophosphorylase. GMP. GDP-D-mannose-3,5-epimerase. GR. glutathione reductase. GSH. reduced glutathione. GSSG. oxidized glutation. GST. glutathione S-transferase. GULO. L-gulono-l,4-lactone oxidase. H2 0 2. hydrogen peroxide. IPTG. isopropyl-8-D-thiogalactopyranoside. LB. Luria-Bertani broth.
(5) L-Gal. L-galactose. L-GaIDH. L-galactose dehydrogenase. L-GaIL. L-galactono-l,4-lactone. L-GaILDH. L-galactono-l,4-lactone dehydrogenase. L-Gul. L-gulose. L-GuIL. L-gulono-l,4-lactone. L-Man. L-mannose. MDAR. monodehydroacorbate reductase. MDHA. monodehydroascorbate. MI. myo-inositol. MIO. myo-inositol oxidase. MV. methylviologen. NEM. N-ethylmaleimide. 102. singlet oxygen. O2 -. superoxide. 3. 02. triplet dioxygen. OW. hydroxyl radical. PAGE. polyacrylamide gel electrophoresis. PCD. programmed cell death. PSII. photosystem II quantum yield. PVDF. polyvinylidene dufkyirude. RACE. rapid amplification of cDNA ends. RT-PCR. reverse transcription-PCR. SOD. supreoxide dismutase. Suc. sucrose.
(6) CONTENS CAPTER I. Introduction. CAPTER II. Decline in leaf photooxidative-stress tolerance with age in tobacco. CAOTER III. 24. Effect of photosynthesis on ascorbate synthesis in leaves. CAPTER VI. 9. MolecularcharacterizationofspinachL-galactose dehydrogenase. CAPTER IV. 1. 45. Investigation enzymes involved in ascorbate biosynthesis using overexpression and antisense suppression in Arabidopsis. 61. REFERENCE. 71. PUBLICATIONS. 89.
(7) CHAPTER I. Introduction. Production of active oxygen species Molecular oxygen (0 2 ) is necessity for aerobic organisms, including plants.. However, free radicals and other active. derivative of oxygen are inevitable by-products of biological redox reactions. superoxide. Reduced active oxygen species (AOS), such as. radical. (0 2- ) ,. singlet. oxygen. e02)'. hydrogen. peroxide (H 2 0 2 ) , and hydroxyl radical (OH·), are generally considered to be detrimental to cellular function.. AOS are. formed in normal cell metabolism and their production and destruction are a regulated cellular phenomenon (Bowler et ale , 1992; Chen et al., 1993; Asada 1994; Levine et al., 1994; Prasad et al.,. 1994).. The chloroplasts are potentially the most. powerful source of oxidants Harbinson,. 1993).. The. in plant tissues. (Foyer and. photosynthetic electron transport. system is the major source of active oxygen species in plant tissues (Asada, 1994), having the potential to generate 102 and O2 - ,. In addition, large amounts of H2 0 2 are produced during the. oxidation of the glycollate in the peroxisome.. Furthermore,. the oxidative damage is also caused by various types of environmental stress, such as high light, drought and chilling temperature, some L:lemicals, including Methylviologen (MV) and norflurazon, and air pollutants, such as ozone, can give rise to excess concentrations of AOS, resulting in the oxidative damage at the cellular level.. The antioxidants and antioxidant network in higher plants Environmental stress conditions are the major limiting factor in plant productivity.. In chloroplasts of higher plants,. the removal of AOS is critical, since 10 pM H20 2 inhibits the 1.
(8) thiol-modulated enzymes, such as fructose-1, 6-bisphosphatase, NADPH-glyceraldehyde-3-phosphate ribulose-5-phosphate. kinase. in. the. dehydroge-nase. and. photosynthetic. carbon. reduction cycle and then photosynthetic assimilation of CO 2 by 50%, (Kaiser, 1976; Takeda et al., 1995), moreover,H 20 2 and O2are also involved in lignin formation in the cell walls (Lewis and Yamamoto, 1990), and are associated with leaf senescence (Thompson et al., 1987).. The AOS are highly reactive compared. with triplet dioxygen (3 02 ) at the ground state, their redox potentials being higher than 3 02 . Among them, OH is the most reactive causing oxidative damage to chloroplast components. °. No specific scavenging enzyme is available for OH. O. since its. reaction with cellular. components proceed at diffusioncontrolled rates (10 8 _10 9 M- 1 S-1), and its diffusion distance from the generation site is shorter than several amino acid residues in the case of proteins.. The production of O2 - was shown. to activate programmed cell death (PCD) in Arabidopsis (Jabs et al., 1996), and H20 2 was shown to induce PCD and defense mechanisms in bean and tobacco (Levine et al., 1994, 1996; Draper,. 1997; Shirasu et al.,. efficient. scavenging. 1997).. system for. Plants possess very. AOS,. a. highly efficient. antioxidative defence system, composed of both non-enzymic and enzymic constituents, which is present in all plant cells.. ( 1). L-Ascorbate acid (AsA) plays a pivotal role in the destruction of AOS, particularly H20 2. ( 2) Carotenoids quench 102 and also protect photosynthetic organs by absorbing excess excitation energy from chlorophyll by direct transfer.. (3) Glutathione. (GSH) acts as a disulphide reductant to protect thiols on enzymes, regenerate ascorbate, and react with 102 and OH ° The enzymic antioxidant components are a prerequisite for life in oxygen.. (4). Superoxide. dismutase. (SOD),. the. family. of. metalloenzymes that catalyse the disproportionation of O2- to molecular oxygen and H2 0 2 , (Bowler et ale , 1992; Scandalios 1993) . 2.
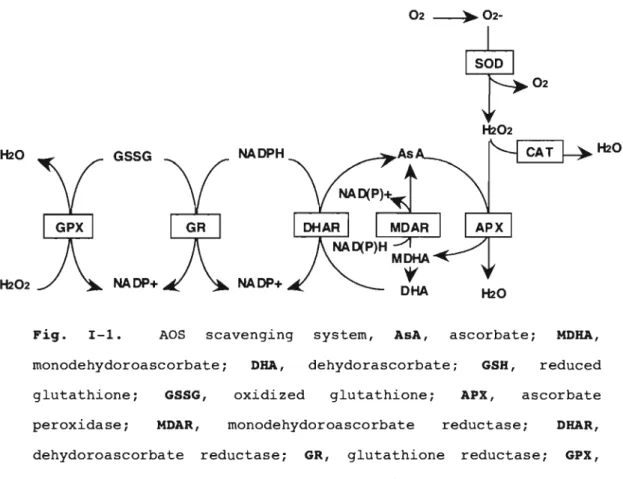
(9) SOD removes O2- and thence decrease the risk of OH· formation from O2 - via the metal-catalysed Haber-weiss-type reactions. Such OH· is a strong oxidizing agent that can initiate lipid peroxidation and also attack DNA, molecules. exists. as. ( 5). proteins and many small. Ascorbate peroxidase. isoenzymes. and plays. EC. 1. 11. 1. 11 ). an important role. metabolism of H20 2 in higher plants. eukaryotic algae.. (APX;. in the. APX is also found in. APX utilizes AsA as its specific electron. donor to reduce H2 0 2 to water with the concomitant generation of monodehydroascorbate (MDHA), a univalent oxidant of AsA (Fig. I-I) .. MDHA is spontaneously disproportionated to AsA and. dehydroascorbate (DHA). by. the. action of. MDHA is also directly reduced to AsA. NAD (P ) H-dependent MDHA reductase.. DHA. reductase utilizes GSH to reduce DHA and thereby regenerate AsA. The oxidized GSH is then regenerated by GSH reductase (GR), utilizing reducing equivalents from NAD(P)H.. Thus, APX in. combination with the accumulation of toxic levels of H2 0 2 in photosynthetic. organisms. (Asada,. 1992,. 1997).. In. the. chloroplasts of higher plants, in addition to the AsA-GSH cycle located in the stroma the water-water cycle, which is the photoreduction of oxygen to water in PSI by the electrons derived from water in PSII, participates in the detoxification of AOS and the dissipation of the energy of excess photons (Asada, 1999).. 3.
(10) H2O. GSSG. NADPH. H202. NADP+. NADP+. Fig.. AOS. 1-1.. scavenging. monodehydoroascorbate; glutathione; peroxidase;. GSSG, MDAR,. dehydoroascorbate. H2O. system,. AsA,. ascorbate;. ORA,. dehydorascorbate;. oxidized. glutathione;. monodehydoroascorbate reductase;. GR,. GSH, APX,. MORA, reduced. ascorbate. reductase;. glutathione. ORAR,. reductase;. GPX,. glutathione peroxidase; SOD, superoxide dismutase; CAT, catalase. AsA biosynthesis and regulation. AsA is an abundant metabolite and plays important roles in growth and development, as well as in protection from biotic and abiotic oxidative stresses, in animals and plants.. The. biosynthetic pathways of AsA differ between plants and animals; humans have lost the ability to synthesize it. In animals, AsA is synthesized in the liver or kidney by conversion of o-glucose (o-Glu) as part of the hexuronic acid pathway (Nishikimi and Yagi, 1996; Banhegyi et al., During II. the. course. of. these. transformations,. an. 1997).. apparent. inversion" of configuration occurs so that radiolabel from the. C1 of o-Glu is incorporated into the C6 of AsA (Loewus, 1980). AsA biosynthesis in animals therefore involves the conversion of derivatives of o-Glu by an inversion-type pathway.. 4.
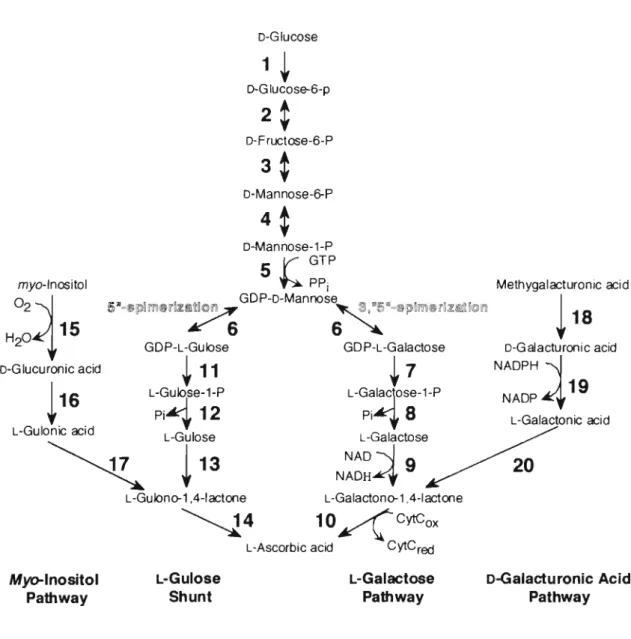
(11) D-Glucose. 1. +. D-G lucose-6-p. 2. ~. D-F ructose-6-P. 3. ~. D-Mannose -~P. 4. ~. D-Mannose-1-P 5 GTP. V-. ~PPi. myo-Inositol. 02~. H204::"~ 15. GDP-L-Gulose. •. !. GDP-L-Galactose. +11. D-Glucuronic acid 1. Methygalacturonic acid. GDP-D-Mannose !511-\!liPl~Ii"JIl~~!i£ /s ~ .-. 16. L-GU~~. +7. Pi'"'1 12. LT;;. NADP. ~. 4 19. L-Galactonic acid. L-Galactono-1 ,4-lactone. ~4. 10 ~cytCox. L-Ascorbic acid. Fig. I-2.. NADPH. N~~~~~,e~. L-Gulono-1 A-lactone. L-Gulose Shunt. Myo-Inositol Pathway. D-G alacturonic acid. L-Gal~CjOSe-1-P PI'" 8. L-Gulose-1-P. 18. cytCred. L-Galactose Pathway. D-Galacturonic Acid Pathway. AsA biosynthet i c pathways in p lants.. Strong evidence. exists for the L-galactose AsA biosynthetic pathway in plants in which D-Glu is converted to AsA via GDP-D-Mannose and L-Galactose. Evidence has been present f o r a branchpoint after GDP-D-Mannose (6) , the L-Gulose shunt.. The g al acturonic acid pathway was identified. after the indetification o f galac turonic acid reductase cDNA in strawberry. fruit. Arabidopsis. 2.7.1.1),. 2.. (19).. Reactions. More are. phosphoglucose. recently, catalyzed. myo-inosi tol by. isomerase. 1. oxygenase. hexok ina se. (E. C.. (E.C.. phosphomannose isomerase ( E.C. 5.3.1.8), 4. phosphomannose (E.C. 5.4.2.8),. GDP-D-mannose-pyrophosphorylase. GDP-D-mannose-3,5-epimerase. (E. C.. 5. (E.C.. 5.1.3.18),. 7.. 2.7.7.22),. 6.. GDP-L-galactose.
(12) pyrophosphatase, dehydrogenase, 1.3.2.3),. 11.. 8.. 10.. L-galactose-1-phosphatase,. 9.. L-galactose-. L-galactono-1,4-lactone dehydrogenase. GDP-L-gulose. pyrophosphatase,. 12.. (E.C.. L-gulose-1-. phosphatase, 13. L-gulose dehydrogenas, 14. L-gulono-1,4-lactone. dehydrogenase,. 15.. myo-inositol oxidase. (E.C.. 1.13.99.1),. 16.. glucuronic acid reductase (E. C. 1. 1 . 1 . 19), 17. aldonolactonase (EC. 3.1.1.18),. 18.. (pettin). methylestarase. (E.C.. 3.1.1.11),. 19.. galacturonic acid reducatase (E. C. 1.1.1.203), 20. aldonolactonase (E. C. 3.1.1.18). Enzymes in italics have not been demonstrated in. plants and where no E.C. number is quoted it is yet to be assigned.. In plants, several ASA-biosynthetic pathways have been proposed (Fig. I-2).. Early experiments showed that in detached. strawberry fruit, asymmetrically labeled o-Glu was converted to AsA over a pathway without inversion of the carbon chain (Loewus et al., 1956).. It was also know that L-galactono-. 1,4-lactone (L-GaIL) was a precursor of AsA in cress (Lepidium sativum) seedlings. (1) In 1998, Smirnof proposed a biosynthetic pathway for AsA in plant that combined the two fact: the non inversion of the carbon skeleton and the occurrence of L-GaIL as the immediate precursor of AsA (Wheeler et al., 1998).. Since then, molecular. and genetic evidence demonstrating the function of this pathway in photosynthetic tissues has been reported (Conklin et al., 1999 j. Gatzek et al.,. 2002).. This. pathway involves the. conversion GDP-mannose to GDP-L-galactose catalysed by a GDP-o-Man-3,5-epimerase. E.C.2.7.7.22 Wolucka et al.,. (GMPj. 2001) and L-galactose released from the nucleotide is the immediate. precursor. of. L-GaIL,. which. by. action. of. a. dehydrogenase is converted to AsA. (2) Despite the. fact. that plants. and animals. synthesize. ascorbic acid via different pathway, transgenic tobacco and lettuce plants expressing a rat cDNA encoding L-gulono-1,4-. 6.
(13) lactone. oxidase. (GULO;. E.C.1.1.3.8). accumulated. seven-fold more AsA than untransformed plants. demonstrate. that. basal. level. of. AsA. in. up. to. These results plants. can. be. significantly increased by expressing a single gene from the animal. pathway. (Jain. and. Nessler,. 2000).. Also. the. AsA. deficiency of the Arabidopsis vtcl mutant with a known lesion in GMP. (Conklin et. al.,. 1999). could be. complemented. by. heterologous expression of the rat GULO (Radzio et al., 2003). Considering the reduced GMP activity of the vtcl mutant, the authors speculated that there must be a route for the biogenesis of L-gulono-1,4-lactone (L-GuIL) in plants which bypass this enzyme. (3) One potential source of L-GuIL is D-glucuronate formed from myo-inositol. (MI),. via MI-oxidase. (MIO;. E.C.1.13.99.1),. a. poorly characterized enzyme in plants (Koller et al., 1976). Evidence to support such a biogenesis was provided after identification of a putative MIO in Arabidopsis by comparison with the gene sequence from pig kidney. Arabidopsis gene. Confirmation of the. identity was obtained after heterologous. expression in bacteria and the generation of Arabidopsis plants in which expression of the endogenous MIO was placed under control of the constitutive cauliflower mosaic virus (CaMV) 35s promoter, resulting in a 3-fold enhancement of AsA content compared to plants transformed with a empty vector (Lorence et al., 2004).. There was a clear correlation between AsA content. and MIO transcript in the transformants. (4) Methyl. galacturonate. is. an. efficient. AsA. precursor. (Isherwood et al., 1954; Loewus and Kelly, 1961; Davey et al., 1999). chain. Radiolabelling experiments also demonstrated carbon inversion. galacturonate. during. the. synthesis. (Loewus and Kelly,. 1961).. of. AsA. from. D-. Additionally,. an. enzyme activity capable of the reduction of D-galacturonic acid (GaIUA) to L-galactonic acid was detected in plant extracts. 7.
(14) (Mapson and Isherwood, 1956).. More recently, D-galacturonic. ac id reductase (Gal UAR; E. C . 1 . 1 . 1 . 203) was identi f ied arnongs t a group of genes which ware differentially expressed in strawberry fruits during ripening (Agius et al., 2003) and furthermore, gene expression was closely correlated with AsA accumulation. as. fruit. ripened.. Over expression of. the. strawberry galUAR gene in Arabidopsis enhanced the AsA content by 2 to 3 times in lines with 10-S0-fold enhancement of GalUAR activity. In this study AsA is considered to play the important role in the regulation of cellular AOS level.. However little is known about. the difference in the photooxidative-stress tolerance of leaves wi th age, and the regulatory system for the biosynthesis of AsA in higher plants. In the present thesis, I studied the followings; (1) Decline in leaf photooxidative-stress tolerance with age in tobacco (2) Molecular. characterization. of. spinach. L-galactose. dehydrogenase (3) Effect of photosynthesis on ascorbate synthesis in leaves (4) Investigation enzymes involved in ascorbate biosynthesis using. overexpression. and. Arabidopsis. 8. antisense. suppression. in.
(15) CAPTER II Decline in leaf photooxidative-stress tolerance with age in tobacco. Introduction. Leaf senescence, the final stage of leaf development, involves an array of physiological and metabolic changes that lead to the eventual leaf death.. Although senescence is. initiated by programmed differential regulation of a set of senescence-related genes, at the metabolic level senescence is an oxidative process, and most of the catabolic processes involved in senescence are propagated irreversibly once initiated (Krupinska et al., 2003; Buchanan-Wollaston, 1997; Jones and Dangl, 1996; Weaver et al., 1997). In photosynthetic organisms, chloroplasts are the major source of AOS because even under optimal conditions the photosynthetic electron transport generates AOS (Asada, 1999; 2000).. It has been well documented that chloroplasts undergo. the earliest changes during senescence. One of the most conspicuous features of senescence is the loss of chlorophyll and the associated decline in the photosynthetic activity (Smart, 1994).. In chloroplasts, even a low level of H20 2 (10. pM) can inhibit CO 2 fixation by up to 50% through oxidative inactivation of the photosynthetic carbon-reduction-cycle enzymes (Takeda et al., 1995; Kaiser, 1976).. APX, which occurs. as two isoenzymes in the chloroplast (as a soluble enzyme in the stroma and a thylakoid membrane-bound enzyme), is a key component of the water-water cycle, which is essential for photosynthesis (Shigeoka et al., 2002).. Transgenic tobacco. plants expressing bacterial catalase in the chloroplast have been shown to have higher tolerance to photooxidative stress (Miyagawa et al., 2000).. Recently demonstrated that the 9.
(16) thylakoid membrane-bound APX is the limiting factor in plant tolerance to photooxidative stress (Yabuta et al., 2002). The global changes that are associated with senescence, especially any decline in the cellular antioxidant capacity, could have important effects on the AOS-scavenging mechanism in the chloroplast. In this chapter, In order to understand the differences in the photooxidative-stress tolerance of leaves with age, I analyzed the levels of antioxidants and antioxidant enzymes in leaves of different ages in tobacco plants. Materials and Methods. Plant material and growth conditions Nicotiana tabacum cv. Xanthi was cultured for eight weeks in a growth chamber under a 12-h light/12-h dark regime with a moderate light intensity of 400 pmol m- 2. S-l,. 60% relative. humidity, and day/night temperatures of 25/20°C (Miyagawa et al., 2001).. Measurement of antioxidants The levels of AsA and DHA in leaf tissues (1.1 cm2 x 10 discs). were. determined. spectrophotometrically. using. AsA. oxidase (AOX) as described previously (Miyagawa et al., 2000). Levels of total glutathione were determined using a glutathione GR recycling system coupled to 5-5'dithiobis (2-nitrobenzoic acid) (DTNB).. The reaction mixture (1 ml) contained 100 mM. sodium phosphate buffer (pH 7.5), 5 mM EDTA, 0.2 mM NADPH, 0.6 mM DTNB, and the sample. The reaction was started by adding of. 0.5 unit of GR, and the rate of reduction of DTNB was monitored at 412 nm for 3 min. The level of oxidized GSSG was selectively measured by derivatizing GSH with 2-vinylpyridine (Shigeoka et al., 1987).. The difference between the total glutathione and. 1 0.
(17) GSSG contents was taken as the content of GSH.. Enzyme assays Leaf tissues (1.1 cm2 x 10 discs) were ground to a fine powder in liquid N2 and then homogenized in 1 ml of 50 mM potassium phosphate buffer (pH 7.6) with 0.3 M sorbitol, 10 mM KCI, 5 mM MgCl u 1 mM AsA and 2% (W/V) polyvinylpyrrolidone using a mortar and pestle on ice. The homogenate was centrifuged for 15 min at 100,000 x g at 4°C. The soluble fraction was assayed for the activities of stromal and cytosolic APX isozymes, while the membrane fraction was used for assaying thylakoid and microbody membrane-bound APX isozymes.. APX isoenzymes were assayed by. following the oxidation of AsA at 290 nm (2.8 mM- I cm- I to the method of Shigeoka et ale (1980).. ). according. Differential assays. of cytosolic APX and stromal APX in the soluble fraction, and thylakoid membrane-bound APX and microbody membrane-bound APX, were carried out by a method that exploits the differences in the inactivation kinetics of APX isoenzymes as described previously (Yoshimura et al., 2000).. The sum of thylakoid. membrane-bound APX activity and stromal APX activity was taken as the activity of chloroplastic APX. DHAR activity was assayed by measuring the formation of AsA at 290 nm according to Shigeoka et ale modifications.. (1987) with some. The reaction mixture contained 10 mM potassium. phosphate buffer (pH 6.3), 0.5 mM NADH, 1 mM DHA, 1 mM GSH, and the sample in a total volume of 1 mI. The reaction was initiated by the addition of the sample.. For the MDAR assay, the reaction. mixture contained 100 mM Tris-HCI buffer (pH 7.2), 0.2 mM NADH, 1 mM AsA, 0.2 units of AOX, and the sample in a total volume of 1 mI.. The reaction was started by adding AOX, which generates. saturating concentrations of MDA, and the oxidation of NADH was followed by monitoring the decrease in absorbance at 340 nm. GR activity was determined by measuring the rate of NADPH. 1 1.
(18) oxidation as the decrease in absorbance at 340 rum (6.22 1. mM-. cm- 1 ) according to the method of (Halliwell, and Foyer, 1978).. Total superoxide dismutase SOD activity was assayed by the extent of inhibition of ferricytochrome c reduction by measuring the O2- generated in a xanthine-xanthine oxidase system according to the method of McCord and Fridovich (1969). Individual activities of Cu/Zn-SOD, Fe-SOD, and Mn-SOD isoenzymes were estimated from the inhibition by H20 2 or KCN as described previously (ASada et al., 1974).. MV trea tmen t MV treatment was carried out according to Shikanai et al. (1998).. Leaf discs (1 cm diameter) were punched from the. leaves using a cork borer and floated on a solution containing 0.5 or 2 pM MV with 0.1% Tween-20 in a Petri plate. After preincubation in the dark for 12 h at 25°C, the Petri plates were exposed to light (150 pmol m- 2s- 1 ) for 1 h at 25°C. Then the leaf discs were collected, frozen in liquid N2 and stored at -80°C until used for analysis of the levels of antioxidants and antioxidant enzymes.. Gas-exchange measurement Net CO 2 assimilation rates were measured using a portable photosynthesis system LI-6400 (Li-Cor, Lincoln, NE) on fully expanded leaves as described previously (Miyagawa et al. , 2001) under the following conditions: 1,000 pmol photons m- 2 S-I, 360 ppm CO 2, 60% relative humidity at 25°C.. Ion leakage Leaf discs were treated with MV as described above except that the MV concentration was 1.0 pM.. After the treatment, the. conductivity of the floatation solution was measured with a conductivity meter (HORIBA ES-12).. 1 2. The leaf discs along with.
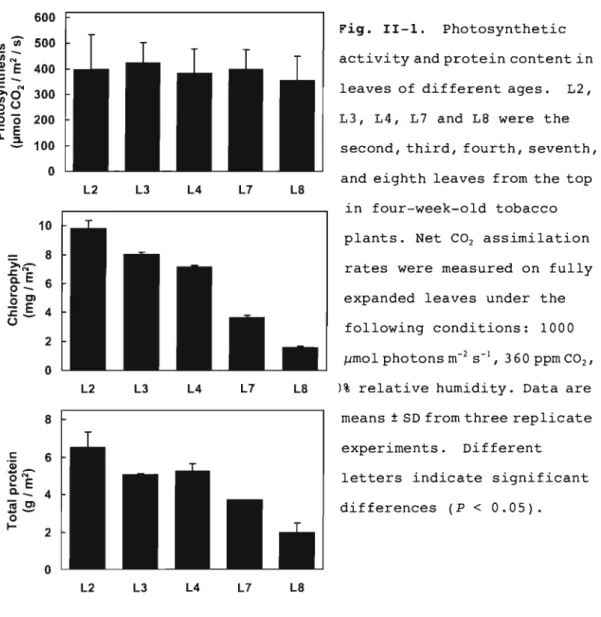
(19) the floatation solutions were autoclaved and the conductivity of the solution was measured again and taken as an index for total ion leakage.. Other methods Total protein in leaves was measured as follows.. Leaf. tissues (0.5 g) were harvested at the 6th h in the light regime and ground to a fine powder in liquid N2 using a mortar and pestle in 2 ml of 1% (w/v) SDS.. The extract was allowed to thaw and. then was heated at 100°C for 5 min. centrifuged at 12,000 x g for 5 min.. The suspension was. The pellet was re-extracted. as above and the supernatant was used for the determination of total protein by the method of Lowry et al. (1951) using bovine serum albumin as a standard.. Chlorophyll content was measured. by the method of Arnon (1949).. H2 0 2 was measured by the. homovanillic acid method with some modifications as described previously (Yoshimura et a1., 2000). Results. Photosynthetic capacity and photooxidative-stress tolerance of leaves of different ages In order to examine whether there are any differences in the photosynthetic capacity of leaves of different ages, I measured the chlorophyll content and the rate of photosynthesis in leaves at different heights in tobacco plants, as leaves at different heights can represent a continuous spectrum of different stages of senescence. In eight-week-old tobacco plants, the chlorophyll content was scarcely different among leaves of different ages (Fig. II-1A).. However, the total. protein content of older leaves was significantly lower than that of younger leaves (Fig. II-1B).. Furthermore, the. photosynthetic activity of leaves of different ages was. 1 3.
(20) negatively correlated with leaf age, with the net carbon fixation rate of older leaves being less than one-fourth that of the younger leaves (Fig. II-Ie).. These data suggest that. the biochemical changes associated with senescence affect the process of photosynthesis in the older leaves of eight week-old tobacco plants. 600. Fig. II-1.. .C;;~. --. activity and protein content in. ~ E 400 C. Photosynthetic. 500. r/lU). >-0. 300. leaves of different ages.. -0. 200. L3, L4, L7 and L8 were the. 100. second, third, fourth, seventh,. N. ~U. o. .r::. E 1l.2;. o L2. L3. L4. L7. L2,. and eighth leaves from the top. L8. in four-week-old tobacco plants. Net CO 2 assimilation rates were measured on fully expanded leaves under the following conditions: 1000 J,Jmol photons m- 2 L2. L3. L4. L7. means ± SD from three replicate experiments.. 6. -N. ~. E. Q.-. sS o. I-. 360 ppm CO 2 ,. )% relative humidity. Data are. L8. 8. c: _ '4). S- I ,. Different. letters indicate significant 4. differences (P < 0.05). 2. o L2. L3. L4. L7. L8. The tobacco plants described above were grown in a growth chamber with a daily photoperiod of 12 h under a moderate light intensi ty at 400 I1mol photons m- 2. S- l .. However, even under these. mild growth conditions, the steady-state levels of H20 2 in the older leaves were approx. 40% higher than those in the younger. 14.
(21) leaves (Fig. 11-2), suggesting that the capacity of the AOS-scavenging system in the older leaves is much lower than that in the younger leaves.. c::;' 160. E. "0 E. -o. 120. ::::1. 80 N. N. 40. J:. o L2 Fig. II-2.. L3. L4. La. L7. steady-state levels of H20 2 in leaves of different ages.. L2, L3, L4, L 7 and L8 were the second, third, fourth, seventh, and eighth leaves from the top in four-week-old tobacco plants. Leaves at mid-daylight were extracted with perchloric acid and and the H2 0 2 levels were quantified by the homovanillic acid method.Data are means ± so from three replicate experiments.. Different letters. indicate significant differences (P < 0.05).. To simulate the field condi tions of high light intensi ty, which causes photooxidative stress, I treated the leaves with MV.. In chloroplasts, MV takes electrons from PSI and transfers. them to dioxygen, generating 0 2- radicals, effectively simulating the photooxidative stress. different age were treated with 0.5. ~M. light with a moderate intensity at 150. When leaves of MV and then exposed to ~mol. photons m- 2. S-1,. the. older leaves blanched, losing 68% of their chlorophyll during 24 h of the treatment, whereas the younger leaves lost only 21% chlorophyll (Fig. 11-3).. Furthermore, the older leaves. sustained significantly higher cellular damage as a result of the MV treatment compared to the younger leaves, as evident from ion leakage (Fig. 11-3).. 1 5.
(22) Differences in levels of antioxidants and antioxidant enzymes of leaves of different ages. In order to understand the differences in the photosynthetic capacity and the tolerance to photooxidative stress with leaf age, I determined the levels of various antioxidants and antioxidant enzymes in tobacco leaves of different ages. As shown in Fig. 11-4, the levels of almost all the analyzed antioxidant enzymes and the antioxidants AsA and GSH were significantly lower in the older leaves than those in the younger leaves.. Especially, the acti vi ties of catalase,. Cu/Zn-SOD, and cytosolic APX in the older leaves were 14, 25, and 54%, respectively, of those in the younger leaves.. However,. there was no significant difference in the activities of Feand Mn-SOD in younger versus older leaves.. The total AsA and. glutathione pool sizes in older leaves were 44 and 33%, respectively, of those in the younger leaves.. Further, the. proportions of DHA and GSSG in the total AsA and glutathione pools , respectively, were hi.gher in the older leaves.. The low. levels of antioxidants and antioxidant enzymes in the older leaves may account for the higher steady-state levels of H20 2 in the older leaves (Fig. 11-2). In contrast to the significantly lower activities of catalase and Cu/Zn-SOD, chloroplastic APX activity in the older leaves was only 35% lower than that in the younger leaves (Fig. 11-4).. However,. it has been demonstrated that chloroplastic APX, especially the .thylakoid membrane bound APX, is a limiting factor in tolerance to photooxidative stress (Yabuta et al., 2002).. 16.
(23) A 0. i' 2: c. Q>. CI. 0. '0 .:;. 0.5. >.. .c. Qi. ::E. 1.0. B ~ 75 >. 60. .c. Co. ~. 0. 45. u. 30. :i: ~. ::I. .". ·iii Q>. a:. C. l. ... 15 0 L4. L7. L8. L3. L4. L7. L8. 75. Q>. 60. "" .!!. 45. CI. L3. Q>. >. 30. eti Q>. iii. Fig. II-3 . ages .. 15 0. Photooxidative-stress tolerance of leaves of different. A, Chlorosis under induced photooxidative stress. Leaf. discs were floated on a 0 . 1% Tween-20 solution containing the indicated concentrations of MV and pre incubated in the dark for 12 h .. O. They were then exposed to light of 150 pmol photons m > s ol. for 24 h at 2S·C. B, Residual chlorophyll. The 0.5 pM MV-treated samples were extracted with acetone and the chlorophyll contents were measured. The residual chlorophyll contents are expressed as percentages of those of samples that were not exposed to light . C, Ion leakage. Leaf discs were treated as described above at 1.0 pM MV for 12 h. Conductivities of the flotation solutions after the treatment were measured and expressed as percentages of the conductivity values obtained with total cell lysis attained by autoclaving the samples. L3, L4, L7 and La were the third, fourth, seventh, and eighth leaves from the top in four-week-old tobacco. 17.
(24) total AsA. GR. 16C,=. 140 r,~~----r---~---r---.. U ==-,_Z_" _S_O _D _ _----,. cE. :aE. .3. L2 L3 L4 L7 l8. Fe SOD. 8 , -''''''-'. 7. ,=. '. 15. C-. E6. .-.. 5. 3 '0 34. "'El0. 3. T"". ;: 5. ~2 1. o. L2 l3 L4 L7 L8 f-' (Xl. 3O I Cat~la~e ~25 _20 :::l 15. ";:. 10. X. 5. 40 , 35. MDAR ,. o. L2 l3 L4 L7 l8. 4M" SOD. ,. 3.5. c- 4 -E3 :::>. '02. T"". ~1. o. Fig. 11-4.. ~. Levels of antioxidants and antioxidant enzymes in leaves of different ages.. L2 l3 L4 L7 l8. o. L3 , L4, L7 and L8 were the third, fourth , seventh, and eighth leaves from. the top of four-week-old tobacco plants. cAPX, cytosolic APX ; chlAPX , chloroplastic APX; mAPX , microbody APX ; GR, glutathione reductase, OHAR, dehydroascorbate reductase; MOAR, monodehydroascorbate reductase; AsA, ascorbate; OHA, dehydroascorbate; GSH , reduced glutathione; GSSG, oxidized glutathio.
(25) Effect of photooxidative stress on levels of antioxidants and antioxidant enzymes in leaves of different ages. To clarify the role of chloroplastic APX in older leaves, I analyzed the levels of AsA and chloroplastic APX under the photooxidative stress induced by the MV treatment (Fig. lIS).. During the course of the induced photooxidative stress,. both the younger and older leaves increasingly lost their chloroplastic APX with the increase in MV concentration in a dose-dependent manner, but the destruction of chloroplastic APX in the older leaves was much more marked at higher MV concentration.. At 2 11M MV, 75% of the chloroplastic APX in the. older leaves was destroyed, whereas the extent of the destruction in the younger leaves was only 31%.. Furthermore,. the total AsA level in the older leaves markedly decreased to 42% of that before the MV treatment, while it decreased to only 59% in the younger leaves.. On the other hand, the activities. of cytosolic APX (cAPX), MDAR, DHAR, and GR were scarcely changed in both younger and older leaves, suggesting that among the antioxidant enzymes, chloroplastic APX is particularly destroyed during photooxidative stress.. 1 9.
(26) •. o. Younger leaf Older leaf. 120 ,to~1. total GSH , ,. A;sA,. 120. 140 , - , 120 100 ...... 80. C. APX. ~60. 40 20. o. o 0.5. 120 .---·~. o 0.5. 2 0 0.5 2 (JIM). 2 0 0.5 2 (JIM). .n . . 1. 1201:IA~. MDAR. GSH. AsA ,. 120 ,. o 0.5. 2 0 0.5 2 (lJM). 100 80. N. ..J.... o. o DHA. Ii ,. -~I• .l~. GSSG. 200 ~.. 150 l. 0.5 2 0 0.5 2 (JIM). o 0.5 GR. 120 ,-. 400 350 300. ~. ;1100 1. o 0.5. 2 0 (lJM). -. o 0.5. 2 0 0.5 2 (JIM). il. " .! _ i. 160 140 '. m APX •. 1.1. 2 0 0.5 2 (JIM). o 0.5. 2 0 0.5 2 (JIM). o. 0.5 2 0 0.5 2 (lJM).
(27) Fig. 11-5.. Effect of photooxidative stress on the levels of. antioxidants and antioxidant enzymes in leaves of different ages. Leaf discs were floated on a 0.1% Tween-20 solution containing the indicated concentrations of MV, pre incubated in the dark for 12 h, and then exposed to light of 150 IJmol photons m- 2. S-l. for 1 h at. 25°C. After the treatment, the leaf tissues were extracted and assayed for the levels of the indicated antioxidants and antioxidant enzymes. 'Younger leaves' were the third and fourth leaves, and 'older leaves' were the seventh and eighth leaves from the top in four-week-old tobacco plants.. See the legend to Fig. 4 for. abbreviations. Data are means ± SD from three replicate experiments.. Discussion. In order to clarify the mechanism of the oxidative stress tolerance of leaves during the course of senescence, in this work, I studied the differences in the levels of various antioxidant enzymes and antioxidants in leaves of different ages in tobacco plants.. Chloroplasts are one of the earliest. sites of catabolism in the senescence process, while mitochondria remain intact until late in the process (Smart, 1994).. In eight-week-old tobacco plants, the total protein. content was already significantly decreased in the older leaves (Fig. 11-1).. Leaf senescence involves the degradation of. proteins (Lutts et al., 1996), nucleic acids (BuchananWollaston, 1997) and membranes (Trippi et al, 1983), and in advanced stages, the loss of chlorophyll (Smart, 1994).. Even. though the chlorophyll content had not changed in the leaves of eight-week-old tobacco plants, the photosynthetic capacity decreased with increasing leaf age.. During senescence, the. transcript levels of several photosynthesis-related genes such as rbcS (small subunit of Rubisco) and cab (chlorophyll alb-binding protein) decline (Bate et al., 1991; Smart, 1994).. 2 1.
(28) The older leaves had constitutively higher levels of H2 0 2 (Fig. 1I-2).. H20 2 is not toxic by itself, but can be detrimental to. plant metabolism by forming the highly reactive hydroxyl radical through the metal-catalyzed Haber-Weiss reaction (Salin, 1988).. The high level of H2 0 2 in the older leaves was. clearly due to low levels of antioxidant enzymes, particularly catalase, Cu/Zn-SOD, and cytosolic APX, and low levels of the antioxidants AsA and GSH (Fig. 1I-4).. Pastori and del Rio. (1997) reported that during senescence in pea leaves,. peroxisomes generate AOS due to elevated levels of xanthine oxidase, urate oxidase, and Mn-SOD activities coupled with reduced catalase activity. Arabidopsis leaves have been found to loose the stress-inducibility of catalase expression with senescence (Orendi et al., 2001).. Similarly, the SOD. expression in mature barley leaves was less sensitive to oxidative stress than that in the young leaves (Casano et al., 1994).. Thus, it seems that the dynamics of AOS regulation. during senescence include both the proactive generation of AOS by up-regulation of certain enzymes as well as fine-tuned attenuation of AOS-scavenging mechanisms (Longa, 1994). Photooxidative stress contributes to senescence through even more complex mechanisms, because photosynthetic electron transport is the major source of AOS even under optimal conditions (Asada, 1999, 2000).. Under the induced. photooxidative stress conditions, the older leaves lost more chlorophyll and sustained cellular damage (Fig. 1I-3).. AOS can. cause lipid peroxidation and membrane permeability, which can lead to decreased photosynthetic capacity and increased cellular damage (Asada, 2000).. During the induced. photooxidative stress, chloroplastic APX in the older leaves was lost to a much greater extent than that in the younger leaves (Fig. 1I-5).. Even though there was no significant difference. in the loss of total GR activity in the older and younger leaves 2 2.
(29) during the induced photooxidative stress (Fig. 11-5), Casano et ale (1999) reported that in barley, chloroplastic GR was inactivated more in the mature leaves than in the younger leaves. Chloroplastic APX, the key enzyme responsible for scavenging H20 2 generated in chloroplasts, is paradoxically sensitive to H20 2 , with a half-life of only 15-20s under limiting AsA concentration (Miyake and Asada, 1996).. Both the. chloroplastic APX activity and AsA content in the older leaves were significantly decreased (Fig. 11-4).. Of all the APX. isoenzymes, chloroplastic stromal and thylakoid-membrane bound APX isoenzymes are the most labile to H2 0 2 ,and are primary targets under photooxidative stress (Mano et al., 2001).. Taken. together, these data suggest that the combination of low levels of AsA, catalase, Cu/Zn-SOn, and cytosolic APX in the older leaves (Fig. 11-4) might lead to a catastrophic state resulting in rapid inactivation of the already lowered level of chloroplastic APX during photooxidative stress (Fig. 11-5), and a resultant loss of chlorophyll and increased cellular damage.. 2 3.
(30) CAPTER III Molecular characterization of spinach L-galactose dehydrogenase. Introduction. Recently, Wheeler et ale. (1998) have proposed a new. biosynthetic pathway (the Smirnoff-Wheeler pathway) of AsA in higher plants. Based on recent studies of AsA biosynthesis, attention has been turned to its regulation. (2000). much. Yabuta et ale. reported that transcripts of L-GaIL dehydrogenase. (L-GaILDH), which functions at the last step of the biosynthetic pathway, were expressed in leaves, stems, and roots at almost the same level.. Furthermore, the transcript levels of L-GaILDH. were induced by light along with an increase in the AsA content in leaves (Tabataetal., 2002; Tamaokietal., 2003).. Recently,. Agius et ale (2003) reported that the AsA pool size in ripening strawberry fruit appears to be broadly correlated with the expression level of D-galacturonic acid reductase,. which. converts D-galacturonic acid into L-galactonic acid, leading finally. to. the. conversion. to. L-GaIL.. In. addition,. overexpression of D-galacturonic acid reductase enhances the AsA content in leaves of Arabidopsis (Agius et al., 2003). These data suggest that the AsA pool size may be determined, at least partly, by the level of expression of L-GaILDH or D-galacturonic acid reductase.. However , little is known about. the molecular machinery that regulates the AsA pool size by regulating the enzymes involved in the biosynthetic pathway of AsA. In the Smirnoff-Wheeler pathway, L-Gal dehydrogenase (L-GaIDH), which oxidizes L-Gal to L-GaIL, has been purified and characterized from pea seedling and Arabidopsis thaliana 24.
(31) (Wheeler. et. al.,. 1998;. Gatzek. et. al.,. 2002).. The. dehydrogenation of L-Gal by L-GaIDH, an irreversible reaction, can be considered to be the first committed step (Wheeler et al., 1998; Gaztek et al., 2002).. Thus, this step could be a. point for regulating the f lux through the biosynthetic pathway of AsA.. The AsA pool size in Arabidopsis is higher at high light. intensity, but neither L-GaIDH activity nor the protein level of L-GaIDH is affected in plants that are acclimated to low versus high light. In this chapter, to explore the regulatory system for the biosynthesis of AsA, I purified from spinach leaves L-GaIDH and characterized the cDNA which encodes. it.. We. found. competitive inhibition of spinach L-GaIDH activity by AsA, suggesting an equilibrium-type of feedback regulation for AsA synthesis. Materials and Methods. Materials Spinach (Spinacia oleracea) was purchased from a local market in Nara.. L-Gal, L-Gul, L-Glu, and L-Man were obtained. from Tokyo Kasei Kogyo Co., lid (Tokyo, Japan).. All chemicals. were of the highest purity grade commercially available.. Enzyme Assay L-GaIDH activity was assayed at 37°C in a 3-ml reaction mixture containing 100. roM. mM L-Gal and the enzyme.. addition of L-Gal.. Tris-HCI (pH 7.5), 0.1 mM NAD+, 0.15 The reaction was initiated by the. The formation of NADH was measured by. fluorescence (lex=340 nm,. lem=460 nm).. The fluorometer was. calibrated with freshly prepared NADH standards of 0.3-160 JiM in 100 mM Tris-HCI. (pH 7.5).. For specificity of other. substrates, L-Gal was replaced by the respective substrate at. 25.
(32) 1. mM. final concentration.. Protein was determined by the method. described by Bradford (1976).. Partial purification of L-GalDH from spinach leaves All purification steps were carried out at 4°C. leaves (2 kg) were homogenized in 4 I of 100 7.5). containing 20%. (v/v). glycerol,. mM. Spinach. Tris-HCI (pH. 1 mM EOTA,. and 2 mM. dithiothreitol (OTT) (buffer A) using a cooled blender.. The. homogenate was filtered through eight layers of cloth and then centrifuged at 10,000 x g for 20 min.. The supernatant was. subjected to ultra-centrifugation at 100,000 x g for 30 min. The second supernatant was fractioned with (NH4)2S04' and the pellet precipitated between 30 and 75% saturation was dissolved in 50 ml of buffer A.. The enzyme solution was dialysed against. 5 I of buffer A for 12 h, and then was applied to a Q Sepharose HiLoad 16/10 column (FPLC system, AmershamBiosciences, Uppsala, Sweden) equilibrated with buffer A.. The column was washed with. 100 ml of buffer A and developed with a 136-ml linear gradient of NaCI (0-0.5 M) at a flow rate of 0.8 ml min-I.. The activity. of L-GaIOH was eluted as a single peak at 0.2 M NaCI.. (NH4) 2S04. at 30% saturation was added to the active fractions.. The. precipitate was removed by centrifugation at 100,000 x g for 30 min and then the supernatant was loaded onto a HiLoad 16/10 Phenyl Sepharose column (FPLC system, Amersham Biosciences) equilibrated with 30% saturated (NH 4hS04 in buffer A.. The. enzyme was eluted with a descending gradient of (NH4)2S04 from 30 to 0% saturation in 136 ml of buffer A at an elution rate of. 0.8 ml min-I.. The active. fractions were combined and. concentrated by using Centricon-50 (Amicon, Beverly, MA, USA) . The enzyme solution was gel-filtrated with a Superdex 200 HiLoad 16/60 column (FPLC system, Amersham Biosciences) equilibrated with solution A including 0.15 M NaCl.. To determine the. molecular mass of the enzyme, the column was calibrated with. 2 6.
(33) molecular markers (Molecular weight markers for gel filtration chromatography;. Sigma,. USA).. The. active. fractions. were. combined and stored at -20°C. Detection of L-GalDH activity in gels. Samples were subjected to discontinuous PAGE under nondenaturing and reducing conditions containing 2 mM OTT according to Laemmli (1970).. Electrophoretic separation was. performed at 4°C for 2 h with a constant current of 10 rnA per gel using 10%. (w/v). polyacrylamide gels.. The gels were. equilibrated with 100 mM Tris-HCl (pH 7.5) containing 2 mM OTT at 4°C for a total of 30 min during which the equilibration buffer was changed every 10 min, and then were incubated with 100 mM Tris-HCl (pH 7.5) containing 1.5 mM L-Gal, 0.1 mM NAO+, 0.065 mM. phenazine. methosulfate. (PMS),. and. 0.48. mM. dimethyl-2-thiazolyl)-2,5-diphenyl-2H-tetrazolium. 3-(4,5bromide. (MTT) at 37°C for 30 min. SDS-PAGE and digestion of L-GalDH. SOS-PAGE was carried out on 12.5% (w/v) polyacrylamide slab gels according to the method of Leammli (1970).. Samples. were denatured by boiling for 3 min in 0.1% SOS in the presence of 5% (v/v) 2-mercaptoethanol.. The gels were transferred to. polyvinylidene difluoride (PVOF) membranes using a semidry electroblotting system (model 200/2.0, Bio-Rad, CA) at 13 V for 1 h.. The membranes were extensively washed with distilled water,. and stained with 0.06% (w/v) Coomassie Brilliant Blue R-250 in 50% methanol for 5 min.. The portion of each membrane containing. the desired protein band was cut out and destained with 30% aqueous methanol in 7% (v/v) acetic acid for 10 min.. The PVOF. membrane-bound protein (700 nmol) was digested by trypsin (Sigma) at an enzyme: substrate ratio of 1:100 for 15 h at 25°C in 100 mM NH 4 HC0 3 (pH 7.8), 10% (v/v) acetonitrile, and 10 mM. 2 7.
(34) Peptide separation and protein sequencing. The peptides of digested L-GaIDH protein were separated by reverse-phase chromatography with a column of pRPC C2/C18 SC 2.1/10 (SMART System, Amersham Biosciences).. The gradient. elution was done at 0.5 ml min- 1 with 0.1% trifluoroacetic acid (TFA) in water and 0.1% TFA in 70% 2-propanol: acetonitrile (=7:3).. The separated peptides were transferred to a PVDF. membrane using ProSorb'1'll (Applied Biosystems, CA) and sequenced by automated Edman degradation on a Model 492 pulse-liquid protein sequencer using the standard programming and chemicals provided by Applied Biosystems. RT-PCR-amplification and sequence analysis of a cDNA for LGalDH. Based on the amino acid sequence obtained, degenerate oligonucleotide. primers. were. designed. amplification of the spinach L-GaIDH.. and. used. for. the. Total RNA was prepared. from spinach leaves (2.0 g fresh weight) by the procedure of Yoshimura et al. (1999).. First-strand cDNA was synthesized. using ReverTra Ace (reverse transcriptase; Toyobo, Tokyo, Japan) with an oligo(dT) primer.. The reaction was performed. in a 20-pl mixture containing a standard enzyme buffer supplied by the manufacturer (Toyobo), oligo(dT). primer,. transcriptase.. 1 pg of total RNA,. 1 mM dNTPs,. and. 100 units of. 0.25 pM reverse. The reaction mixture was incubated at 42°C for. 60 min and then 99 °c for 5 min. cDNA for PCR analysis.. The mixture was used as template. PCR amplification was performed as. follows: 40 cycles of denaturation at 94 ° C for 60 s, annealing at 60°C for 60 s, and elongation at 72°C for 60 s, followed by incubation at 72°C for 5 min.. The reaction mixture (100 pI). contained 1 pM sense primer (P-1S: 5'-TAYGCNGARGGNTTYGAYTT2 8.
(35) 3' ). and. 1. 11M. antisense. primer. (P-2A:. 5'-. GCRTTDATNACNCCNACNCC-3' ), 200 11M dNTPs, 1. 5 units of ExTaq DNA polymerase (Takara Shuzo, Kyoto, Japan) and 10 111 of cDNA.. A. 0.4-kbp fragment was thereby amplified and then cloned into pSTBlue 1 (Novagen) and sequenced. Based on the nuc leotide sequence obtained,S' -. or. 3'-extension of the cDNA clone was performed by the rapid amplification of cDNA ends technique using a commercial kit (Gibco-BRL, Rockville, MD, USA).. Amplified fragments were. cloned into pSTBlue-l and the nucleotide sequences of the 5'and 3' -extended fragments were determined.. The following set. of primers was designed from the sequences of the 5' - or 3' -noncoding regions to amplify the full-length cDNAs encoding GDH: sense primer,S' -CCTCCACCGTTACTATTTCCAACTC-3 ' ; antisense primer, 5 '-CCAAACAGCCTCTTGAAATTGCTTG-3 , .. PCR was performed. as described above using cDNA from spinach leaves as the template.. DNA sequencing was performed by the dideoxy chain. primer method using an automatic DNA sequencer (ABI PRISM™ 310, Applied Biosystems, Foster City, CA, USA). Construction of L-GalDH expression plasmid For the construction of the plasmid to express the L-GalDH, the DNA fragment encoding the mature form of spinach L-GalDH was amplified by PCR.. The oligonucleotide primers. contained an Eco RI restriction site (bold sequence), 5'GAATTCCATGAACACCCATCAAAAATTAGA-3' and 5'-AGAACACATCTAGTACCTGC-3'.. PCR amplification was carried. out in a 100-111 reaction mixture containing 10 111 of 10 x PCR buffer, 200 11M dNTPs, 2.5 units of ExTaq DNA polymerase, each primer at 1.0 11M, and 5 ng of template cDNA. as described above.. PCR was performed. The DNA fragments generated by PCR were. purified by gel electrophoresis and ligated into the pSTBlue-l. Following the transformation of E. coli strain DH5a cells, a. 2 9.
(36) clone of the candidate mutant was isolated and sequenced across the region of interest by the dideoxy chain-primer method in order to establish the fidelity of L-GalDH construction.. From. this plasmid digested with Eco RI, a 0.9-kbp DNA fragment encoding L-GalDH was isolated, integrated into the pGEX-5X3 expression vector (Amersham Biosciences) treated with the same restriction enzymes, and then introduced into the E. coli strain. DH5a.. The. plasmid. DNA. ampicillin-resistant transformants verified by digestion with Eco RI.. was. prepared. and the. from. the. construct was. The resulting construct,. designated pGX/L-GalDH, was introduced into the E. coli strain BL21(DE3)pLysS to test its ability to direct the synthesis of recombinant L-GalDH. Production of the recombinant enzyme in E. coli E. coli transformed with pGX/L-GalDH was grown in 50 ml of LB medium supplemented with ampicillin (50 pg ml- 1 ) at 37°C overnight. medium.. The culture was then transferred to 1 liter of LB. When the culture reached an absorbance of 0.6 at 600. nm, 0.4 mM isopropyl 13-D-thiogalactopyranoside (IPTG) was added, and the bacteria were grown for a further 6 h at 37°C.. The cells. were harvested by centrifugation at 6,000 x g for 10 min, and the pellets were kept frozen at -20°C. GST-affinity chromatography of the recombinant L-GalDH All purification steps were carried out at 4°C.. The. recombinant E.coli cells (3.8 g wet weight) transformed with pGX/L-GalDH were resuspended in 20 ml of 100 mM Tris-HCl (pH 7.5) containing 140 mM NaCl (buffer B) and sonicated (10 kHz) using five 10-s strokes at an interval of 30 s. was centrifuged at 15,000 x g for 20 min.. This lysate. The supernatant. obtained was subjected to ultracentrifugation at 100,000 x g for 30 min.. The supernatant was then loaded onto a 1-ml GSTrap 3 0.
(37) FF. column. (Amersham. Pharmacia. equilibrated with buffer B.. Biotech,. Uppsala,. Sweden). The column was washed with 10. volumes of buffer B and the recombinant L-GalDH was eluted wi th 3 volumes of buffer B containing 10 roM GSH.. Southern blot analysis. Total DNA was prepared from spinach leaves (20 g fresh wt) by the procedure of Ishikawa et al. (1997).. The DNA (20. pg) was digested to completion wi th various restriction enzymes, separated. by. agarose. gel. electrophoresis. ( 1%. gel),. and. transferred to a Hybond N+ membrane (Amersham Biosciences) using a Model 785 Vacuum Blotter according to the manufacturer's instructions (Bio-Rad, Richmond, CA, USA).. After transfer of. the DNA to a membrane, the genomic DNA fragments for L-GalDH were detected by probing wi th the. 32. P- random primed L-GalDH cDNA. using a Random Primed DNA Labeling Kit (Takara Shuzo, Kyoto, Japan).. The membrane was washed in 1 X standard saline citrate. (SSC), 0.1 X SSC, 0.1% SDS at 68°C.. The membrane was then exposed. to an imaging-plate using Mac BAS 2000 (Fuji Photofilm, Tokyo, Japan) •. RNA Extraction The total RNA was isolated from the spinach lanves (1 g, F.W.) as previously described (Yoshimura et al.,1999).. Northern blot analysis Total RNA (20 pg each) was subjected to electrophoresis on 1.2% (w/v) agarose gels containing 2.2 M formaldehyde and transferred. to. a. Hybond. N+. membrane.. The. membrane. was. prehybridized at 55°C for 3 h in a buffer containing 6 X SSC, 5 X Denhardt' s solution, 1% (w/v) SDS, and 100 pg mrl denatured salmon sperm DNA.. The membrane was hybridized at 60°C for 12. h in the presence of. 32. P- random-primed cDNA of spinach L-GalDH. 3 1.
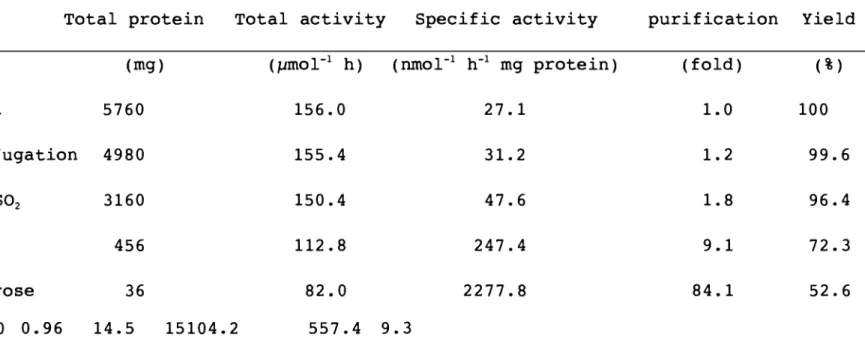
(38) and washed twice at room temperature in 2 X SSC, 0.1% SDS for 10 min each, and in 0.1 X SSC, 0.1% SDS at 65°C for 1 h.. The. membrane was then exposed to an imaging plate, and the relative expression level of the L-GaIDH transcript was estimated using a Mac BAS 2000 and expressed as the mean values from three individual experiments. Determination of AsA and DHA AsA and DHA were measured by the methods as previously described in chapter II. Results. Purification of L-GalDH from spinach leaves L-GaIDH was purified 557. 4-fold with 9.3% recovery from spinach leaves by. (NH4) 2S04 precipitation,. anion exchange. chromatography, hydrophobic interaction chromatography, and gel filtration. (Table 111-1).. The purified enzyme had a. specific activity of approx. 15.1 ± 0.3 I1mol h- 1 mg- 1 protein. During the purification, the enzyme activity was eluted from all. columns. as. a. sharp. single. peak. (data. not. shown).. Furthermore, the enzyme had a molecular mass of 75 kDa as estimated. by. gel-filtration. chromatography.. The. active. fractions from the gel filtration column were further separated by native PAGE, followed by staining for L-GaIDH acti vi ty.. Only. a single band was detected with the addition of L-Gal (data not shown).. These data indicate that spinach leaves contain only. one type of L-GaIDH protein. properties and kinetic parameters of L-GalDH I explored the enzymological properties of the L-GaIDH purified from spinach leaves.. The spinach enzyme utilized. L-Gal with highest specificity, followed by L-gulose (L-Gul) 3 2.
(39) Table III-l. Purification for L-GalDH from spinach. Total protein. Step. Total activity (pmol- 1 h). (mg). Specific activity (nmOr 1. h- 1 mg protein). purification. Yield. (fold). ( %) 100. Crude extract. 5760. 156.0. 27.1. 1.0. Ultra-centrifugation. 4980. 155.4. 31.2. 1.2. 99.6. 30-75%. 3160. 150.4. 47.6. 1.8. 96.4. 456. 112.8. 247.4. 9.1. 72.3. 36. 82.0. 2277.8. 84.1. 52.6. eN eN. (NH4) 2S02. Q Sepharose Phenyl Sepharose Superdex 200 0.96. 14.5. 15104.2. 557.4. 9.3.
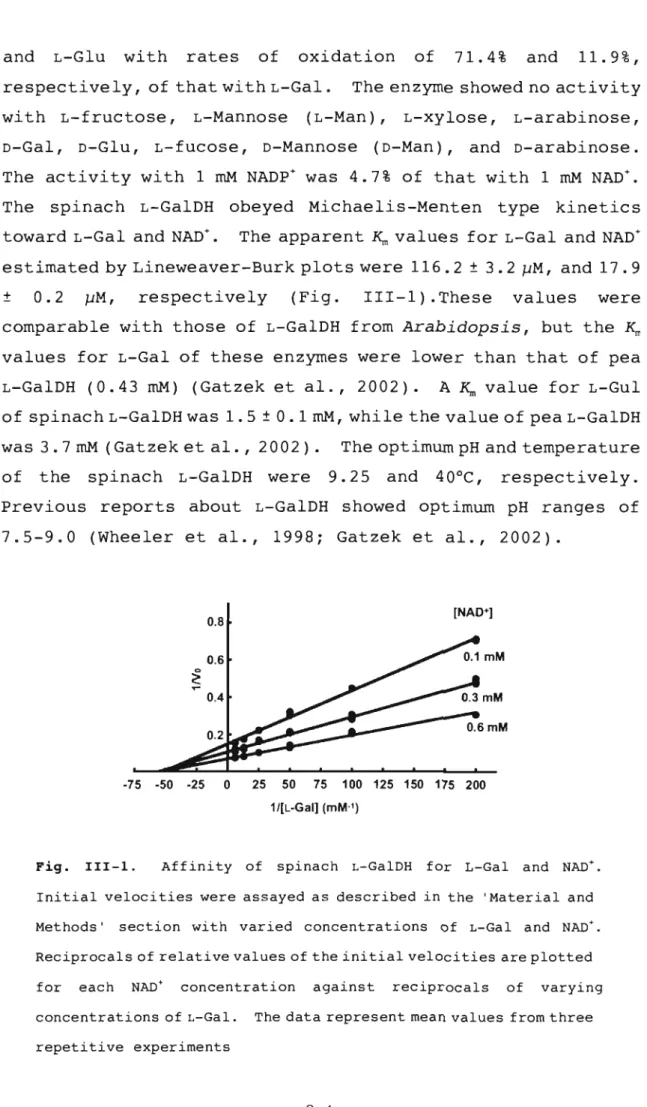
(40) and. L-Glu. with. rates. of. oxidation. respectively, of that with L-Gal. with L-fructose,. L-Mannose. of. 71.4%. and. 11.9%,. The enzyme showed no activity. (L-Man),. D-Gal, D-Glu, L-fucose, D-Mannose. L-xylose,. (D-Man),. L-arabinose,. and D-arabinose.. The activity with 1 mM NADP + was 4.7% of that with 1 mM NAD+. The. spinach L-GalDH obeyed Michaelis-Menten type. toward L-Gal and NAD+.. kinetics. The apparent K,. values for L-Gal and NAD+. estimated by Lineweaver-Burk plots were 116.2 ± 3.2 J..lM, and 17.9 ±. 0.2. respectively. J..lM,. (Fig.. III-1).These. values. were. comparable with those of L-GalDH from Arabidopsis, but the K,. values for L-Gal of these enzymes were lower than that of pea L-GalDH (0.43 mM) (Gatzek et al., 2002).. A K,. value for L-Gul. of spinach L-GalDH was 1.5 ± 0.1 mM, while the value of pea L-GalDH was 3.7 mM (Gatzek et al. , 2002). of. the. spinach L-GalDH were. The optimum pH and temperature 9.25. and. 40°C,. respectively.. Previous reports about L-GalDH showed optimum pH ranges of 7 .5-9.0 (Wheeler et al., 1998; Gatzek et al., 2002).. [NAD+]. 0.8 0.6. ....~. 0.4 0.2. -75. -50. -25. 0. 25. 50. 75. 100 125 150 175 200. 1/[L-Gal] (mM·1). Fig.. III-I.. Affinity of. spinach L-GalDH. for. L-Gal. and NAD+.. Initial velocities were assayed as described in the 'Material and Methods'. section with varied concentrations of L-Gal and NAD+.. Reciprocals of relative values of the ini tial veloci ties are plotted for. each. NAD+. concentration. concentrations of L-Gal.. against. reciprocals. of. varying. The data represent mean values from three. repetitive experiments. 3 4.
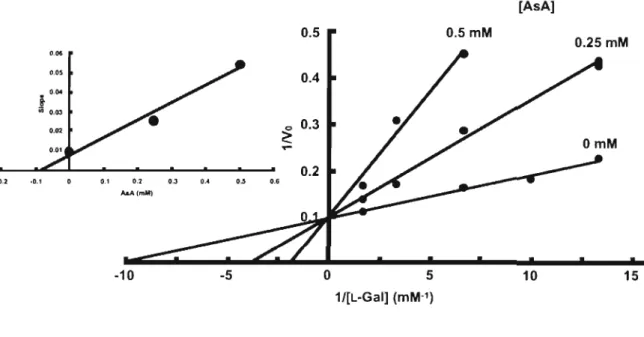
(41) the. Interestingly,. spinach. L-GaIDH. activity. was. inhibited 41% by 1 mM AsA, the end product of the biosynthetic The. pathway.. inhibition. kinetics. indicated. a. linear-. competitive inhibition with a Ki value of 133.2 ± 7.2 J.1M (Fig. 111-2).. The extent of inhibition did not change by prolonged. incubation with AsA, and the activity could be restored to the original value by removing the AsA by a treatment of the reaction mixture with ascorbate oxidase (Table 111-2).. [AsA] 0.5mM. 0." 0,05. i··.. U). Q.03. 0.02. · 0.2. ·0.1. 0 .2. 0,1. 0.3. 0..4. 0.5. 0.6. ,..A(mM). -10. o. -5. 5. 15. 10. 1/[L-Gal] (mM·1). Fig.. III-2.. Inhibition. of. spinach L-GalDH. by AsA.. Initial. velocities were assayed as described in the' Material and Methods' section with AsA at 0,0.25, or 0.5 mM. NAD+ concentration was held constant at 0.1 mM. velocities. are. Reciprocals of relative values of the initial. plotted. for. each. AsA. concentration. recipr ocals of varying concentrations of L-Gal.. against. The inset figure. is the secondary plot of the slopes against AsA concentration.. The. data represent mean values from three repetitive experiments.. These data suggest that the inhibition of spinach L-GaIDH is reversible, and not due to inactivation of the enzyme.. L-GaIDH. purified from Arabidopsis also showed the inhibition by AsA (data not shown) .. The L-GaIDH activity was not affected by the addition. 3 5.
(42) of 1. dehydro-AsA (DHA) or 1. mM. mM. L-GalL.. The enzyme activity. was stimulated 17% and 28% by 1 mM DTT and 1 mM GSH, respectively, and was inhibited 67% and 92% by 5 and 0.2. mM. mM. p-chloromercuribenzoate.. N-ethylmaleimide (NEM) However, the activity. inhibited by NEM was restored to 71% by incubation with 5 GSH.. mM. A similar inhibition has been reported for pea L-GalDH. (Gatzek et al., 2002).. These data indicate that a sulfhydryl. group in the enzyme protein participates in the reaction. Table 111-2. Reversibility of spinach L-GalDH inhibition by AsA.. Purified spinach L-GalDH was incubated in 100 roM Tris-HCl buffer (pH 7.5) with or without. (control). 0.5 roM AsA at 37. ·C.. After the. indicated times, an aliquot of the incubation mixture was taken out and assayed for L-GalDH activity by adding L-Gal (0.15 roM) and NAD+ (0.1 roM).. One set of samples was treated with ascorbate oxidase (AOX:. 5 limol min- 1 ml- 1 ) for 5 min before the assay of activity.. The initial. velocities are presented as percentages relative to those at the start of. the. incubation.. The data. repetitive experiments.. represent mean. values. from three. Asterisks indicate that the mean values are. significantly different compared with those of the control (P<O.05).. L-GalDH activity after incubation. o Control. 15. 100 ± 3.0. 96.9. ±. 30 min. 3.4. 93.2. ±. 5.6. ±. 3.0*. 0.5. mM. AsA. 36.4 ± 4.0*. 31.3 ± 2.9*. 34.4. 0.5. mM. AsA,. 98.2 ± 2.0. 92.9 ± 1.3. 93.9 ± 3.0. AOX treatment. Amino acid sequence analysis of L-GalDH peptides To further purify the enzyme, the active fractions were separated by SDS-PAGE.. Silver-staining after SDS-PAGE of the 3 6.
(43) partially puri fied enzyme showed a major band of 36 kDa (data not shown). for. The prote in band was i solated from the gel and used. analysis. of. the. N-terminal. amino. acid. sequence.. Unfortunately, I could not determine the N-terminal amino acid sequence due to blockage of the N-terrninus.. Therefore, in order. to determine the amino acid sequences of some internal peptides, the 36-kDa protein was cleaved by digestion with trypsin. Approx. 15 peptides were detected based on absorbance at 210 nrn after reverse-phase chromatography, and well-resolved peaks (2 peptides) were collected and sequenced.. The amino ac id. sequences of peptide-1 and -2 were as follows: YAEGFDFSAER,. peptide-2:. GVGV1NASPLSM.. Both. peptide-1:. peptides. had. significant h omology to the internal amino acid sequence of L-GaIDH. fr om Arabidopsis. AJ417563) Spinach Ki wif rui t Apple Arabidopsi s. (Gatzek et. al.. accession. number. (Fig. 111-3). 1. f'lliT- - -H. - - ER ELGNTGLNLSCVGFGASPLGNVFGDVSEEQSIATVIEAFNQGINF. 1 MTT ---- - - LDL - - RPLGNTGLKLSSVGFGASPLGNVFGPVSDHDAIASVREALRLGINF. 1 MASQPLP1 T- - -- - -. * 56 53 58 53. - - ELGNTGLKLSOVGFGASPLGNVFGPVSDDEA]GSVREAFRRGINF GNTG KV~AVGEGAS PLG SVFGPVAEDDAVATVREAFRLG1NF * * ****** * ** * ****** *** * **** * **. IE~ --RA. 55 52 57 52. FDTSPYYGATLSEKVLGKCLKALGASRDEYIVATKCGHOCAEGFDFSAEijVTKSIDESLER FDTSPYYGGTLSEKVLGKALKALGVPRNEYIVSTKCGRYAEGFDFSAERVTK9FDESLER FDTSFYYGGTLSEKVLGKTLKALGVPRSEYv.vATKCGRYADGFDFSADRVTKSIDESLER ~SPYYGGTLSEKMLGK~KALQVPRSDYIVATKCGRYKEGFDFSAERVRKSIDESLER * * * ** **** ****** ** ** ****** * ** ***** ***** ** * ****. 115 11 2 117 11 2. 11 6 LQLEYVDILQCHDIEFGSLDQIVNETIPALQKlKE SGKTRFIGITGLPL~RVP 113 LQLDYVDILQCHDIEFGSLDQIVNETIPALQKLKEAGKIRFIGITGLPLGVFTYVLDRVP 118 LQLDYVDIL~CHDIEFGSLDQIVNETIPALKKLKEAGKIRFIGITGLPLGIFTYVLDRIP 113 ~LDYVDIUgCHDIEFGSLDQIVSETIPALQKLKQEGKTRFIGITGLPLDIFTYVLDRVP *** **** * ************* ** * *** * * ** ********** ****** *. 175 172 177 172. 176 173 178 1 73. PGTIDVV SY CINDSTLEDMLPYFKSItNGVlNASPiSMGLHTENGPPEWHPASPEI PGTVDVILSYCHYSINDSTLEDLLPYLKSKGVGVISASPLAMGLLTESGPPEWHPASPEL AGMVDVVrSYCHYGINDSTLEDLIPYLKSKGVGIISASPLAMGLLTElN,GPPEWHPASAEL PGTVDV I LSYCHYGVNDSTLLDLLPYLKSKGVGVISASPLAMGLLTEQGPPEWHPASPEL * ** ****** ***** * ** ****** * **** *** ** ********* *. 23 5 232 2 37 232. 236 /NAAOMAADYCKKNGKNISKLALQYSLSNRDISTTLVGMNSW<QVEENVGAALELEJ'llAGK 2 33 KAAOCAAAAHCKEKGRNISKLAMQYSLSNKDISS I LVGMNSVKQVEENVAAANELATFGK 238 ~SACRAAAVYCKE~GNNISKLALQYSLSNRDISSVLVGMNSINQVEENVAAAVEDATIG~ 233 ~ASKAAVAHCKS KGKK I ~KLALQYSLANKE ISS VLVGMS SVSQVEENVAAVTELES LGM ** * * *** **** ** ** **** * ****** * ** * * ** *. 295 292 29 7 292. 295 2 92 297 292. EK~FA~IENILKPIKNQSWPSGIQQT DEKTVSEIEEILKPVKNQ~SGIQQI N EKlLAEVE~ILKPVKNQTWPSGLQQ S. OQE~LSEVE~ILEPVKNLTWPSGIHQN. * * ** * **. * **. *. 3 7. 322 319 324 319.
(44) Fig. 111-3.. Comparison of the deduced amino acid sequences of. L-GalDH from spinach, kiwifruit (accession number AY176585), apple (AY264803), and Arabidopsis (AJ417563). optimize the alignment.. Gaps were introduced to. Amino acid residues conserved in more than. three sequences are shaded.. The asterisks show the consensus amino. acid residues in the four species.. Boxed residues are N-terminal. sequences of products of trypsin digestion determined by protein sequencing.. Isolation and characterization of a cDNA encoding L-GalDH A O.4-kbp fragment was amplified with primers P-1S (a degenerate primer coding for peptide-1) and P-2A (a degenerate primer coding for peptide-2).. This fragment was cloned into. plasmid pSTBlue-1 and the nucleotide sequence was analyzed. The fragment encoded a 119-residue polypeptide.. Based on the. nucleotide sequence obtained, we applied the RACE technique to determine the 5'- and 3'-flanking sequences. fragments were cloned into pSTBlue-1,. The amplified. and the nucleotide. sequences were determined for the approx. O. 4-kbp 5' -extended fragment and O. 6-kbp 3' -extended fragment.. A full-length cDNA. encoding the L-GalDH protein was amplified using a set of primers designed from the sequences of the 5'- or 3'-untranslated regions.. A 1.2-kbp fragment was amplified, cloned into the. pSTBlue-1, and sequenced. I cloned the full-length cDNA of spinach L-GalDH by RT-PCR using degenerate primers designed from the internal peptide sequences and 5' - and 3' -RACE technique, as described in the Materials and Methods section.. The cDNA contained 1,239. bp with an open reading frame of 966 bp encoding 322 amino acids (Fig. III-3).. The calculated molecular mass of the protein was. 35261.4 Da, which was in agreement with the molecular mass of the purified enzyme.. The deduced amino acid sequence contained. the sequences obtained experimentally for the two trypsindigested fragments, suggesting the authenticity of the cloned cDNA.. The deduced amino acid sequence of spinach L-GalDH showed. 3 8.
(45) 82, 79, and 75% homology to L-GaIDH from kiwifruit, apple, and Arabidopsis, respectively (Fig. 111-3). Expression of spinach L-GalDH in E. coli Next, I expressed the cDNA in a fusion construct with the glutathione S-transferase (GST) gene in Escherichia coli to obtain recombinant L-GaIDH enzyme.. The recombinant L-GaIDH. accounted for nearly 10% of the total protein in the E. coli cells, as shown by SDS-PAGE.. By one-step purification with a. GST-affinity column, I could obtain apparently pure protein that had GDH activity of 2.17 ± 0.07 pmol min- 1 mg- 1 protein. The substrate specificity of the recombinant enzyme was in good agreement with that of the native enzyme (data not shown). Southern blot analysis I examined the genomic organization of the gene encoding the L-GaIDH protein by Southern blot analysis. prepared. from. spinach. leaves. was. When the DNA. digested with. several. restriction endonucleases and the fragments were probed with 32 p labeled-spinach L-GaIDH cDNA, a single band was detected in both Eco Rl and Bam HI digests (Fig. 111-4), suggesting that there is a single copy of the L-GalDH gene in the spinach genome. This result agreed with the elution profile of L-GaIDH during the purification.. Similarly,. L-GalDH from Arabidopsis is. encoded by a single copy gene (Gatzek et al. 2002). Expression of L-GalDH in different organs To understand the role of L-GaIDH in different organs, I estimated the activities and transcript levels of L-GaIDH and AsA levels in leaf, stem, and root of mature spinach plants (Fig. 111-5).. The comparable levels of both the activity and. transcript abundance suggest that L-GaIDH plays an active role in AsA biosynthesis in different organs.. 3 9.
(46) kbp. 23.139.42-. 3:g~=. 2.322.020.56Fig. III-4.. Southern blot analysis of the L-Gal DH gene.. Genomic. DNA (20 J.1g) isolated from spinach leaves was diges t ed to completion with the indicated restriction enzymes, separated by agarose gel electrophoresis. (1% gels),. and transferred to a membrane.. gel-blot membrane was hybridized with. J2. The. P-l a belled full-length cDNA. of spinach L-GalDH under high stringency conditions and visualized by autoradiography.. I also examined the activity and transcript levels of L-GalDH during germination.. When 2-week old dark-grown etiolated. seedlings were illuminated at 50 f.1E m- 2. S- l ,. the AsA content. increased until 24 h and was then maintained at a constant level. In contrast,. the AsA level was. cotyledons.. However,. no. not. significant. altered in etiolated differences. in. the. activi ty, or the steady-state transcript levels of L-GalDH were found between the greening and etiolated cotyledons 111-6).. 4 0. (Fig..
(47) A L-GaIDH rRNA Leaf. B. Root. 100. .... .. 80. ~. ~. 0>. ~. .... ..... 1. r. 60. ~. :I:. T. 1. til. u co. C. Stem. Cl. iij. J:. 40. (!). "0 E c:. 20. ~. 0. C. Leaf. Stem. Root. 3. -- ....i.. c. ~. Q). til. u. <til <. •. 2. Q). c 0. D. ..... AsA DHA. C,. -. 0. E. 1. ::1.. Leaf. Fig. III-S. contents. Root. Activity and transcript levels of L-GalDH, and AsA/DHA. in. analysis.. Stem. different. organs. of. spinach.. (A). Northern. blot. Total RNA (20 J..lg) isolated from 7-week old spinach leaves,. sterns, and roots, was subjected to electrophoresis on 1.2 % agarose gel containing 2.2 M formaldehyde, and transferred to a membrane. The gel-blot membrane was hybridized with 32 P-labelled full-length cDNA. of. spinach. L-GalDH. and. visualized. by. autoradiography.. Ethidium bromide staining of the rRNA is shown for loading control. The rnRNA levels of each sample were quantified using a Mac BAS 2000, normalized Activities.. by. the. respective. 18S. ribosomal. RNA. level.. (B). Proteins in the soluble fractions were precipitated. by (NHd 2S04' dialyzed, and assayed for L-GalDH activity. and DHA contents.. (e) AsA. The data shown are the mean values ± S.D. of three. individual experiments.. 4 1.
(48) A. Light. o. Dark. 24 48 12 24 48 12. L-~::: i*:':,:~,:,:;:;; c. B. o. 30. 2. 3. 25. ,~ 20. Qj. > .!!. 1. e. c(. 1. Q.. z a:. b. 15. E. E .i:: 0 ~ 10. .~. 10. ~. -<>- Light]A A _Dark. -<>- Light. -..-Dark. 5. _Dark. o. o o. S. --I>- Li9ht]DHA. 24. 48. 12. 0. Oh. Time (h). Fig. 111-6.. 12 h. 12 h. Light. Dark. •. •. o. 24. 12. Changes in AsA/DHA contents, and the transcript and. activity levels of L-GalDH in greening spinach cotyledons . Northern blot analysis. Relative. 48. Time (h). mRNA. levels.. (A). See the legend to Fig. 5 for details. (B) The. mRNA. levels. of. each. sample. were. quantified using a Mac BAS 2000, normalized by the respective 18S ribosomal RNA level, and expressed as the mean value ± S.D. of three individual experiments. Activities.. The value at time 0 was set to 1.. (D) AsA and DHA contents.. (C). The data shown are the mean. values ± S.D. of three individual experiments.. Asterisks indicate. that the mean values are significantly different compared with those of the control plants (P<O.OS).. Discussion. In order to study the enzymological properties of LGalDH, in this work I purified the enzyme from spinach leaves. So far, L-GalDH has been purified only from pea (Gatzek et al., 2002).. The spinach L-GalDH was apparently located in cytosol. because we purified the enzyme from soluble fraction and the corresponding cDNA encodes for no known signal peptide.. 4 2. The.
(49) enzyme was a homodimer with a subunit mass of 36 kDa, whereas pea L-GalDH was a homotetramer (Gatzek et al., 2002).. Compared. to pea L-GalDH, the spinach L-GalDH showed higher affinity for L-Gal and NAD+ (Fig. 111-1). Because the only known metabolic fate of L-GalL is oxidation into AsA, the dehydrogenation of L-Gal by L-GalDH can be considered as the first committed step in the SmirnoffWheeler pathway. (Wheeler et ale. 1998).. Furthermore,. the. reaction by L-GalDH has been reported to be irreversible (Gaztek et al., 2002).. Thus, the dehydrogenation of L-Gal could be a. point for regulating the flux through the pathway.. I finding. that spinach L-GalDH is competitively inhibited by the end product AsA (Fig. 2), which was also observed with Arabidopsis L-GalDH (data not shown), suggests a feedback regulation in AsA biosynthesis in the plant.. In fact, a feedback control in the. AsA biosynthesis has already been demonstrated by Pallanca and Smirnoff (2000).. They observed that the rate of AsA synthesis. 14. from [U_ C] o-Glu decreased linearly with the increase in the pool. size of AsA in embryonic pea seedlings.. Given the. cytosolic concentration of AsA of as much as 20 roM (Foyer and Lelandais, 1996) and the barely detectable levels of L-Gal, the low Ki value of 133 11M for AsA of the spinach L-GalDH means that a large capacity of L-GalDH is under tight control.. When barley. leaf discs were incubated with L-Gal, AsA content in the leaf tissues increased rapidly by several folds (Wheeler et al., 1998).. Similarly, when L-GalDH was overexpressed in tobacco. plants, there was no increase in the leaf AsA content (Gaztek et al.,. 2002).. Also,. antisense suppression of L-GalDH in. Arabidopsis did not cause a reduction in the AsA pool size under. low light intensity (Gaztek et al., 2002).. Operation of L-. GalDH under feedback inhibition by AsA through. ~. modulation. may offer an explanation for the above findings. Recently, Wolucka and Montagu (2003) have found that GDP-L-Gul arises as an intermediate during the sequential double. epimerization. of. GDP-o-Man. 43. into. GDP-L-Gal.. They.
(50) proposed an alternative pathway involving L-GalDH to oxidize L-Gul to L-gulono-1,4-lactone (L-GulL), and speculated that a cytosolic or a microsomal oxidase/dehydrogenase is responsible for the conversion of L-GulL into AsA. spinach L-GalDH has a lower. ~. However, even though. of 1.5 mM for L-Gul compared to. that of 3.7 mM in case of pea L-GalDH, I observed the same degree of inhibition of L-GalDH activity with L-Gul by AsA, as that wi th L-Gal (data not shown).. Accordingly, under the cytosolic. concentration of AsA, the apparent. ~. of spinach L-GalDH for. L-Gul would be several tens of millimolar concentration, which needs to be considered in appreciating the physiological significance of the proposed L-Gul pathway in plants. The activity and transcript levels of L-GalDH were comparable in different tissues of spinach (Fig.. 111-5),. suggesting an active role of L-GalDH in AsA synthesis in different organs.. Previously, Yabuta et al., (2000) reported. that the transcript levels of mitochondrial L-GalLDH were also comparable in different organs of tobacco.. However, as shown. in Fig. 5, it has been known that AsA levels vary greatly in different organs (Agius et al., 2003; Tamaoki et al., 2003). Further,. AsA. levels. change. in. physiological states (Fig. 111-6).. response. to. different. Although in this study. shows that L-GalDH is competitively inhibited by AsA, the extent of the feedback inhibition in the regulation of AsA in vivo needs to be studied.. 44.
(51) CAPTER IV Effect of photosynthesis on ascorbate synthesis in leaves. Introduction. A feedback control in the AsA biosynthesis has been demonstrated by Pallanca and Smirnoff (2000).. They observed. that the rate of AsA synthesis from [U_ 14 C] D-Glu decreased linearly with the increase in the pool size of AsA in embryonic pea seedlings.. Furthermore, in the presence of AsA, a decrease. incorporation of the. e C]D-Man label into AsA was observed in 4. Arabidopsis cell suspension cultures, indicating that AsA. inhibited its own biosynthesis by a feedback control at the level of GME (Wolucka and Van Montagu, 2003).. Recently, I found. that spinach L-GalDH is competitively inhibited by AsA (see chapter III).. These results strongly suggest that the AsA level. in plant cells is regulated at several steps by the feedback control.. However, the mechanisms of feedback control of AsA. are not fully understood. Jasmonic acid and its methyl ester (jasmonates) mediate plant responses to many biotic and abiotic stresses by triggering a transcriptional reprogramming that allows cells to cope with pathogens and stress (Reinbothe et al., 1994; Turner et al., 2002).. Recently, Woluka et ala (2005) reported. that methyl jasmonate treatment increases the de novo synthesis of ascorbic acid in Arabidopsis and tobacco Bright Yellow-2 (BY-2) suspension cells.. In BY-2 cells, this stimulation. coincides with enhanced transcription of GME and a putative L-GulL dehydrogenase/oxidase.. It seems likely that these. enzymes via jasmonic acid and its methyl ester regulate the AsA level in BY-2 cells. The role of AsA in photosynthesis is well recognized as a photoprotectant in scavenging the deleterious active oxygen. 45.
図

+7


関連したドキュメント
We present sufficient conditions for the existence of solutions to Neu- mann and periodic boundary-value problems for some class of quasilinear ordinary differential equations.. We
In Section 13, we discuss flagged Schur polynomials, vexillary and dominant permutations, and give a simple formula for the polynomials D w , for 312-avoiding permutations.. In
Then it follows immediately from a suitable version of “Hensel’s Lemma” [cf., e.g., the argument of [4], Lemma 2.1] that S may be obtained, as the notation suggests, as the m A
The proof uses a set up of Seiberg Witten theory that replaces generic metrics by the construction of a localised Euler class of an infinite dimensional bundle with a Fredholm
This paper presents an investigation into the mechanics of this specific problem and develops an analytical approach that accounts for the effects of geometrical and material data on
The object of this paper is the uniqueness for a d -dimensional Fokker-Planck type equation with inhomogeneous (possibly degenerated) measurable not necessarily bounded
[Mag3] , Painlev´ e-type differential equations for the recurrence coefficients of semi- classical orthogonal polynomials, J. Zaslavsky , Asymptotic expansions of ratios of
While conducting an experiment regarding fetal move- ments as a result of Pulsed Wave Doppler (PWD) ultrasound, [8] we encountered the severe artifacts in the acquired image2.
