平成
29 年度
学位論文(博士)
平成
30 年 1 月 31 日提出
玉川大学大学院脳情報研究科
脳情報専攻
学籍番号
102710012
范 宏玮 (Fan Hongwei)
Different Reward Processing in the
Primate Prefrontal Cortex and Striatum
INTRODUCTION ... 3
MATERIALS AND METHODS ... 5
SUBJECTS ... 5
TASK ... 6
Sequential paired-association task ... 6
Reward instruction trials ... 7
Reward instructed sequential paired-association task with old stimuli ... 9
Training of new stimuli pairings ... 9
Reward instructed sequential paired-association task with new stimuli ... 10
DATA ACQUISITION ... 10
The recording sites in the LPFC and striatum ... 11
DATA ANALYSIS ... 12
Definition of stimulus neurons, reward neurons and stimulus-reward neurons ... 12
Reward index ... 14
Selection and classification of neurons ... 14
Visually evoked response latency ... 15
Inter-spike interval (ISI) distribution ... 15
Definition of early cue period and late cue period ... 15
Population peri-stimulus histograms ... 16
RESULTS ... 16
BEHAVIORAL RESULTS ... 16
NEURAL DATABASE ... 19
REWARD NEURONS IN THE LPFC AND STRIATUM ... 25
REWARD-MODULATED EFFECTS FOR OLD STIMULI AND NEW STIMULI IN THE LPFC AND STRIATUM ... 33
STIMULUS-REWARD NEURONS IN THE LPFC AND STRIATUM ... 35
IDENTIFICATION OF BROAD-SPIKE AND NARROW-SPIKE NEURONS ... 39
CLASSIFYING BS AND NS NEURONS INTO REWARD AND OTHER NEURONS ... 43
BS AND NSREWARD NEURONS ... 45
DISCUSSION ... 50
INFERENCE AND CATEGORY ... 50
PREFRONTAL BS AND NS REWARD NEURONS ... 54
ACKNOWLEDGEMENTS ... 57
Introduction
Inferences are very important cognitive abilities that generate new information from exciting experiences or knowledge. Principally, inferences can be classified as deduction, induction, and abduction (an inferring process that seeks a reason to explain an observed phenomenon). Studies have been conducted regarding sub types of inferences in diverse species of animals. For instance, males fish (Astatotilapia burtoni) can transitively infer their hieratical relationship (who are stronger/weaker than themselves) by merely observing the other fish’s performance in territorial fights31. Great apes perform disjunctive reasoning8, and New Caledonian crows notice
a potential threat in an abduction way100.
Computationally, Bayesian inference would be used to explain the mechanism of inferences. Bayes’ rule can explain why you are more likely to say somebody has got a cold rather than pneumonia or heartburn when observing his coughing51,101,102.
However, animals’ cognitive abilities are far from Bayesian inference, more data needs to be collected in neuroscience. fMRI experiments55,29,111,104,93 have found lateral,
medial , or orbital prefrontal cortex and hippocampus were related to inferences, however, due to fMRI’s low temporal and spatial resolution we don’t know how exactly neurons in the brain makes inferences possible. The purpose of this study is to reveal the mechanisms in which single neurons are involved in a task that required inferences and what kind of information a neuron could generate to complete such task. Accordingly, we employed single-unit recording and chose a subtype of deductive inferences named transitive inference, i.e., if A is B and B is C, then A is C, to explore the mechanism of inferences. Transitive inference task was initially introduced into experiments by Piaget to test the reasoning ability of the child77. Later, transitive
inference paradigm was applied on pigeons, jays, chimpanzees, as well as humans107,6,80,34,4. Behaviorally the paradigm of transitive inference and higher order
conditioning are almost identical, so from the perspective of behaviorism, one would think the process of transitive inferences is the same as that of higher ordering conditioning denying the possibility that monkeys could perform inferences in their minds. However, conditioning could only describe the relation between stimuli and responses on behavioral level, and it’s not a theory explaining the neural basis of inferences84,24,17.
We designed a transitive inference task so as to observe how monkeys perform inference in their brain. In our task, we use two sets of three stimuli, one is A1, B1 and C1, the other is A2, B2 and C2. Stimuli in each set are linked together, i.e., A1→ B1→C1, A2→B2→C2. For example, the monkeys are required to select B1 rather
than B2 when A1 is shown. Since animals are sensitive to the amount of reward, they prefer larger rewards rather than smaller rewards15, we used reward of juice as an
indicator to find out if the monkeys could infer the reward by given a clue of stimulus A1 or A2. Specifically, we taught the monkeys that C1 was linked with a reward and C2 was not, but sometimes we reversed this reward contingency so that C1 was not rewarded and C2 was rewarded. The monkeys could infer that A1 would be rewarded if C1 had been linked with a reward. If we have altered the reward to be linked with C2 indicating C1 was not rewarded and taught this information to the monkeys, then they could infer that A1 would not be rewarded. So, the process of inference can be replaced into a reward prediction process that is easier to observe related neural signal.
The prefrontal cortex (PFC) encodes different types of abstract rules which reflect the structure or the meaning of the external world, e.g., matching or no-matching rules; cats or dogs; go or no-go; “greater than” or “less than”112,108,27. The PFC cortex is
also goal-directed, and can flexibly represent relevant information which is necessary to complete tasks63. Further, the PFC can generalize an acquired rule to new
environments to resolve novel problems19. Therefore, the PFC should play an
important role in inferences which require such higher cognitive abilities to predict reward outcomes. On the other hand, in addition to the PFC, the striatum is also involved in reward prediction processes110,38,85,70,92. Anatomically, the PFC and the
striatum are tightly connected1,117. The lateral PFC (LPFC) has two types of
connections with the striatum: a focal projection and a diffuse projection25,32. In the
focal projection, LPFC projects primarily to the head of the caudate and part of the rostral putamen. In the diffuse projection, clusters of terminal fibers from the LPFC are widely distributed throughout the striatum. The anatomical data suggest that there are dense convergent and divergent connections from the LPFC to the striatum1,117,32.
However, the striatum is functionally deemed to have a different mechanism when predicting reward outcomes. The striatum learns action values directly by trial and error, without building explicit models of the environment and task (i.e. “model-free learning”)16,43. For example, the striatum uses temporal-difference learning to guide
behavior in order to maximize future reward by simply reinforcing successful actions67. On the other hand, the PFC has been shown to play an important role in
model-based learning16,88,74, such as in the encoding of abstract rules112,108,27, in
planning behaviors89,87, and in dynamic decision-making71,5.
On the basis of these observations, we hypothesized that while the LPFC neurons were involved in a reward inference process that predicted reward value based on knowledge of the causal structure of the task, the striatal neurons predicted reward
value through direct learning. To reveal how these two regions may have disparate strategies in reward prediction, we recorded single-unit activity from the LPFC and striatum of monkeys performing a sequential paired-association task under an asymmetric reward schedule75. Although neurons in both regions predicted reward
outcomes immediately after the first cue of A1 or A2, we found only neurons in LPFC, rather than those in the striatum, predicted reward outcomes in trials when inference was required.
Furthermore, neurons in the LPFC can be classified into two types: pyramidal cells and interneurons. Intracellular recordings have reported that pyramidal cells had broader spike waveforms than interneurons61. Thus we classified the recorded
neurons in these two groups based on the waveforms obtained in extracellular recordings, and associated each type of neurons with differential functions in the behavioral tasks3,44,41,103. These two types of neurons may differ in morphology,
neurotransmitter types, and electrophysiological properties12,61,116. It has been
reported that putative pyramidal cells and interneurons in the LPFC may have distinct functional roles in higher-order cognitive functions78,39,40. So, as we have
found that prefrontal neurons could infer the reward outcomes in our task, we asked two questions: 1) Whether do both putative pyramidal cells and interneurons encode reward information in the PFC, and 2) If the two classes of neurons encode reward information, what type of reward information do each type represent? We therefore analyzed distinct functional property of prefrontal neurons in our task separately depending on the types of neurons (pyramidal cells and interneurons) judged by spike shapes.
Materials and Methods
Subjects
Totally four male Japanese monkeys (Macaca fuscata) served as subjects in this study (Hop, 7.5kg, Tap, 6.5kg, Tom, 8.9kg and Zep, 8.5kg). We implanted a head-holder and two recording chambers (one in each hemisphere) for each monkey under aseptic techniques with ketamine (4.6–6.0 mg/kg by intramuscular injection) and sodium pentobarbital (Nembutal, 4.5–6.0 mg/kg by intravenous injection) anesthesia. The size of the chamber was 40 mm (length, anterior-posterior) × 30 mm (width, lateral-medial), and each was implanted with its center located at around the end of the principal sulcus, which allowed us to record neural activity in both the
LPFC and striatum simultaneously from the same chamber. All surgical and experimental protocols were approved by the Animal Care and Use Committees (H26-42) at Tamagawa University and were in accordance with the National Institutes of Health’s Guide for Care and Use of Laboratory Animals.
During each experimental session, the monkeys were seated in a primate chair (with their head fixed) inside a completely enclosed sound-attenuated and electrically shielded room. A 21-inch CRT display (FE220, NEC, Japan) with 60Hz refresh rate was set at a distance of 60.0 cm in front of the monkey for the presentation of visual stimuli. Eye movements were monitored by the Eyelink2 system (SR Research Ltd, Mississauga, Canada) with 500 Hz sample rate. All stimulus presentation and behavioral procedures were controlled by the TEMPO system (Reflective Computing, USA).
Task
Sequential paired-association task
In this study, the monkeys were required to learn two associative sequences (Fig. 1A76) in a sequential paired-association task (Fig. 1B76). Six discriminable icons
were used as visual cues, counterbalanced across three subjects (a question mark and a sketch of tower was denoted as A1 and A2; red and green patches as B1 and B2; a cross and a circle as C1 and C2). The two correct sequential associations were: A1àB1àC1 and A2àB2àC2.
Firstly, we trained the monkeys to learn the association between A1 and B1, and the association between A2 and B2. After showing the monkeys A1 or A2 at the center of the monitor, B1 and B2 were displayed on the monitor simultaneously. If the monkeys selected the correct answer (i.e., B1 to A1, and B2 to A2), they would get a drop of juice as the reward. By trial and error the monkeys successfully acquired such associations. Secondly, by a same process we trained the monkeys to learn the association between B1 and C1, and the association between B2 and C2. At last, we combine the three stimuli of each set in one trial and trained the monkeys to do a two-step selection (e.g., select B1 or B2 after seeing A1 or A2, then in the same trial select C1 or C2 if the previous selection is correct).
Particularly, each sequential paired-association trial (SPAT, Fig. 1B76) started
with the onset of a white fixation spot (0.21° of visual angle) presented at the center of the monitor. The monkeys had to fixate on the spot for a random duration (800– 1,200ms) within a virtual fixation window (3° × 3°). Subsequently the first stimulus
cue, for example A1, was presented for 400ms at the center of the monitor. After a variable delay period (700–1,200ms) the fixation spot disappeared, and at the same time the second cues, B1 and B2, were presented pseudo-randomly (using a modified Gellerman sequence) at the left and right positions to the center on the CRT (6° of visual angle from center). If the subject made a saccade to the target cue (e.g. B1); this was denoted as the first correct choice. Immediately after the correct first choice, the distracter (e.g., B2) disappeared, and the monkeys continued fixating on the target cue (B1) for another 600ms. After the disappearance of the target cue (B1) the third cues, C1 and C2, were simultaneously displayed pseudo-randomly to the left and right of where the target cue (B1) had been shown (5° of visual angle from the central position of B1). This instructed the monkeys to make a further saccadic eye movement to the correct target cue (e.g., C1) in the second choice. After two correct choices, the monkey received a drop of water as reward and an auditory tone of 1kHz at the end of the trial.
The saccade was judged to be correct if the eye position stayed at least 200ms within a virtual window (3° × 3° of visual angle) centered on the position of the target stimulus. The monkeys had to keep its fixation inside the virtual fixation window during the fixation, cue presentation, and delay periods. If the monkeys moved its fixation out of this window the trial was rejected as a fixation break. When the monkeys made a fixation break or an erroneous choice, the trial was aborted, and a high tone of 4kHz indicated an error. Then, after a longer inter-trial interval (ITI) (6s, the normal ITI after a correct trial was 3s), the same trial was repeated until the monkeys were able to complete it correctly. The repeated trials after error were referred to as correction trials. Through the SPAT training the monkeys learned the two correct associative sequences: A1àB1àC1 and A2àB2àC2. The monkeys also learned another two sequences: the BCA sequence (B1àC1àA1 and B2àC2àA2) and the CAB sequence (C1àA1àB1 and C2àA2àB2), however these two sequences were not used in current study.
Reward instruction trials
When the monkeys acquired the two sequential associations, we introduced an asymmetric reward schedule using reward instruction trials. During reward instruction trials, the monkeys were instructed as to which stimulus (C1 or C2) was paired with a large reward (Fig. 1D76). This was done by a visually guided saccade
task, in which, after fixation, C1 or C2 was presented (skipping the A1, A2, and B1, B2 steps) and the monkeys had to saccade to whichever appeared. The different visual stimuli (C1 and C2) were paired with different amounts of water. In one case C1 was
followed by a large reward (0.4 ml) and C2 was paired with a small reward (0.1 ml); in the other case, C1 was followed by a small reward and C2 by a large reward.
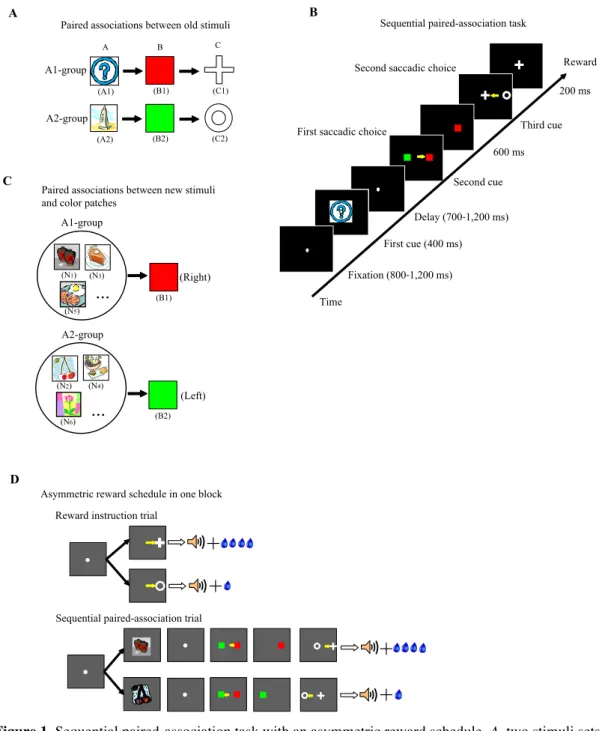
Figure 1. Sequential paired-association task with an asymmetric reward schedule. A, two stimuli sets
(A1-B1- C1 and A2- B2-C2) were learned by the monkeys. These six icons were termed “old stimuli.” B, Time events in the sequential paired-association trial. The monkeys made a choice by a saccadic eye movement, as indicated by small yellow arrows. C, examples of new stimuli associated with two color patches (B1 and B2). The monkeys learned each pair of new stimuli (i.e., NS1 and NS2) with B1 or B2 in a delayed matching-to-sample task with a symmetric reward schedule. D, an asymmetric reward schedule was used in each block. There were two types of trials in one block: reward instruction trials and SPATs. In the SPATs, the new stimulus was presented as the first cue. The yellow arrows indicate correct choices with saccadic eye movements and are not actually shown to the monkeys. (76)
Fig. 1 A C A1-group A2-group A B C (A1) (B1) (C1) (A2) (B2) (C2)
Paired associations between old stimuli
Sequential paired-association trial Reward instruction trial
D (Right) (Left) (N1) (N2) (B1) (B2) Paired associations between new stimuli and color patches
Asymmetric reward schedule in one block A1-group A2-group (N3) (N4) (N5) (N6)
...
...
+
+
+
+
Sequential paired-association task
B Fixation (800-1,200 ms) First cue (400 ms) 600 ms 200 ms Second cue Third cue Second saccadic choice
Delay (700-1,200 ms)
Time
Reward
Reward
instructed
sequential
paired-association task with old stimuli
After having fully acquired how to complete both the reward instruction and the sequential paired-association tasks, the monkeys were required to perform a combination of the two subtasks in one block. At the beginning of each block, three or four reward instruction trials were presented for the monkeys indicating which target (C1 or C2) was paired with the large reward and which with the small reward. Reward instruction trials were then followed by the SPATs (8–15 trials). The procedure of the SPATs was the same as described above, except that the amount of reward was asymmetric. The asymmetric reward rule was consistent between the two types of trials within one block. E.g. in a given block, if C1 was paired with the large reward and C2 with the small reward in reward instruction trials, then the A1àB1àC1 sequence would be followed by the large reward and the A2àB2àC2 sequence would be paired with the small reward in the SPATs. The asymmetric reward schedule was pseudo-randomly assigned between blocks.
Training of new stimuli pairings
The monkeys were trained to learn new stimulus associations in a delayed matching-to-sample task with a symmetric reward schedule. The new stimulus was learned to be associated with one of the two color patches (B1 or B2). In this task, the color patches were always presented on the same side of the screen (e.g. B1 on left, B2 on right) in order to speed learning. We downloaded 400 icons from the Internet, classified them into 200 new pairs randomly, and examined each pair visually to avoid reuse. These newly learned stimuli shall hereby be referred to as “new stimuli”, while the stimuli A1, B1, C1, A2, B2 and C2 shall hereby be referred to as “old stimuli”. 3 monkeys (Hop, Tom and Tap) were trained with new stimuli.
After learning one pair of new stimuli, the monkeys moved on to learn another pair of new stimuli, and so on. For this training, we assigned one daily session each week to train the monkeys to learn 4-5 pairs of associations between the new stimuli and B1 and B2 without recording. The newly learned stimuli were classified into two groups according to the old stimuli that they were associated with. The new stimuli associated with B1 were classified into the A1-group and the new stimuli associated with B2 were classified into the A2-group. Up to this point, the monkeys had received no direct associations between new stimuli and C1 or C2, and also no information
about the asymmetric reward schedule with respect to the new stimuli.
Reward
instructed
sequential
paired-association task with new stimuli
After having fully acquired the new associations, the monkeys performed the reward instructed sequential paired-association task with new stimuli (Fig. 1D76).
This was identical to the reward instructed SPATs with old stimuli except that in these SPATs a newly learned stimulus was presented as the first cue instead of the old stimulus (A1 or A2), and the second cues, B1 and B2 (the two-color patches), were always shown in the same fixed positions as during training.
Data acquisition
Action potentials of single neurons were recorded extracellularly with tungsten electrodes (FHC, Bowdoinham, ME, 0.8–1.5MΩ) from the LPFCs of the monkeys (Fig. 376), and the caudate and putamen of the two monkeys (Tap and Tom, Fig. 476).
Usually, two microelectrodes, one into the LPFC and the other into the striatum, were used to record single-unit activity. Each electrode was inserted via a guide tube through a grid system (holes: 0.6 mm wide and 1.0 mm apart from center to center; Nakazawa, Tokyo, Japan) into the cortical surface; then each electrode was advanced into the target position independently by means of the NAN-electrode-drive (NAN-instruments LTD, Israel). The Plexon system (Plexon Inc, Texas, USA) was used to amplify neuronal action potentials and discriminate individual spike waveforms online.
The system then saved the spike timing and selected waveforms (in an 800 µs window) on the Plexon PC together with the timing of task events. The eye movement data and spiking time were also saved on the behavioral control PC (TEMPO client PC). In the caudate and putamen, we recorded the spike activity of presumed projection neurons that showed phasic response to task events and had low spontaneous activity35, but not those of presumed interneurons that showed irregular
tonic discharge2.
During recording sessions, once a neuron was isolated, its properties were tested in the reward instructed SPAT with the old stimuli (and here, the positions of the second cues B1 and B2 were pseudo-randomized). The first cue was A1 or A2. If the neuron’s activity was found to be modulated by the amount of reward, then we continued recording the activity of that neuron while the monkey performed the
reward instructed SPAT with the new stimuli (the positions of the second cues B1 and B2 being fixed). Each pair of new stimuli was tested with only one neuron. A pair of new stimuli was repeatedly tested for at least two blocks for each neuron recorded.
The advantage of the above recording method is that it reduced the number of new stimuli associations which the monkeys had to learn in total (It’s quite hard for the monkeys to learn the new stimuli, and so the less the monkeys had to learn, the less time and effort required). The disadvantage was that we might have neglected neurons that would show reward-modulated activity to the new stimuli, but not to the old stimuli. However, in this study we were interested in studying neurons that were related to value coding. These value-coding neurons inherently must respond to the value of both old and new stimuli. The type of neurons which we potentially neglected to record could not be called “value-coding neurons” per se, as they would respond to only the value of the new stimuli, but not the value of the old stimuli. This type of neuron, if it exists, may be more related to “value learning”, a concept we did not aim to address in the current experiment.
The recording sites in the LPFC and striatum
Fig. 376 and Fig. 476 show the recorded tracks and distributions of reward neuronsin the LPFC (both hemispheres for Tap, the left hemisphere for Hop, and the right hemisphere for Tom), and in the striatum (two hemispheres for Tap, and the right hemisphere for Tom), respectively. Confirmation of recording locations was based on magnetic resonance imaging (Siemens MRI, 3-T Trio,A Tim MRI scanner). To reconstruct the recording sites based on MR images, we took MR images of the monkeys’ brain with inserted markers. These markers were 21 small silicone tubes that had been filled with phantom liquid and then inserted into the recording grid. These tubes mimicked the recording electrodes and showed higher contrast in MR images (as indicated by the three short gray lines in Fig. 4A76 and Fig. 4D76). The
three long white lines in Fig. 4A76 and Fig. 4D76 were extensions of those tube lines.
On the basis of the position of the first recorded neuron in the cortex, and the position of the first neuron recorded in the striatum, we were able to map neurons in the striatum.
In the prefrontal cortex, we mainly recorded single units from the ventro-lateral area (VLPFC, beneath the principle sulcus). Reward neurons tended to be dispersed widely in the VLPFC, i.e., there was no distinct spatial distribution. In the striatum, we predominately recorded neural activity from the anterior part, anterior to the anterior commissure (AC), including the caudate nucleus and the putamen. This area usually is referred to as the association striatum. Several studies involving monkeys
have reported that neurons in this association striatum are related to learning36,66,113.
Data analysis
Definition of stimulus neurons, reward neurons
and stimulus-reward neurons
Off-line analysis was carried out using custom-made Matlab programs on a PC. To calculate the behavioral performance (correct rate) of the first choice as a function of SPAT order in blocks after reward instruction, the data were averaged across all blocks performed by the monkeys. Using the correction method, we excluded the data in repeated trials (the trials directly after error trials) to calculate the correct rate. We also calculated the behavioral performance in response to new stimuli presented for the first time in SPAT blocks immediately after reward instruction trials. Trials in each of the first SPAT blocks were classified into two sequences: the first trial-sequence and the second trial-sequence, which shall be described below. These sequences shall hereby be referred to as N1 and N2 (standing for the first
trial-sequence and the second trial-sequence, respectively). Additionally, when we wish to refer to particular trials within a trial sequence we shall put the trial number on the end, for example N1,1 stands for trial 1 in the first trial-sequence, N1,2 stands
for trial 2 in the first trial-sequence, N2,1 stands for trial 1 in the second trial-sequence,
etc.
Each first trial-sequence consisted of the very first SPAT within the block (N1,1),
and subsequent trials within this block in which the same new stimulus was presented (N1,2, N1,3...etc.; please note that these are not necessarily the second and
third trials in the block, but rather the second and third trials in which this stimulus was presented within the block). The second trial-sequence included trials in which the alternative new stimulus (N2,1, N2,2 N2,3...etc.; see the schematic block in the
bottom panel in Fig. 276) was presented as the first cue.
Overall, for each pair of new stimuli, there was one first trial-sequence and one second trial-sequence. To calculate the behavioral performance in response to the new stimuli in the first trial-sequence, we first determined the accuracy in each trial in each first trial-sequence, then averaged the correct rates across all first trial-sequences separately for the large reward condition and the small reward condition (see Fig. 276). The behavioral performance in response to the new stimuli in
For the analysis of neuronal data, we used only correct trials. In this study, we concentrated on neuronal activity in two time epochs: the first cue period and the early delay period. The first cue period occurred from 100ms to 500ms after the first cue onset, and the early delay period occurred from 500ms to 900ms after the first cue onset.
The activity of each neuron was analyzed by a two-way ANOVA, with old stimuli (A1 vs. A2) and reward (large vs. small) as the main factors in the first cue period and in the early delay period, respectively. Depending on the results of the ANOVA (P<0.01), neurons were classified into three types: stimulus neurons, reward neurons and stimulus-reward neurons. Stimulus neurons showed a significant main effect of stimuli (P<0.01), but no a main effect of reward and no interaction between the two factors. Therefore, stimulus neurons only discriminated the visual properties of stimuli, regardless of reward conditions. Neurons that only showed a significant main effect of reward (P<0.01) were classified into reward type. This type of neurons predicted whether the amount of reward associated with a stimulus would be large or small, regardless of which stimulus was presented. Stimulus-reward neurons showed a significant interaction between stimuli and reward and/or significant main effects of both stimulus and reward. Some neurons showed reward-modulated activity in both the first cue and early delay periods. If a neuron was identified as reward type in the first cue period, it was excluded from the population in the early delay period so that the population neurons in the two periods would not overlap.
Next the activity of the neurons recorded with new stimuli was further analyzed by two-way ANOVAs (new stimulus × reward) in the first cue and early delay periods. Our aim was to examine whether or not reward neurons defined by old stimuli would keep the same response properties for new stimuli. In order to examine the interaction between stimulus familiarity and reward, we performed a two-way ANOVA using the activity of each neuron that had been recorded for both old and new stimuli. The two main factors were stimulus familiarity (old vs. new) and reward amount (large vs. small).
The spike density function of single neurons was generated by averaging activities in every 1ms-bin across trials, and then smoothed by a Gaussian envelope with σ=30ms. To generate the population histogram, we first calculated the firing rate of each trial in every 1ms bin. We then subtracted from this, the mean firing rate from the fixation period (500ms epoch prior to the first cue onset). Finally, we averaged the normalized firing rate in every bin across all trials for each neuron and across population neurons, and finally smoothed this data using a Gaussian envelope with σ=30ms.
first determined its activity responding to the new stimuli in each trial in the first and second trial-sequences, then normalized the activities by the maximal and minimal responses to the new stimuli in all trials. The normalized activity in each trial was averaged across the first trial-sequences (or across the second trial-sequences) separately for the preferred reward condition and the non-preferred reward conditions.
Reward index
To evaluate the strength of reward modulation of reward neurons, we calculated a normalized reward index for each neuron using the following equation:
Reward Index = (Rpref - Rnon-pref)/( Rpref + Rnon-pref)
where Rpref indicates the activity in the preferred reward condition, and Rnon-pref in
the non-preferred reward condition. For each neuron, this reward index was calculated for the old and new stimuli, respectively. All trials across blocks were included to calculate the reward index for the old stimuli in the LPFC and the striatum. To compute the reward index for the new stimuli, we again included all trials across blocks in the LPFC. However, we excluded the first trials in which the new stimuli were presented for the first time as the first cue in SPATs (i.e. N1,1 and
N2,1) in the caudate and putamen.
Selection and classification of neurons
Neurons in the LPFC were classified into putative pyramidal cells and interneurons based on the following criteria in further analysis: (1) each neuron was clearly isolated from the other neurons and from multiunit activity based on clear clustering in the principle components of waveforms (Offline Sorter, Plexon Inc.). (2) Each unit showed a clear spike refractory period. (3) The waveforms of each neuron exhibited a downward voltage deflecting (a trough, negative related to baseline) followed by an upward voltage deflecting with a clear peak. (4) LPFC neurons with deviated waveforms or saturated amplitude waveforms were excluded from analysis.
A function of k-means classifier (k=2, squared Euclidean distance) in Matlab was used to classify neurons into two groups based on the shape of averaged spike waveforms. In order to reduce possible effects of different amplitude and timings of minimum of waveforms, we normalized the waveforms of each neuron by the differences between their peak and trough values and aligned them by their minimum. The k-means algorithm (k=2) aims to partition the spike waveforms into 2 clusters in which each waveform belongs to the cluster with the nearest mean
waveform, so as to minimize the variance of waveforms within the cluster56. The
k-means algorithm does not examine any statistical significance among k clusters or does not necessarily find global optimal clusters. Therefore, we calculated waveform durations (between the trough and peak in the averaged waveform) to further confirm that the classification by k-means (k=2) was appropriate. The advantage of k-means (k=2) classifier is that this algorithm objectively classifies spike waveforms into two clusters on the basis of their shapes, without the requirement of a pre-determined border between the two clusters. We referred to the neurons that had the smaller mean spike width as narrow-spike (NS) neurons, and to the neurons that had the larger mean spike width as broad-spike (BS) neurons.
Visually evoked response latency
To determine the visually evoked response latency for each NS or BS neuron, its averaged spike density histogram was derived with 1ms resolution, and smoothed by a Gaussian envelope with σ=15ms for all trials. We calculated the mean and standard deviation (SD) of firing rates during a 200ms-time-window prior to the first cue onset across all trials for each neuron, and set the threshold at the mean of baseline firing rates plus 3 SDs. If the neuronal activity exceeded the threshold for three consecutive time bins after the first cue onset, the response latency was defined as the duration from the first cue onset to the first of these time bins. If a neuron was unable to reach this criterion, it was excluded from the latency count.
Inter-spike interval (ISI) distribution
We used the FieldTrip open source Matlab toolbox73 to calculate the ISI
distribution and local variation for each NS or BS neuron. The ISI distribution of each neuron was fitted by a Gamma distribution and its parameters such as the peak mode were estimated.
Definition of early cue period and late cue period
We observed both the BS and NS Reward neurons showed visually evoked response to the presentation of the first cue in the two reward conditions (see Fig 14A22). This visually evoked response would take strong effect on comparison betweenthe baseline activity and the cue period activity. In the current task design, we were unable to separate the evoked response from the reward-related signal. To avoid this
effect, the cue period was divided into two time epochs: the early cue period (100 – 300ms from the first cue onset) and the late cue period (300 – 500ms from the first cue onset). There might be more visually evoked activities in the early cue period, and less in the late cue period. We compared the activity in the fixation period with the activity in the late cue period to demonstrate the reward information represented in each Reward neurons. The activity in the delay period should not include the visually evoked response, and it was compared directly with the baseline activity.
Population peri-stimulus histograms
To generate the population histogram, we first calculated the firing rate in every 1ms bin within each trial, then averaged the firing rate in every bin across all trials for each neuron and across population neurons, and finally smoothed the data using a Gaussian envelope with σ=30ms.
Results
Three Japanese monkeys (Hop, Tap and Tom) were firstly required to perform the reward instructed sequential paired-association task with old stimuli (the first cue stimuli: A1 and A2. see Materials and Methods). In this task, the monkeys extensively experienced the stimulus-reward reversals block-by-block. Subsequently the monkeys were required to perform the task but with the new stimulus pairs which had not been previously presented with an asymmetrical reward schedule. In total, we tested 112 pairs of the new stimuli for Hop, 214 for Tap, and 136 for Tom. This allowed us to analyze the behavior and neuronal activity in the sequential paired-association trials (SPATs) in which a new stimulus was presented for the very first time.
Behavioral results
We found that the behavior of the three monkeys was systematically influenced by the amount of reward. The monkeys showed significantly higher correct rates on the first choice in the larger reward trials for both the old and new stimuli than in the smaller reward trials (Mann-Whitney U test, P<0.01).
We further examined the correct choice rates in response to the initial presentation of the new stimuli in the SPATs after reward instruction of C1 and C2
(Fig. 276). The SPATs in each of these blocks were separated into the first and second
trial-sequences (see Materials and Methods).
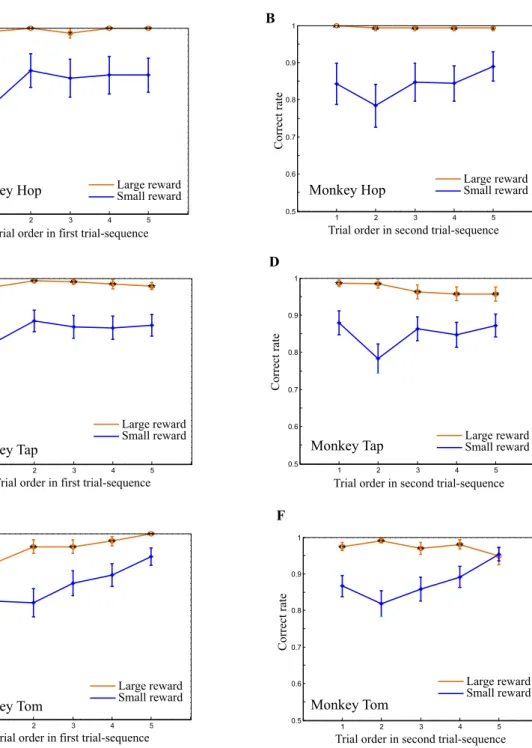
We focused our analysis on the first-choice performance in the first SPATs in the first and second trial-sequences (i.e. the first choices in N1,1 and N2,1). In these specific
trials, the new stimuli were presented for the first time in the SPATs, and therefore the monkeys didn’t have any opportunity to directly pair the new stimuli with a particular (large or small) amount of reward. Nevertheless, the monkeys showed significantly higher correct rates in the larger reward condition from the first trials in both trial-sequences (Fig. 276, Mann-Whitney U test, **: P<0.01, *: P<0.05),
suggesting the possibility that the monkeys could correctly infer the reward. Behaviorally, however, we could not yet easily determine whether the monkeys actually predicted the amount of reward based on the first cues (the new stimuli), or if instead, they were simply relying on associations with the second cues (B1 and B2; old stimuli) to predict the reward.
Evidence for reward inference should ideally be sought in the neuronal data at the time of the first cue presentation, that is, before the monkeys can rely on a second cue so as to recall an already-established reward association (e.g., B1àC1àReward).
Figure 2. The effect of reward amount on the behavioral performance of the three monkeys. A, B, The
performance of monkey Hop showing the accuracy of the first choice (selection of B1 or B2 on the basis of new stimuli) in SPATs as a function of SPAT order in the first trial sequence (A), and the second trial sequence (B). C, D, Performance of monkey Tap in the first trial sequence (C) and in the second trial sequence (D). E, F, Performance of monkey Tom in the first trial sequence (E) and in the second trial sequence (F). (76)
Trial order in first trial-sequence
Correct rate
Trial order in second trial-sequence
Correct rate
Monkey Hop
Trial order in first trial-sequence
Correct rate
Trial order in second trial-sequence
Correct rate
Monkey Tap
Trial order in first trial-sequence
Correct rate
Trial order in second trial-sequence
Correct rate Monkey Tom A B C D E F 1 2 3 4 5 0.5 0.6 0.7 0.8 0.9 1 ** ** * ** ** 1 2 3 4 5 0.5 0.6 0.7 0.8 0.9 1 ** ** ** ** * 1 2 3 4 5 0.5 0.6 0.7 0.8 0.9 1 ** ** ** ** ** 1 2 3 4 5 0.5 0.6 0.7 0.8 0.9 1 ** ** ** ** ** 1 2 3 4 5 0.5 0.6 0.7 0.8 0.9 1 ** ** ** ** ** 1 2 3 4 5 0.5 0.6 0.7 0.8 0.9 1 ** ** ** ** Monkey Hop Monkey Tap Monkey Tom Large reward Small reward Large reward Small reward Large reward
Small reward Large reward
Small reward Large reward Small reward Large reward Small reward 1 2 3 N1 N1 N2 N1 N2 N1 N1 N1 N2 N2
First trial-sequence Second trial-sequence
Reward instruction trials Sequential paied-association trials with new stimuli
...
...
...
Trials in one block
N2
Neural database
Accordingly, we recorded the activity of 546 neurons from the LPFCs of the three monkeys (Hop: 152; Tap: 217; Tom: 177, see Fig. 376), and the activity of 366 neurons
from the caudate and putamen of two of the monkeys (Tap: caudate: 95, putamen: 160; Tom: caudate: 73, putamen: 38; see Fig. 476) while they performed the
reward-instructed sequential paired-association task with the old stimuli (the first cues: A1 and A2). The activity of each neuron was analyzed using a two-way ANOVA: (stimulus (A1 or A2) × reward (large or small), P < 0.01) in the first cue and early delay periods that were prior to the second cues. Depending on the ANOVA results, the neurons were classified into three types: stimulus neurons, reward neurons and stimulus-reward neurons. Table 176, Table 276 and Table 376 show the number of each
type of neurons in the LPFC, the caudate, and the putamen, respectively. In this part, we mainly focused on the reward neurons in the LPFC and striatum to investigate how these neurons processed reward information for the new stimuli, and additionally we looked at the activity of stimulus-reward neurons in the LPFC representing categorical information of the stimuli.
In the LPFC we found 92 reward neurons in the first cue period and 63 reward neurons in the early delay period. There were 61 caudate and 52 putamen reward neurons in the first cue period and 16 caudate and 28 putamen reward neurons in the early delay period. The proportion of reward neurons in the LPFC was significantly lower than those in the caudate and putamen (28.4% (155/546) in the LPFC; 45.8% (77/168) in the caudate, and 40.4% (80/198) in the putamen, χ2–test,
Chi-square=21.682, df=2, P<0.01). The ratio of reward neurons did not differ significantly between the caudate and putamen (χ2–test, Chi-square=1.094, df=1,
P=0.296). About half (53.5% (83/155)) of the LPFC reward neurons and three-quarters of the caudate (74% (57/77)) and putamen (77.5% (62/80)) reward neurons showed stronger activity in large vs. small reward trials. The ratio in the LPFC was significantly lower as compared to the ratio in the caudate (χ2–test, Chi-square=9.015,
df=1, P<0.01). For the reward neurons in both the LPFC and striatum, we refer to the reward condition which produced higher activity as the "preferred reward condition" and the other reward condition as the "non-preferred reward condition".
Next, we examined how many neurons showed significant reward effects in both the first cue and early delay periods. Of the 92 LPFC neurons that showed reward-modulated activities to the old stimuli in the first cue period, 42 (45.7%) of them also showed reward-modulated activities in the early delay period. Of the 61 caudate neurons that showed reward-modulated activity to the old stimuli in the first
cue period, 39 (63.9%) of them also showed reward-modulated activities in the early delay period. Additionally, of the 52 putamen neurons that showed reward-modulated activity to the old stimuli in the first cue period, 27 (51.9%) of them also showed reward-modulated activities in the early delay period.
In this study, we also recorded the neural activity of these reward neurons with the new stimuli in the LPFC, the caudate and putamen. In the LPFC, 106 out of 155 reward neurons were recorded for both the old and new stimuli (see Table 176). In the
striatum, 100 (50 neurons from the caudate and 50 neurons from the putamen) out of 157 reward neurons were tested with the new stimuli (see Table 276 and 376). Each of
them was tested with at least one pair of the new stimuli (median number of pairs: 2; range: 1–6).
To examine how familiarity of stimuli affected reward information encoded by these reward neurons, the activity of each of them was analyzed using a two-way ANOAV with two factors (stimulus familiarity (old vs. new) and reward (large vs. small)). Of the 106 LPFC reward neurons, 38 (35.8%) neurons showed only a significant main effect of reward (P<0.01), and neither significant main effect of familiarity nor any interaction between the two factors (P>0.01), indicating that these neurons encoded reward information regardless of stimulus familiarity. About 38.7% (41/106) of LPFC reward neurons had significant main effects of reward and stimulus familiarity (P<0.01), but no significant interaction between them, indicating that these neurons represented the familiarity information and the reward information of stimuli independently. We found 19 (17.9%) LPFC neurons showed a significant interaction between the two factors of reward and stimulus familiarity (P<0.01). Additionally, four neurons proved only selective to old vs. new stimuli, and another four neurons had no effects of reward or stimulus familiarity and showed no interaction.
Of the 50 caudate reward neurons, 16 (32%) neurons showed a significant main effect of reward, with no significant main effect of stimulus familiarity and no interaction between the two factors. There were 17 (34%) neurons that had significant main effects of reward and familiarity, but displayed no interaction between them. 17 (34%) neurons showed a significant interaction between the two factors.
Of the 50 putamen reward neurons, 27 (54%) neurons showed a significant main effect of reward, with no significant main effect of stimulus familiarity and no interaction between the two factors. There were 12 (24%) neurons that had significant main effects of reward and familiarity, but displayed no interaction between them. 10 (20%) neurons showed a significant interaction between the two factors. One neuron proved only selective to the old vs. new stimulus. We found that the fractions of reward neurons whose activity was modulated by the new stimuli did not differ
significantly in the first cue and early delay periods either in the LPFC (in the first cue period: 40/63 (63.5%), in the early delay period: 25/43 (58.1%), χ2–test,
Chi-square=0.309, df=1, P=0.5785), in the caudate (in the first cue period: 28/41 (68.3%); or in the early delay period: 6/9 (66.7%), χ2–test, Chi-square=0.009, df=1,
P=0.924) or in the putamen (in the first cue period: 19/37 (51.4%); in the early delay period:3/13 (23.1%), χ2–test, Chi-square=3.121, df=1, P = 0.077). When the ratios
within the three areas were compared, the putamen showed a smaller proportion of reward neurons whose activity was sensitive to stimulus familiarity than the LPFC or the caudate did (the putamen: 22/50 (44%), the caudate: 34/50 (68%), the LPFC: 65/106 (61.3%), χ2–test, Chi-square=6.543, df=2, P=0.038). The proportions in the
LPFC and caudate did not differ significantly (χ2–test, Chi-square=0.654, df=1,
P=0.419).
In the LPFC, we found 64 stimulus-reward neurons and 32 stimulus neurons in the first cue period. In the striatum, we found 24 stimulus-reward neurons and 8 stimulus neurons in the first cue period. There were few neurons that were identified as stimulus-reward or stimulus type only in the early delay period (Stimulus-reward: 10 neurons in the LPFC and 7 in the striatum; Stimulus: 7 neurons in the LPFC and 3 in the striatum). We did not analyze these early delay period stimulus-reward neurons and stimulus neurons further for this study because the activity of these neurons was not tested with new stimuli. The proportion of stimulus-reward neurons was higher in the LPFC than in the striatum (64/546 (11.7%) in the LPFC, 24/366 (6.5%) in the striatum; χ2–test, Chi-square=6.703, df=1, P<0.01). About half of
stimulus-reward neurons (35/64 (54.7%)) in the LPFC showed higher activity in large reward trials, and 15/24 (62.5%) of stimulus-reward neurons in the striatum preferred large reward, but these did not differ significantly (χ2–test, Chi-square=0.434, df=1,
results of two-way ANOVA (reward vs trial order) showed that the neural activity to the old stimuli had a significant main effect of reward (p ! 0.001), but no significant effect of trial order (p " 0.3) and no significant interaction between the two factors (p " 0.3). Further post hoc tests with Bonferroni correction revealed that the reward neurons in the three areas showed significantly higher activity in the preferred reward condition than in the non-preferred reward condition (p ! 0.01). However, regional differ-ences in response activity were found when the new stimuli were presented as the first cue. LPFC reward neurons were able to predict the reward values of the new stimuli from the first SPAT after reward instruction in the both first and second trial se-quences (i.e., in both N1,1and N2,1;Fig. 7C,D) despite the fact that
monkeys had never learned the new stimulus–reward contin-gency directly. The two-way ANOVA (reward vs trial order) demonstrated that the neural activity seen inFigure 7, C and D, had a significant main effect of reward (p ! 0.001), but showed neither effect of trial order (p " 0.5) nor interaction (p " 0.4).
Post hoc tests with Bonferroni correction indicated that LPFC
reward neurons had significantly higher activity in the preferred reward condition compared with the nonpreferred reward con-dition from the first SPAT (p ! 0.01).
In contrast to LPFC reward neurons, during the first trial sequence, the reward neurons in the areas of caudate and puta-men did not distinguish the preferred from nonpreferred reward conditions in the first SPAT (i.e., in N1,1trials;Fig. 8C,G). Using
the two-way ANOVA, we were able to show that caudate neural activity (as seen inFig. 8C), had a significant main effect of reward
(p ! 0.001) and a significant interaction between reward and trial order (p # 0.0022), but no significant effect of trial order (p " 0.9). Post hoc tests with Bonferroni correction revealed that cau-date neurons had no reward-modulated activity in the first trials (p " 0.05), but did show significantly differential activity be-tween the two reward conditions from the second trial in the first-trial sequence (i.e., from N1,2trials, p ! 0.01). The activity of
the putamen neurons inFigure 8G showed a significant main
effect of reward (p ! 0.001) and an interaction of reward and trial order (p # 0.0143), but, again, no significant effect of trial order (p " 0.3). A post hoc test with Bonferroni correction revealed that the putamen neurons showed no reward-modulated activity in the first two trials (i.e., in N1,1and N1,2trials; p " 0.05), but that
the differential activity between the two reward conditions grad-ually increased from the third trial onward and reached a signif-icant level in the fourth trial (p ! 0.01).
The same populations of neurons in the caudate and putamen predicted reward information for the new stimuli from the first SPATs in the second trial sequence (i.e., in N2,1trials;Fig. 8D,H),
although the monkeys had never learned the new stimulus–re-ward contingency directly. The results of a two-way ANOVA showed that neural activity (Fig. 8D,H) showed significant main
effects of reward (p ! 0.01), but no effect of trial order (p " 0.3) and no interaction (p " 0.7) in the second trial sequence. A post
hoc test with Bonferroni correction additionally showed that both
caudate and putamen neurons had significantly higher activity in the preferred reward condition as opposed to the nonpreferred reward condition from the first trial in the second-trial sequence. These results suggest that the striatal reward neurons used the new stimulus–reward contingency presented in the first trial se-quence to then be able to predict the reward information for the other stimulus from each pair shown in the second trial sequence. To determine the consistency of neural response patterns among the three monkeys, we calculated the response patterns of the LPFC and striatal reward neurons in the first and second trial sequences separately for each of the animals. The results from individual monkeys were consistent with the population data from the three monkeys in the LPFC and the two monkeys in the caudate and putamen.
These results demonstrated that both LPFC and striatal neu-rons could transfer reward information paired with C1 and C2 to well experienced stimuli (A1 and A2) in SPATs. More impor-tantly, the LPFC neurons that responded to reward value for the old stimuli were also able to infer the reward value of the new
Table 1. Classification of LPFC neurons in the three monkeys
Monkey Recorded neurons
Reward neurons Stimulus-reward neurons Stimulus neuron
First cue period Early delay period First cue period Early delay period First cue period Early delay period
Hop 152 30 (26) 19 (13) 17 (11) 2 (0) 5 (1) 1 (1)
Tap 217 25 (16) 23 (17) 26 (19) 5 (1) 15 (7) 4 (0)
Tom 177 37 (21) 21 (13) 21 (16) 3 (0) 9 (1) 4 (0)
Total 546 92 (63) 63 (43) 64 (46) 10 (1) 29 (9) 9 (1)
Numbers between parentheses indicate the number of neurons tested with new stimuli. Each neuron is assigned to one of the two time periods to avoid double counting (see Materials and Methods).
Table 2. Classification of caudate neurons in the two monkeys
Monkey Recorded neurons
Reward neurons Stimulus-reward neurons Stimulus neuron
First cue period Early delay period First cue period Early delay period First cue period Early delay period
Tap 95 35 (24) 7 (2) 14 (6) 3 (2) 1 (0) 1 (0)
Tom 73 26 (17) 9 (7) 4 (2) 0 (0) 1 (0) 0 (0)
Total 168 61 (41) 16 (9) 18 (8) 3 (2) 2 (0) 1 (0)
Numbers between parentheses indicate the number of neurons tested with new stimuli. Each neuron is assigned to one of the two time periods to avoid double counting (see Materials and Methods).
Table 3. Classification of putamen neurons in the two monkeys
Monkey Recorded neurons
Reward neurons Stimulus-reward neurons Stimulus neuron
First cue period Early delay period First cue period Early delay period First cue period Early delay period
Tap 160 39 (27) 24 (9) 6 (5) 4 (1) 4 (0) 1 (0)
Tom 38 13 (10) 4 (4) 0 (0) 0 (0) 2 (1) 0 (0)
Total 198 52 (37) 28 (13) 6 (5) 4 (1) 6 (1) 1 (1)
Numbers between parentheses indicate the number of neurons tested with new stimuli. Each neuron is assigned to one of the two time periods to avoid double counting (see Materials and Methods).
Figure 3. Anatomical location of recording sites in the LPFC of the monkeys, A-C, Distribution of
recording sites and the distribution of reward neurons in the monkey Tap (A), the monkey Tom (B), and the monkey Hop (C). The empty black circles represent recorded sites at which no reward-related neurons were found. The filled red circles represent recording sites at which reward neurons were found. (76)
Left Hemisphere
Right Hemisphere
Principal sulcus
Arcuate sulcus
Monkey Tap
Monkey Hop
Left Hemisphere
Recorded track
Reward neuron
1 mm
A BRight Hemisphere
Monkey Tom
CArcuate sulcus
Principal sulcus
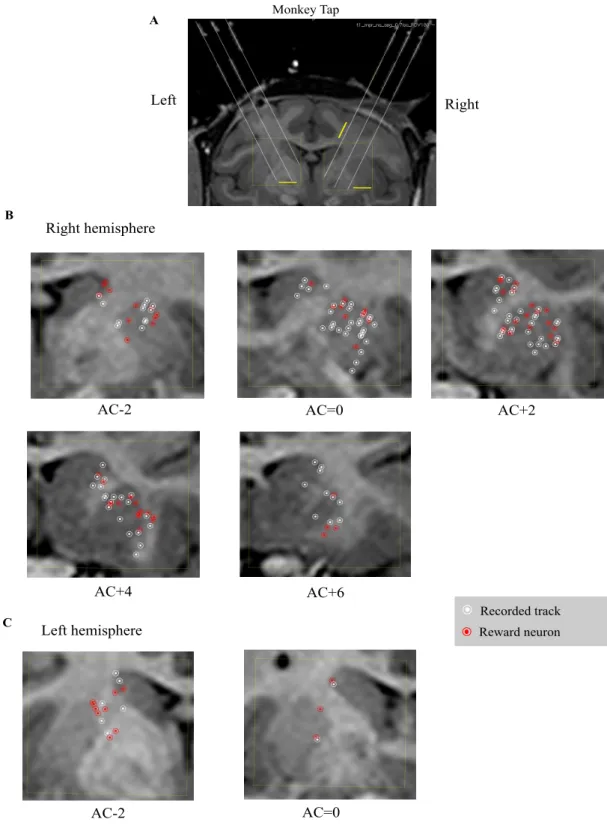
Figure 4. Recording sites in the striatum of the two monkeys (Tap and Tom) plotted on MRI coronal
sections. To reconstruct the recording sites based on MR images, we took MR images of the monkeys’ brains with inserted markers (see Materials and Methods). A, Coronal MR image of Tap where the anterior commissure (AC) 0. The long white lines were extensions of those markers. B, C, Locations of recorded neurons in the right and left hemispheres of Tap, respectively. D, Coronal MR image of Tom where AC 0. The long white lines were extensions of these markers. E, Locations of recorded neurons in the right hemisphere of Tom. White circles represent recorded neurons that showed no
reward-modulated activity. Red circles represent reward neurons. AC indicates the anterior commissure; the sections anterior and posterior to the AC are indicated by plus and minus numbers (distances in mm), respectively. (76) Right Left AC-2 AC=0 Right hemisphere AC+2 AC+4 AC+6 Left hemisphere AC-2 AC=0 Monkey Tap A B C Recorded track Reward neuron 5 mm 5 mm
Reward neurons in the LPFC and striatum
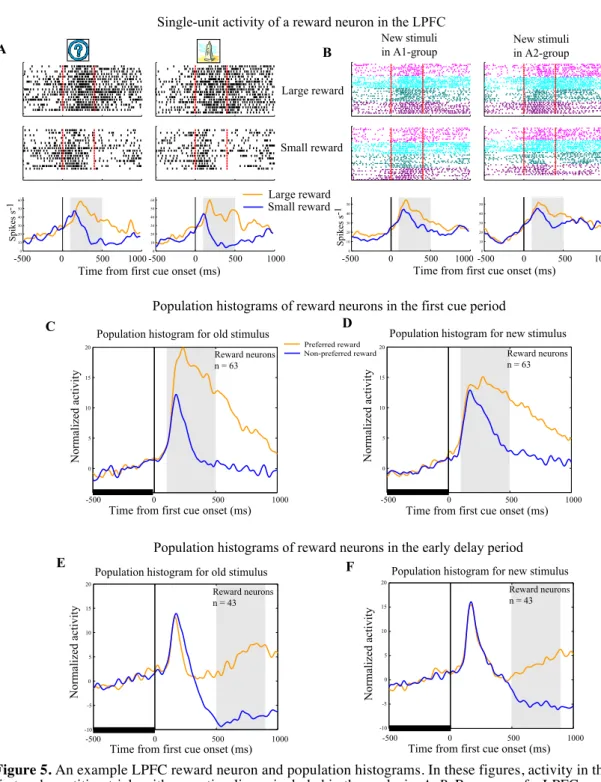
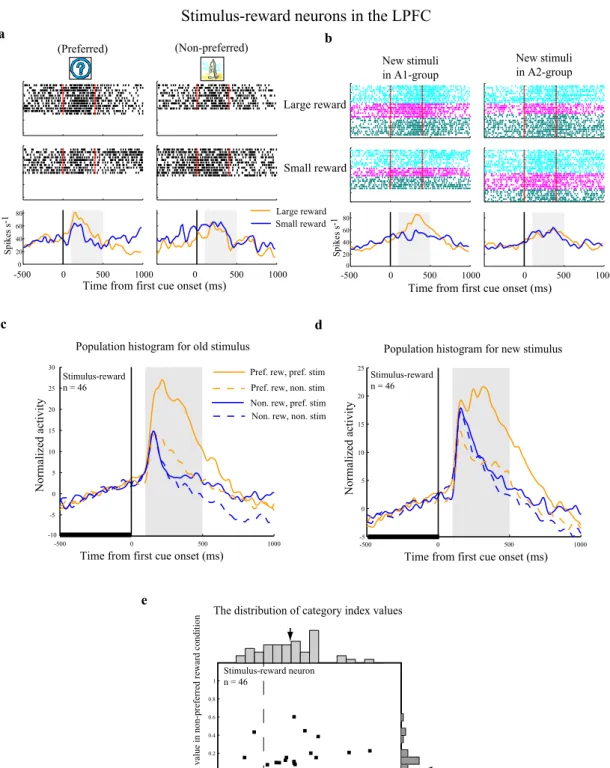
A typical reward neuron in the LPFC (Fig. 5A76) showed significantly higher
activity in large than in small reward trials (two-tailed t-test, P<0.01), and no differential activity between the two old stimuli (A1 versus A2) in the first cue period. This neuron showed a similar reward-modulated activity when the new stimuli were presented as the first cue (Fig. 5B76). Thus, it appears that the reward neurons
encoded reward-related information associated with the stimuli, regardless of their visual properties and regardless of the group to which the stimulus belonged, a type of neural activity which has been observed in previous reports110,53,60.
We found that the majority of the 106 reward neurons in the LPFC (93/106, 87.7%) showed reward-type activity to the new stimuli in the first cue and/or in the early delay periods (two-way ANOVA (stimulus versus reward), P<0.05). The remaining 13 neurons showed no reward-modulated activity to the new stimuli tested. The population histogram of reward neurons in the LPFC shows that they distinguished the preferred from the non-preferred reward condition not only for the old stimuli, but also for the new stimuli in both the first cue period (Fig. 5C76 and D76)
and in the early delay period (Fig. 5E76 and F76).
An example reward neuron in the caudate showed reward-modulated activity to both the old and new stimuli regardless of their visual properties (Fig. 6A76 and B76).
All 50 caudate and 90% (45/50) of putamen reward neurons showed reward-modulated activity to the new stimuli in the first cue and/or in the early delay period (two-way ANOVA (stimulus versus reward), P<0.05). The remaining 5 putamen neurons showed no reward-modulated activity to the new stimuli tested. The population histogram shows that the caudate and putamen reward neurons discriminated between the two reward conditions on the basis of both the old and new stimuli in the first cue period (Fig. 6C76 and E76) and in the early delay period (Fig.
Figure 5. An example LPFC reward neuron and population histograms. In these figures, activity in the
first and repetition trials with new stimuli was included in the analysis. A, B, Response of a LPFC reward neuron to old stimuli (A) or new stimuli (B). All trials were sorted into four conditions based on the first cue stimulus (A1 group vs A2 group) and on the two reward conditions (large vs small reward) and then aligned with the first cue onset. Red lines in the rastergrams mark the onset and offset of the first cue. The orange curves in the histograms represent data from large reward trials and the blue curves represent data from small reward trials. The gray areas indicate the first cue period for analysis of neuronal activity. Three pairs of new stimuli were tested for this neuron (indicated by the three different colors in B). C, D, Population histograms of LPFC reward neurons that showed significant reward modulation for old stimuli in the first cue period (C) and for new stimuli in the first cue period (D). The gray areas denote the first cue period. E, F, Population histograms of LPFC reward neurons that showed significant reward modulation in the early delay period (the gray area), but not in the first cue period for old stimuli (E) and for new stimuli (F). To make the histograms, trials for each cell were sorted by the preferred reward condition (orange curve) and the non-preferred reward condition (blue curve). In addition, the activity in each trial was normalized by the firing rate during the 500ms fixation epoch before the first cue onset (indicated by the thick black line). (76)
-5000 0 500 1000 10 20 30 40 50 60 Spikes s -1 -5000 0 500 1000 10 20 30 40 50 60 -5000 0 500 1000 10 20 30 40 50 Spikes s -1 -5000 0 500 1000 10 20 30 40 50 -500 0 500 1000 0 5 10 15 20 -500 0 500 1000 0 5 10 15 20 -500 0 500 1000 -10 -5 0 5 10 15 20 -500 0 500 1000 -10 -5 0 5 10 15 20 New stimuli
in A1-group New stimuliin A2-group
Large reward
Small reward
Large reward Small reward
Time from first cue onset (ms) Time from first cue onset (ms)
Population histogram for old stimulus Population histogram for new stimulus
Population histograms of reward neurons in the first cue period
Time from first cue onset (ms)
Normalized activity
Time from first cue onset (ms)
Normalized activity
Population histograms of reward neurons in the early delay period
Population histogram for old stimulus Population histogram for new stimulus
Time from first cue onset (ms)
Normalized activity
Time from first cue onset (ms)
Normalized activity Reward neurons n = 63 Reward neurons n = 63 Reward neurons n = 43 Reward neurons n = 43
Single-unit activity of a reward neuron in the LPFC
A B
C D
E F
Preferred reward Non-preferred reward
Figure 6. Histograms of activity of an example caudate reward neuron and the caudate and putamen
reward neuron populations. In these figures, activity in the first and repetition trials of new stimuli were included for analysis. The formats are the same as those in Figure 5. A, B, Single-unit activity of a caudate reward neuron to old stimuli (A) or new stimuli (B) presented as the first cue in SPATs. This neuron was identified as reward type for both old and new stimuli. C, Population histograms of caudate reward neurons that showed significant reward-modulated activity to old stimuli in the first cue period. The left column represents the population histograms for old stimuli and the right column indicates the population histograms for new stimuli. D, Population histograms of caudate reward neurons that showed significant reward-modulated activity to old stimuli in the early delay period (the gray area), but not in the first cue period. The left column represents the population histogram for old stimuli and the right column indicates the population histograms for new stimuli. E, Population histograms of putamen reward neurons that showed significant reward-modulated activity to old stimuli in the first cue period. The left column represents the population histograms for old stimuli and the right column indicates the population histograms for new stimuli. F, Population histograms of putamen reward neurons that showed significant reward-modulated activity to old stimuli in the early delay period, but not in the first cue period. The left column represents the population histogram for old stimuli and the right column indicates the population histograms for new stimuli. (76)
We were interested in whether the reward neurons in these areas could predict the reward value of the first cue stimulus (particularly for the new stimuli) in SPATs after only experiencing reward instruction with C1 and C2. We focused on the neural activity in the first SPAT block in which the new stimuli or the old stimuli were presented for the first time to each recorded neuron (Fig. 776 and 876). Notably, in
these very first SPATs, the new stimuli were for the first time presented as the first stimulus cues. Therefore, before the end of these specific trials, the monkeys (as well as the neurons) had had no opportunity to directly associate the new stimulus with a particular amount of reward. They also had never experienced any direct pairing between the new stimuli and C1 and C2. As reference activity, we also calculated the activity of each reward neuron to the old stimuli in the first SPAT block after reward instruction. In these trials, the monkeys and neurons had already well experienced the old stimuli in the SPATs with asymmetric reward schedules.
We found that when an old stimulus was presented as the first cue, reward neurons in the LPFC, caudate and putamen discriminated the two reward conditions (large and small reward) right from the first SPAT in both the first trial-sequence (N1,1; Fig. 7A76, Fig. 8A76 and 8E76) and the second trial-sequence (N2,1; Fig. 7B76, Fig.
8B76 and 8F76). The results of two-way ANOVA (reward vs. trial order) showed that
the neural activity to the old stimuli had a significant main effect of reward (P<0.001), but no significant effect of trial order (P>0.3) and no significant interaction between the two factors (P>0.3). Further post-hoc tests with Bonferroni correction revealed that the reward neurons in the three areas showed significantly higher activity in the preferred reward condition than in the non-preferred reward condition (P<0.01).
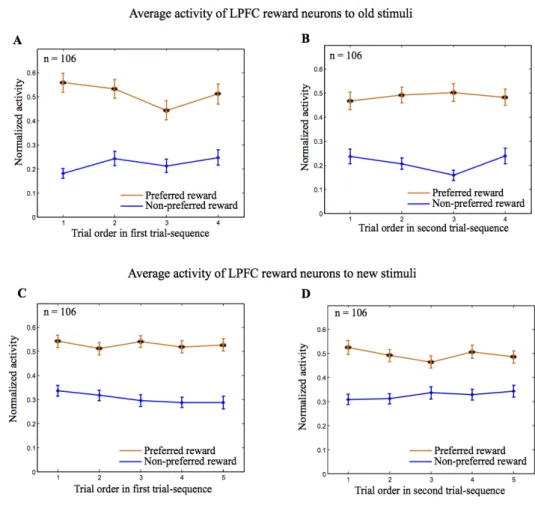
However, regional differences in response activity were found when the new stimuli were presented as the first cues. The LPFC reward neurons were able to predict the reward values of the new stimuli from the first SPAT after reward instruction in both the first and the second trial-sequences (i.e. in both N1,1 and N2,1;
Fig. 7C76 and D76) despite the fact that monkeys had never directly learned the new
stimulus-reward contingency. The two-way ANOVA (reward vs. trial order) demonstrated that neural activity seen in Fig. 7C76 and 7D76 had a significant main
effect of reward (P<0.001), but showed neither effect of trial order (P>0.5) nor interaction (P>0.4). Post-hoc tests with Bonferroni correction suggested that LPFC reward neurons had significantly higher activity in the preferred reward condition vs. the non-preferred reward condition from the first SPAT (P<0.01).
Figure 7. Population activities of LPFC neurons as a function of SPAT order in the first and second
trial sequences. Here, the analysis was based solely on the first block of SPATs in which new stimuli (or old stimuli) were presented for the first time for each recorded neuron. A, B, Normalized activity of LPFC reward neurons to old stimuli in the first trial sequence (A) and in the second trial sequence (B). C, D, Normalized activity of the same population neurons to new stimuli in the first trial sequence (C) and in the second trial sequence (D). The normalized activity was sorted into the preferred reward condition (orange curves) and the non-preferred reward condition (blue curves). Statistical significance was determined by Mann–Whitney U test; *p 0.05; **p 0.01. Error bars indicate the SEM. (76)
In contrast to the LPFC reward neurons, during the first trial-sequence the reward neurons in the caudate and putamen did not distinguish the preferred from non-preferred reward conditions in the very first SPAT (i.e. in N1,1 trials; Fig. 8C76
and 8G76). Using the two-way ANOVA, we could show the caudate neural activity (as
seen in Fig. 8C76), had a significant main effect of reward (P<0.001), and a significant
interaction between reward and trial order (P=0.002), but no significant effect of trial order (P>0.9). Post-hoc tests with Bonferroni correction revealed that the caudate neurons had no reward-modulated activity in the first trials (P>0.05), but they did show significantly differential activity between the two reward conditions from the second trial in the first-trial sequence (i.e., from N1,2 trials, P<0.01). The activity of
the putamen neurons in Fig. 8G76 showed a significant main effect of reward (P<0.001)
and interaction of reward and trial order (P=0.014), but again no significant effect of trial order (P>0.3). A post-hoc test with Bonferroni correction revealed that the putamen neurons showed no reward-modulated activity in the first two trials (i.e., in N1,1 and N1,2 trials; P>0.05), but that the differential activity between the two reward
conditions gradually increased from the third trial onwards, and reached a significant level in the fourth trial (P<0.01).
The same populations of neurons in the caudate and putamen predicted reward information for the new stimuli from the first SPATs in the second trial-sequence (i.e. in N2,1 trials; Fig. 8D76 and H76), although the monkeys had never directly learned the
new stimulus-reward contingency. The results of a two-way ANOVA showed that neural activity (shown both in Fig. 8D76 and Fig. 8H76) showed significant main
effects of reward (P<0.01), but no effect of trial order (P>0.3) as well as interaction (P>0.7) in the second trial-sequence. A post-hoc test with Bonferroni correction additionally showed that both the caudate and putamen neurons had significantly higher activity in the preferred reward condition as opposed to the non-preferred reward condition from the first trial in the second-trial sequence. These results suggest that the striatal reward neurons used the new stimulus-reward contingency presented in the first trial-sequence to predict the reward information for the other stimulus from each pair shown in the second trial-sequence. To examine the consistency of neural response patterns among the three monkeys, we separately calculated the response patterns of the LPFC and striatal reward neurons in the first and second trial-sequences for each of the animals. The results from individual monkeys were consistent with the population data from the three monkeys in the LPFC and the two monkeys in the caudate and putamen.
These results demonstrated that both the LPFC and striatal neurons could transfer reward information paired with C1 and C2 to well-experienced stimuli (A1 and A2) in SPATs. More importantly, the LPFC neurons which responded to reward