2014 (Heisei 26 nen)
Doctoral Dissertation
EMPIRICAL ANALYSIS OF THE HOUSING
AFFORDABILITY AND HOUSING SUPPLY IN CHINA
Ritsumeikan University
Graduate School of Economics
Doctoral Program in Economics
ACKNOWLEDGEMENTS
I owe my deepest gratitude to the people who have helped and supported me throughout my dissertation.
A particular thank of mine goes to my supervisor, Professor Kazuo INABA for his easygoing guidance, useful comments and enthusiastic encouragements through the lengthy dissertation process. Despite his numerous obligations, he makes himself available to me whenever I need his wisdom. The weekly meeting with him keeps my dissertation on track, from the preliminary idea to the final completion. I am heartily thankful to my committee members, Professor Xiao-Ping ZHENG and Professor Hiroshi IZAWA, whose comments improved this dissertation. More importantly, they provide me a clue about how to conduct the ensuing study.
I would like to thank Professor Jie QIN who taught me how to begin my research in the first year of my doctoral study. Helpful comments from Professor Shuji MATSUNO and Professor Toshiaki YAMAI are also acknowledged. I also thank Ms. Shibata for her assistance in keeping my progress on schedule.
In addition, I would like to extend my thanks to the China Scholarship Committee for providing necessary financial support. In particular, I would never forget my postgraduate university Northwest A&F University and my supervisor Professor Yu who make it possible to spend my happy time at Ritsumeikan University.
Finally, I thank my family for their undivided and continuous support, who inspired me and encouraged me, without whom it would be impossible to complete this dissertation.
Lastly, I offer my regards and blessings to all of those who supported me in any respect during the completion of this dissertation.
ABSTRACT
In the last decades, housing prices in China experienced a rapid increase putting on considerable pressure on home buyers, which brought about a big concern on the housing affordability problem. While there has been a large body of literature on housing demand, limited process has been made in the study area of housing supply. The objective of this dissertation, which consists of six chapters, is to explore the housing affordability problem, to estimate the housing supply elasticity and its determinants, and to examine whether the housing supply varies by region and type in China. A reduced-form model is used to estimate the housing supply elasticity nationwide, while the urban growth model is used to examine the variation in housing supply across regions and by housing type. Data used in this study mainly come from 31 provinces and 35 large and medium cities in China over the period 1998-2010. The main findings are as follows:
1) Inspite of the remarkable family income growth, the majority of the Chinese households are still suffering from the housing affordability problem.
2) Housing supply in China is less elastic compared to other countries and land regulation plays an important role in affecting housing supply.
3) The elasticity of housing supply not only varies by region, but also differs by housing type to type significantly.
This dissertation links the housing affordability problem to the elasticity of housing supply. The result supports that the current housing affordability problem in China is somewhat caused by the less elastic housing market, where housing supply cannot rise quickly in response to demand increases. This dissertation also examines differences in housing supply across regions and by type, which can be referenced in the establishment and implementation of housing policies and programs toward growth in the housing supply.
CONTENTS
Acknowledgements………....ii
Abstract...iii
Contents ... iv
List of Tables ... vii
List of Figures... ix
CHAPTER 1 ... 1
INTRODUCTION ... 1
1.1 Background of the study... 1
1.2 Statement of the problem... 3
1.3 Purpose of the study ... 4
1.4 Outline of the study ... 5
CHAPTER 2 ... 7
HOUSING AFFORDABILITY IN CHINA: MEASUREMENTS, TRENDS, AND INTERPRETATIONS... 7
2.1 Introduction ... 7
2.2 An under-served Chinese housing market ... 8
2.2.1 Demand... 9
2.2.2 Supply... 11
2.2.3 The soared housing price ... 14
2.3 Measurements, data and the assessed housing affordability ... 16
2.3.1 Measurements... 16
2.3.2 Data... 20
2.3.3 The assessed housing affordability... 20
2.4.1 Experiences of other countries ... 26
2.4.2 Efforts of the Chinese government ... 28
2.5 Concluding remarks... 30
CHAPTER 3 ... 31
ESTIMATING THE HOUSING SUPPLY ELASTICITY AND ITS DETERMINANTS ... 31
3.1 Introduction ... 31
3.2 Previous Research ... 32
3.3 Methodology... 38
3.3.1 Price elasticity of housing supply... 39
3.3.2 Housing supply determinants ... 41
3.4 Data and empirical results ... 42
3.4.1 Data... 42
3.4.2 Estimated price elasticity of housing supply ... 43
3.4.3 The alternative determinants of housing supply... 46
3.5 Concluding remarks... 47
CHAPTER 4 ... 48
EVALUATING VARIATIONS IN THE HOUSING SUPPLY ELASTICITY ACROSS REGIONS... 48
4.1 Introduction ... 48
4.2 Literature review... 48
4.2.1 Variations in the housing supply elasticity and its alternative explanations... 49
4.2.2 Urban growth and housing supply... 50
4.2.3 Land-use regulations and housing supply ... 50
4.2.4 The urban growth model... 53
4.3 Methodology and data ... 56
4.5 Summary and conclusions ... 68
CHAPTER 5 ... 69
SUPPLY ELASTICITY BY HOUSING TYPE: DIFFERENCES AND INTERPRETATIONS... 69
5.1 Introduction ... 69
5.2 The supply structure of the Chinese housing market ... 70
5.3 Methodology... 74
5.4 Estimated results and discussions... 80
5.4.1 Estimated results... 80
5.4.2 Discussions ... 87
5.5 Concluding remarks... 92
CHAPTER 6 ... 94
CONCLUSIONS ... 94
6.1 Summary of the study... 94
6.2 Potential limitations and suggestions for future work ... 96
BIBLIOGRAPHY ... 98
List of Tables
Table 2.1 Urbanization in China: urban growth rate and urban population, 1986-2011
... ..10
Table 2.2 The household situation of urban residents ... 11
Table 2.3 Total fixed assets investment and housing investment (1995-2011) ... 12
Table 2.4 Per capita income and size of urban households by level in Beijing and Shanghai, 2011 ... 21
Table 2.5 Paying for new houses by installments for the bottom 40% groups in Beijing and Shanghai, 2011... 22
Table 2.6 The basic budget standards of urban residents, 2011 ... 23
Table 2.7 Housing affordability on the residual income standard ... 24
Table 2.8 The criterion of housing affordability... 25
Table 2.9 Housing affordability across countries ... 26
Table 3.1 A wide range of the estimated housing supply elasticity ... 35
Table 3.2 Alternative explanatory variables for housing supply elasticity... 37
Table 3.3 Statistics of housing price and independent variables: 1999-2010, for 35 cities ... 42
Table 3.4 Estimation results for income elasticity of housing supply ... 44
Table 3.5 Price Elasticity of Housing Supply... 45
Table 4.1 Descriptive Statistics for Variables ... 61
Table 4.2 Regression results ... 63
Table 4.3 Geographical distributions of the 35 cities ... 65
Table 4.4 Estimation results for three regions ... 66
Table 5.2 Descriptive statistics……….73
Table 5.3 Unit root test results... 77
Table 5.4 List of instruments of the current price ………78
Table 5.5 Regression results: common residential housing... 81
Table 5.6 Regression results: villas and high-grade apartments... 84
Table 5.7 Regression results: economically affordable housing ... 86
List of Figures
Figure 2.1 Floor space of commercialized housing sold during 1998-2011 ... 9
Figure 2.2 GDP per capita and disposable household income (unit: RMB) ... 10
Figure 2.3 Housing supply in China, 1995-2011... 12
Figure 2.4 Housing conditions of urban residence (unit: sq.m) ... 14
Figure 2.5 Real and nominal housing price movements: 1988-2011 ... 15
Figure 2.6 The path of housing affordability measured by the price-to-income ratio ... …...23
Figure 3.1 The key factors in the housing market ... 36
Figure 5.1 The average selling price of housing by type (unit: RMB/sq.m)... 72
Figure 5.2 The benchmark rate of one-year deposit and one-year lending, 1995-2010 ... …73
CHAPTER 1 INTRODUCTION
1.1 Background of the Study
The Chinese government officially launched the housing reform in order to improve the inferior living conditions in the beginning of the 1980s. From this point, onward housing reform has led to heated debates among Chinese scholars and later attracted attention to academic communities and financial organizations in the world (Shaw, 1997). Before the reform, the majority of houses were allocated directly by the government and the state-owned work units. Due to insufficient financial support, such welfare-oriented housing provision system1 cannot offer sufficient houses and thus resulted in a housing shortage problem. A reform of the housing system was considered because the government recognized serious problems in the state provision of housing, including shortages, poor management, and corruption in the distribution (Wang and Murie, 1999). In 1998, the Chinese State Council issued the 23rd decree, which marked the housing allocation transforming from a welfare provision to a market-oriented system, was acknowledged as a milestone during the process of the housing reform. Since then, the era of housing distribution was ended. Thereafter, work units were no longer allowed to develop new houses for their employees. Instead, they had to integrate implicit housing benefits into employees’ salary, and the households had to buy or rent their residential housing units in the private housing market (Wu et al., 2012). Under the new housing provision system, low-income households can either rent low cost units or purchase special affordable units at highly subsidized prices from the local governments. Moderate-income households can obtain subsidies to rent public rental units or to
1
Before housing reform, China adopted a welfare housing system under which the production, allocation, and maintenance of housing has been the responsibility of the work unit (Danwei).
purchase price controlled units, while other high-income households are required to rent or buy commercial housing at market price. Meanwhile, multi-level housing funds come from housing public accumulation, mortgages, and flexible repayment terms were established to pool income from various sources for housing construction (Shaw, 1997). Housing reform has transformed China into a country with one of the highest rates of home ownership in the world (Wang, 2011). Accompanied with the housing reform, the rates of home ownership in urban areas increased from around 55 percent in the early 1990s to 88.1 percent in 20122.
Land-use policy was simultaneously changing through housing reform. Whereas land is concentrated in the hands of the state and local governments at different levels, land-use right has economic value and can be traded. The Temporary Regulations for State-Owned Urban Land Use Right Conveyances and Transfers in 1990 formally authorized that use of state-owned urban land were independent economic rights. In addition, these rights could be sold, exchanged, bestowed as a gift, leased, and or used for mortgages within a specified time limit of 50 years for industrial use, 40 years for commercial use, and 70 years for residential use. Under subsequent tax reforms implemented in 1995, the transfer of these property rights becomes subject to a land value-added tax with rates ranging from 30% to 60% (Mak, et al., 2007). The land revenue has become the most important revenue source for the local governments who monopolize the grant of rights of land-use. Since 2002, the state required that all urban land for residential and commercial use should only be transacted by public auction or bidding. Administrative allotment of land-use right was repealed. Furthermore, China strictly controlled land supply for construction use. In practice, the transforming of the land use type is strictly restricted to realize a special protection on cultivated land. In this case, the contradiction between the fast-growing demand of land for construction use and the strict cultivated land protection policy is increasingly outstanding. Stringent
2
control of land supply was mainly responsible for the changes in land prices and thus has a huge impact on house prices (Zhang, 2008).
1.2 Statement of the Problem
Although great achievements have been made in the housing reform in China since the 1990s, many potential problems occurred with the housing market development (Wang, 2004). As an increasingly urbanized and industrialized country, China witnessed substantial economic growth and rapid urbanization over the last two decades, thus led to strong demand for residential housing3. Although the amount of new houses has been increased greatly, housing supply still chronically failed to meet the fast-growing housing demand. As a result, housing prices escalated. Since the housing reform, the average selling price of commercial housing has tripled. The price level is considered beyond reach of the average citizen. The escalated housing price in China has triggered public complains since housing is the single largest expenditure item in the budgets of most households. Indeed, average households devote more than two thirds of their income to housing expenditure, which indicates that even slight changes in housing prices will have considerable impact on household well-being and thus the entire economy of the country. At the request of the public that the government should ‘do something’ to rein in housing prices, the Chinese government launched a round of measures such as land-use controls, interest rate adjustments, and tax policies in order to provide more inexpensive housing to low-income households. In view of the above, an objective policy evaluation on effects of these policies is of great importance. In particular, since most housing models and policy analysis hinge on explicit or implicit estimates of the price elasticity of housing supply (DiPasquale (1999), Malpezzi and Maclennan (2001)), housing supply should be incorporated into analysis in order to
3
The item of ‘housing’ or ‘houses’ appears in this study is limited to houses for living use (unless otherwise specified).
realize a full understanding of the entire housing market. However, while there has been a vast of studies exploring this issue in the demand side, few attentions have been paid to housing supply side for both the theoretical and empirical studies4.
1.3 Purpose of the Study
This thesis aims to explore the current housing affordability problem from a perspective of the housing supply. In other words, it attempts to examine whether the housing affordability problem is potentially caused by inelastic housing supply in China. An analysis on housing supply enables us to observe the behavior of suppliers and assess the performance of the housing policies.
Multiple approaches are employed in this study surrounding the issues of housing supply. Chapter 2 stresses the problem of housing affordability based on the ratio measure and the residual income approach. Both of the difference between households’ income and housing prices, and the situation that households face after paying for housing expenses is considered. Data on housing prices, household incomes by level over 1987-2011 are collected to analyze the housing affordability problem in China. Chapter 3 estimates housing supply elasticity by employing the reduced-form model, which combines the supply function and the demand function into a single one. Using panel data covering 31 provinces of China on the housing market over the years from 1999 to 2010, Chapter 3 estimates the housing supply elasticity and explores the determinants that affect the housing supply elasticity to provide a necessary reference for policy-makers. In Chapter 4, an improved urban growth model, which takes account of urban growth and land-use control, is introduced to examine whether housing supply elasticity varies across regions. New construction of housing is modeled as a function of
4
Many factors should be responsible for this situation. On the one hand, housing supply is the outcome of
complicated decision which is not only by builders but also by the owners of existing housing, and on the other hand, there is little direct evidence that permits us to observe the behavior of housing suppliers (DiPasquale, 1999, p.10).
changes in housing prices, costs of construction materials and capitals, and land supply. The data of 35 cities are divided into three regions according to their location to examine the regional difference in the housing supply. Meanwhile, using the similar approach the difference in housing supply by type is also examined in Chapter 5. The common residential housing, luxury houses, and economically affordable houses are assumed to have different elasticities of housing supply.
1.4 Outline of the Study
While housing spaces have been improved remarkably since the housing reform, most of the Chinese households fail to buy even a standard home without assistance by the government. The Chinese housing market is deemed to be one of the least affordable housing markets in the world. First concern of policy-makers and scholars has always been the housing affordability in China. Moreover, the Chinese government implemented a series of policies to stimulate housing supply in terms of land-use control, interest rates adjustment, and differential tax policies. One issue is how these policies are performed? To answer this question requires a thorough understanding of the entire housing market in China. In other words, both demand and supply should be considered. While there has been a vast of literature, which focuses on the relationship between housing demand and housing prices, progress on exploring the housing affordability problem in the housing supply side is limited. This study fills this gap by estimating the housing supply elasticities and examining their differences across regions and by housing type. Using the reduced form model to estimate housing supply elasticities enables us to make a comparison between our study and other existing studies. Furthermore, this study is distinguished from the existing studies which treat houses of various types as homogenous by observing differences in housing supply across regions and by housing type. The results are supposed to provide supporting
empirical evidences that the one-fit-all policies never work without any consideration of different housing supply elasticities across regions and by housing type.
Following the introductory chapter, Chapter 2 concerns the housing affordability problem to measure stresses that the Chinese households are experiencing in buying houses. This chapter emphasizes the potential problem in the housing market by giving an empirically based picture of housing in current China. Chapter 3 explores the potential causes of the housing affordability problem in the housing supply side by estimating the housing supply elasticity and examining its determinants. Chapter 4 extends the analysis of Chapter 3 by examining the variation in housing supply across three regions in China. In addition, Chapter 5 further investigates the variation of the price elasticity of housing supply among housing of various types. Chapter 6 concludes this dissertation with a summary of the main findings, the potential limits as well as a research plan for future study.
CHAPTER 2
HOUSING AFFORDABILITY IN CHINA: MEASUREMENTS, TRENDS, AND INTERPRETATIONS
2.1 Introduction
Housing is one of the biggest expense items in budgets of most households. Over the past 25 years, sharp increase in the housing price has caused an increasing concern on the housing affordability in China, particularly in the most developed cities such as Beijing and Shanghai. As documented by Lau and Li (2004), around two-thirds of households in the lowest 40 percent of the income range are found to be in housing stress in China. Housing affordability has been regularly raised as a major policy concern.
This chapter attempts to explore the problem of housing affordability5 in China. Previous attempts to explore the determinants of housing price can be found in many studies such as Zhang et al. (2012), Zhang et al. (2007), Chow et al. (2008), Liu and Shen (2005), Shen and Liu (2002). They aim to figure out what makes the housing price in China so high. Most of these studies relate the current housing price to the economic fundamentals with a purpose to examine whether there is a bubble in the Chinese housing market. In particular, they ask whether the housing market in China can be explained by economic fundamentals. Great process has been made since Rosen and Ross (2000) and Chiu (2001), who raised the problem of housing affordability. Lau and Li (2004) and Chen et al. (2010) measure the housing affordability in Beijing and Shanghai respectively, while a recent work by Wu and Deng (2012) evaluates the
5
Housing affordability is widely used as an international standard in measuring the pressure that home buyers bear to buy a new house under their current income.
affordability of major housing markets in China. However, the existing studies on the housing affordability are still limited. In particular, emphasis is not much diverted to housing conditions, problems of affordability, housing policies and their interactions (Mak et al. 2007, p. 177).
This chapter firstly outlines a picture of the Chinese housing market with a special focus on the problem of affordability. Both the ratio approach and the residual income approach are employed to measure the pressure of buying a decent house for households. Moreover, a comparison of housing affordability with other countries helps us to be fully aware of current problems of the Chinese housing market.
This chapter proceeds as follows. Section 2 introduces the term of affordability and addresses how to capture the housing affordability. Section 3 discusses the basics of housing markets in China to trace back to the possible source of the housing affordability problem. Section 4 reports the calculated housing affordability using alternative approaches during the past years since the housing reform. Section 5 reviews experiences of other countries and efforts made by the Chinese government to solve the housing affordability problem. Finally, Section 6 concludes this chapter with the main findings.
2.2 An under-served Chinese housing market
The real estate market in China has been gradually developing with reform of the urban housing system. Per capita living space has been widened remarkably in the past 20 years. However, the increase in housing supply cannot catch up with the rapidly growing housing demand. As a result, housing prices soared putting huge pressures on home buyers. We define a market where the supply lags behind the demand as an ‘under-served housing market’.
2.2.1 Demand
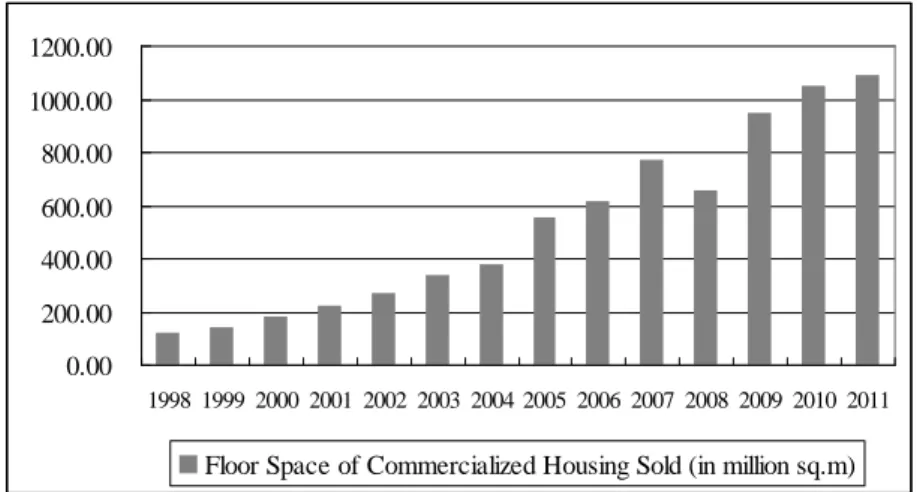
The year 1998 is widely described as a milestone in the Chinese housing market because thenceforth houses can be only obtained though market channels and then the urban housing market emerged. Figure 2.1 reveals that the transaction volume of housing in 2011 has increased six-fold since 1998. It is generally acknowledged that multiple forces including the economy development, the rapid urbanization, and the reduced size of the households stimulated the housing demand during the past 15 years.
0.00 200.00 400.00 600.00 800.00 1000.00 1200.00 1998 1999 2000 2001 2002 2003 2004 2005 2006 2007 2008 2009 2010 2011
Floor Space of Commercialized Housing Sold (in million sq.m)
Figure 2.1 Floor space of commercialized housing sold during 1998-2011 Source: the Chinese Statistical Yearbook, 2012.
Note: The commercialized housing only involves the new construction of housing, while excludes the renovation and repair of the
existing stock.
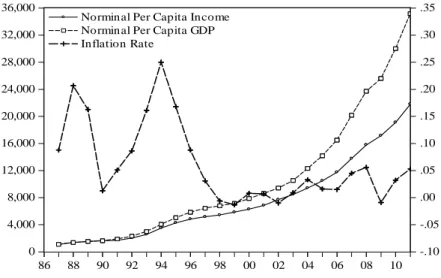
Apparently, the rapid development of the economy in the past two decades, which in turn leads to a rapid increase in household income, is an important contributing factor to the huge current housing demand. The increase in household income is a strong tendency to improve their living conditions. International experiences reveal that after the per capita GDP has reached $3,000 (a medium standard of living), the desire of households to improve their living conditions will be strengthened. Figure 2.2 shows that the per capita GDP had already exceeded RMB18, 000 (that is the U.S. $3,000) in 2006, which indicated a continuously growing housing demand in the following years.
0 4,000 8,000 12,000 16,000 20,000 24,000 28,000 32,000 36,000 -.10 -.05 .00 .05 .10 .15 .20 .25 .30 .35 86 88 90 92 94 96 98 00 02 04 06 08 10
Norminal Per Capita Income Norminal Per Capita GDP Inflation Rate
Figure 2.2 GDP per capita and disposable household income (unit: RMB) Source: the Chinese Statistical Yearbook, 2012.
Another key factor underpinning housing demand in the Chinese urban market is a strong urbanization trend, as depicted in Table 2.1 which reports the urban population and its proportion in the overall population (urbanization rate) since 1986. The rapid urbanization attracts more and more people to immigrate into urban areas, and generates a huge demand for housing to accommodate the additional person.
Table 2.1 Urbanization in China: urban growth rate and urban population, 1986-2011
Year 1986 1995 1997 1999 2001 2003 2005 2007 2009 2011
Urban Population (100 million persons)
2.6 3.5 3.9 4.4 4.8 5.2 5.6 6.1 6.5 6.9
Urbanization Rate (%) 24.5 29.0 31.9 34.8 37.7 40.5 43.0 45.9 48.3 51.2
Source: the Chinese Statistical Yearbook, 2012.
Note. The urbanization rate equals the proportion of urban population to total population (including agricultural and
non-agricultural).
Meanwhile, household size decreases from 3.7 persons in 1996 to 3.1 persons in 2010 which further contribute to the growing housing demand. The number of one-person households and two-person households has been growing rapidly (see Table 2.2). The
household size is becoming gradually smaller and the nucleus family is becoming the major form of modern Chinese families. Thus, demand from newly built family looking for homes also boosts the demand for houses.
Table 2.2 The household situation of urban residents
Year Number of the One-person households (million)
Number of the Two-person households (million)
The average household size (persons)
2000 9.07 18.33 3.44
2010 23.10 35.79 3.10
Source: the demographic data are collected by the 5th national census in 2000 and the 6th national census in 2010.
Furthermore, it should be noted that the rapid development of the Chinese housing market also fueled the speculative demand for housing especially in the period of high inflation (as showed in Figure 2.2). To hedge against inflation and the rising user costs, buying property is particularly appealing in China because the limited financial sector offers few other investment options (Zhang et al., 2012). The current increasing demand of housing might be a sign that companies and investors are fear of inflation. According to the United States Department of Housing
and Urban Development (HUD)6, inflation heated up house prices and counterbalanced
any increases in nominal wages, and eventually increased the pressure of urban residents to buy new homes.
2.2.2 Supply
The modern housing system encourages the private property developers to invest in housing construction, and leads to a significant increase in resource allocation for residential construction (Mak et al., 2007). Figure 2.3 illustrates a sharp increase in housing supply during the past periods of 1995-2011. The space of newly completed residential housing has more than doubled over the period of 1995-2011, reaching
6
nearly two billion square meters in 2011. Growing faster than the space of newly completed housing is the amount of investment on residential housing which increased more than six folds by 2011.
0.0 500.0 1000.0 1500.0 2000.0 2500.0 95 96 97 98 99 00 01 02 03 04 05 06 07 08 09 10 11 0.0 10000.0 20000.0 30000.0 40000.0 50000.0 60000.0 70000.0
Left: Floor Space of Residential Buildings Completed (million sq.m)
Right: Housing
Investment (million yuan)
Figure 2.3 Housing supply in China, 1995-2011 Source: National Bureau of Statistics of China.
Moreover, investment in real estate accounted for the fixed assets reached 19.8% in 2011 as depicted in Table 2.3. Housing investment has become one of the most important components of the total urban fixed asset investment.
Table 2.3 Total fixed assets investment and housing investment (1995-2011)
Year 1995 1997 1999 2001 2003 2005 2007 2009 2011
Total investment in housing development (10 billion RMB)
31 32 41 63 102 159 253 362 618
Total investment in fixed assets (10 billion RMB)
200 249 298 372 555 887 1373 2246 3114
Proportion (%)a 15.7 12.7 13.7 17.0 18.2 17.9 18.4 16.1 19.8
Source: the Statistical Yearbook of China, published by the Chinese State Statistical Bureau, 2012.
a The proportion of urban housing investment in the total investment in fixed assets.
Meanwhile, loans for real estate development are also growing remarkably. The Chinese government worked out a policy entitled the ‘Management Provisions on
Residents Housing Loan’ in 1998 to encourage the commercial banks to increase the financial support to housing consumptions since the housing reform (Leung and Wang, 2007). Over 60% of the real estate investment in China relies on the support of bank loans (Liu and Huang, 2004). At the end of 2012, the total balance of real estate development loans stood at 3 trillion RMB with an increase of 10.7%. More specifically, the total balance affordable housing7 development loans reached to 571.1 billion RMB with an increase of 179.6 billion RMB which accounts for 66.5% of the total incremental real estate development loans over the same period8. In addition, a considerably large portion of bank lending was channeled into housing investment, which reflects a tendency of the Chinese government towards to increase affordable housing to solve the housing shortage problem. With the benefit of hindsight, it is clear that an influx of bank lending onto the housing markets simulates investment of houses through a multiplier effect remarkably.
In general, these data on housing supply in some sense indicate a success of urban housing reform in spurring housing construction. The large-scale housing investment has increased the supplies of residential houses considerably. The first household survey on housing conditions was carried out in 1985, and it revealed that the majority of urban residents were experiencing very poor living conditions (the per-capita living space was only 12 square meters in that year). Due to the economic development and housing reforms, per-capita living space in China has more than doubled since 2002 (see Figure 2.4).
7
Affordable housing includes houses of two limits (limited price and habitable area), economically affordable housing, policy-regulated rental housing, low-rent homes and other types of government-subsidized house. 8
Data sources: ‘the 2012 Statistical Report on Credits Destination of the Financial Institutions’ provided by the People’s Bank of China.
12 16 20 24 28 32 86 88 90 92 94 96 98 00 02 04 06 08 10 Per Capita Living Spac e of Urban Res idenc e
(s q.m)
Figure 2.4 Housing conditions of urban residence (unit: sq.m) Source: National Bureau of Statistics of China.
2.2.3 The soared housing price
In spite of the increased housing investment promoted by housing reform, there is a large gap between demand and supply since a relatively flat increase in supply cannot catch up with a substantially growing demand. Currently, large proportions of households are not able to have their own homes and have to share an apartment with their extended family or colleagues in China. The Galaxy Securities Statistics represents that during the periods 1995-2011 the total space of newly completed commercialized housing is 6.07 billion square meters and the space of commercialized housing actually sold is 6.86 billion square meters due to the pre-sale system, while the potential demand went up to 13.0 billion square meters. Furthermore, there are approximately more than eight million newly wedded couples every year (Global Information, Inc., 2003), who expect to establish their own families and seek new homes for themselves. Huang (2003) noted that it is common for unrelated adults to share a room. The married couples have to live with their parents and grandchildren have to share a room with their grandparents. Therefore, the upward trend of demand for new homes will remain strong for a long time, in terms of both quantity and quality (Mak et al., 2007). As a result, the shortage
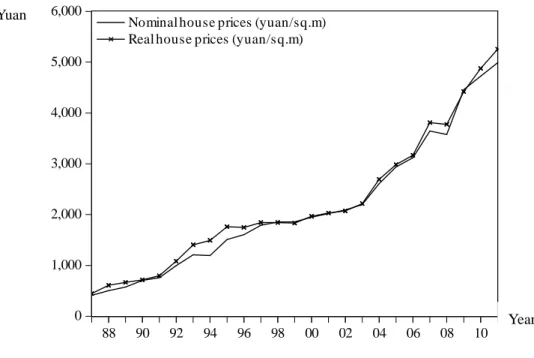
of supply pushes housing prices up to 21,809 RMB/sq.m in 2011, more than eleven times their level of 1998. Figure 2.5 illustrates the path of house price changes both in normal and real item. In contrast to other commodities of which prices increased by 2.9%, the growth rate of housing prices has surged to around 11.2% in 2011. Housing prices have soared, and the average selling price of housing has tripled during the observed period. 0 1,000 2,000 3,000 4,000 5,000 6,000 88 90 92 94 96 98 00 02 04 06 08 10
Nominal house prices (yuan/sq.m) Real house prices (yuan/sq.m)
Figure 2.5 Real and nominal housing price movements: 1988-2011 Source: China Statistical Yearbook, 2012.
Note: Real house prices are adjusted for inflation, which are calculated by deflating the nominal house prices by the change in the
consumer price index.
Compounding the housing affordability problem is the remaining stubbornly high inflation. Taking account of inflation, it is apparent that real house prices are considerably even higher especially in the high inflation environment during 1991-1998 and 2006-2011. The current high price has gone beyond the purchasing power of most urban households, put pressure on home buyers, and caused housing affordability problems.
Year Yuan
2.3 Measurements, data and the assessed housing affordability
2.3.1 Measurements
Any consensus does not exist on the definition of affordable housing. Before starting to assess the housing affordability, it is strongly suggested to firstly clarify how to capture the housing affordability. A review of the literature on definitions of the housing affordability is conducted in this section. Notice first that the item of housing affordability should be distinguished from the ‘affordable housing’ which refers to houses that are appropriate for the needs of the low-to-moderate income households and are priced lower than market prices to ensure that these households are able to meet their other essential basic needs after paying for housing expenses9. These two items are totally different concepts.
The most general use of the term of housing affordability revolves around consideration of the extent to which housing costs for a given standard of housing threaten their capacity to meet their total household needs (Hancock, 1993). The term of housing affordability is widely used in evaluations of the cost burden of housing for consumers and thus is interpreted as the relationship between household incomes and housing expenditures (Kutty, 2005). Housing is deemed to be affordable if expenditure relative to income is reasonable or moderate. Meanwhile, Bogdon and Can (1997, p.47) state that measures of housing affordability quantify the extent of the discrepancy between current housing expenditures of households and what they are expected to spend given their consumption needs. Similar discussion can also be found in Bramley (1990). More accurately, Gan and Hill (2009, p.116) illustrate that the capability of a household to purchase a house can be viewed at least in three different ways: purchase affordability, repayment affordability and income affordability. Purchasing affordability
9
As cited in the ‘Housing Affordability Literature Review and Affordable Housing Program Audit,’ Urban Research Centre, University of Western Sydney, July 2008.
considers whether a household is able to raise enough funds to buy a home and repayment affordability refers to the burden imposed on a household of repaying the mortgage, while income affordability simply measures the ratio of house prices to income.
2.3.1.1 The ratio approach
The first approach refers to the ratio measure which expresses defined housing costs as a proportion of income and relates this proportion to selected standards of affordability. The 30/40 rule and the ratio of price-to-income are used extensively not only in applied housing studies, but also widely reported in official housing statistics.
1) The 30/40 rule
The 30/40 rule, the preferred measure of housing stress, is currently the most widely used as a benchmark for ‘housing stress’ regarding its simple operation. This refers to the point at which 30 percent of the gross income of a household in the lowest 40 percent of the income distribution is allocated to housing costs. Beyond this level, housing is defined unaffordable. Housing stress is defined as occurring when more than 30% of household incomes are spent on housing costs for the bottom 40% of income groups (Yates et al, 2007).
2) The price-to-income ratio
An alternative measure of housing affordability is the ‘median multiple’ (median house price divided by gross annual median household income), a traditional measure, which is also called the price to income ratio (Demographia, 2013). This traditional measure deems that the household is having an affordability problem when the ratio of price-to-income goes beyond 30 percent. The standard formula for the price-to-income ratio in the housing literature is
I hp
ratio= / (1-1)
where hp denotes the median house price, while I denotes the gross annual household income. But in China, neither the total price indicator nor the household income indicator is regularly reported in China (Wu et al., 2012). The formula is amended to
Price-to-income ratio = (average housing price per sq.m floor area) × (housing unit size) / (average per capita income × household size) or Price-to-income ratio = (average housing price per sq.m floor area) × (housing size per person) / (average per capita income). (1-2)
Hence, larger value of the price-to-income ratio means worse performance of the housing market where housing is less affordable for home buyers.
2.3.1.2 The residual income approach
The second approach is the residual measure which focuses on the situation of ‘after-housing poverty’. Suggested by this approach, the ‘housing affordability’ refers to the capacity of households to meet housing costs while maintaining the ability to meet other basic costs of living. Stone (1975) introduces the term ‘shelter poverty’ to characterize the households who are financially strapped and cannot afford other necessities after paying for housing, in other words, non-housing expenditures are limited by the amount of money after paying for housing. Later, Kutty (2005) re-emphasizes this measure of housing affordability and uses the concept of ‘housing-induced poverty’10 to describe the situation where a household cannot afford other basic needs after paying for housing. Housing is deemed to be not affordable if there is insufficient income left to sustain a reasonable living standard.
10
Apart from the traditional measure, this new measure believes that the households, who even undertake housing cost burdens more than 30% percent, can still afford basic necessities, but are not identified as having an affordability problem. The residual income approach is strongly supported by Stone (2006) and Chen et al. (2010). It can be used in predicting the occurrence probability of housing-induced poverty and is informative in determining the level of maximum affordable housing price. It also provides guidelines to suggest the magnitude of housing assistance that should be provided to low-income households11. However, the disadvantage of this approach is its dependence on subjective assumptions about household expenditure and the difficulty to define measurement criteria of basic necessaries – non-housing goods (Stone, 2006). What compounds the difficulty of using this approach to assess the housing affordability is lacking regularly published data on a minimum standard of adequacy for non-housing necessaries in China.
Whereas the ratio measure reveals an affordability problem when housing expenses are deemed relatively large in relation to income, the residual income approach considers whether housing is affordable taking account of income levels and broader basic household needs. In other words, the residual income measure is specifically concerned with the relationship between housing costs and living standards, while the ratio measure focuses exclusively on housing costs and incomes.
While the above two approaches have been used widely for its easy operation and data accessibility, they are criticized for overlooking housing quality. Consider a household who has chosen a higher level of housing consumption than the socially accepted community standards and may be counted as having an affordability problem by using the ratio measure and the residual measure (Whitehead, 1991). Therefore, a
11
Stone (2006) pointsout that the appropriate indicator to describe the relationship between housing costs and incomes is the residual income left after paying for housing rather than the price-to-income ratio (p. 163). Chen et al. (2010) summarize that the residual income approach is more logically robust and has a number of theoretic merits (p. 885).
new approach which considers more factors regarding to housing quality, location, spatial differentiation, and household preferences, is suggested by Mulliner et al. (2013)12.
2.3.2 Data
Taking account of data access, this study mainly uses the ratio approach and the residual income approach to measure the situation of housing affordability in China. Data on housing prices, household income comes from the Statistical Yearbook of China (1986-2012), the Statistical Yearbook of Beijing (2012), and the Statistical Yearbook of Shanghai (2013). A decent house is specified with a size of 70 square meters13. The dynamic housing affordability during 1987-2011 is obtained by using the price-to-income ratio. In addition, the residual income approach is used to explore whether a household can still afford for basic necessaries after deducting housing expenses. Data on basic expenses are gathered from the Statistical Yearbook of China (2012).
2.3.3 The assessed housing affordability
2.3.3.1 Estimated results: using the 30/40 rule
Take Beijing and Shanghai which are perceived to have the most severe housing affordability problem as examples. Combining the data reported in Table 2.4 and Table 2.5, the bottom 40% groups would never have a chance to buy a new house at the current housing prices and income level. Even if bank capital is available, the down payment of a 70 square meters house will cost almost seven years’ income of the low 20% household in Beijing, while it is more than five years’ income required for the
12
Due to lack of regularly published data this study employs the ratio measure and the residual measure rather than the third measure.
13
This study employs a conservative standard of a decent house of 70 square meters, which is more consistent with the housing condition faced by the majority of Chinese households.
down payment in Shanghai. Down payment of at least 30% house prices prevents households of the bottom 40% from entering the market without assistance by their parents due to the ‘deposit gap’14. From this point of view, Beijing and Shanghai may suffer from severe affordability problem, where the monthly payment for buying a house of 70 square meters even exceeds the monthly income of the bottom 40% households. It is impossible for the bottom 40% households in these two cities to buy even a new house of 70 square meters.
Table 2.4 Per capita income and size of urban households by level in Beijing and Shanghai, 2011
Beijing1) Shanghai2)
Categorized by income level Income
(RMB) Households size (persons) Income (RMB) Households size (persons)
Low income households (20%) 15,034 3.1 17,206 3.06
Lower middle income households (20%)
23,551 2.9 24,824 2.92
Middle income households (20%)
28,949 2.6 31,414 2.87
Upper middle income households (20%)
36,621 2.6 40,771 2.87
High income households (20%) 63,292 2.5 70,067 2.76
Sources: 1) Beijing Statistical Yearbook, 2012 and 2) Shanghai Statistical Yearbook, 2012, released by Beijing and Shanghai
Statistical Information Net respectively.
Note: Monthly income per household could be calculated by (Income*Households size)/12.
14
The item of ‘deposit gap’ refers to the amount by which the average house price exceeds the amount that a household on the average income can borrow (see Wu et al. (2010)).
Table 2.5 Paying for new houses by installments for the bottom 40% groups in Beijing and Shanghai, 2011 70 m2 90 m2 Total payment (million RMB) Down payment (million RMB) Monthly payment (RMB) Total payment (million RMB) Down payment (million RMB) Monthly payment (RMB) Beijing 1.365 0.326 5, 691 1.756 0.419 7, 317 Shanghai 1.184 0.282 4, 932 1.522 0.363 6, 342
Note: 1) The average selling price of residential housing has risen to 15,516.91 RMB/sq.m in Beijing while 13,448.35 RMB/sq.m in
Shanghai in 2011. 2) The common installment payment methods of average capital plus interest method is used and the maturity of housing loans is assumed to 20 years. 3) Commercial loans used only without consideration of public accumulation fund loans for the ease of calculation.
2.3.3.2 Estimated results: using the price-to-income ratio
Using the data on average housing price, housing size per person, and average per capita income this study calculates the price-to-income ratios during the period 1987-2011 to measure the dynamic financial ability of Chinese households in purchasing new homes (see Appendix A).
Plotting the distribution of price-to-income ratios in Figure 2.6 indicates that the housing affordability problem had been particularly acute in two periods 1992-1993 and 2003-2011 with the price-to-income ratio more than seven. Drawing from the reported ratio of price-to-income the ability of first time home buyers to enter the housing market has been deteriorated over the past decades years. Higher housing price makes it particularly difficult to buy new homes for less well-off households (mainly young families).
4.674.795.08 5.84 6.30 7.277.14 5.365.745.65 6.176.386.166.286.126.196.15 6.927.317.19 7.56 6.59 7.747.44 7.12 0.00 1.00 2.00 3.00 4.00 5.00 6.00 7.00 8.00 9.00 87 88 89 90 91 92 93 94 95 96 97 98 99 00 01 02 03 04 05 06 07 08 09 10 11 Year R a ti o
Figure 2.6 The path of housing affordability measured by the price-to-income ratio Source: It is created based on data in Appendix A.
2.3.3.3 Estimated results: using the residual income approach
This study adds up the essential expenses on food, clothing, medical care, transportation & communication (T&C) and education to obtain a low-cost budget standard as a monetary level of necessities15 (see Table 2.6).
Table 2.6 The basic budget standards of urban residents, 2011
Budget item of necessities National
average (RMB) The bottom 20% households (RMB) The median 20% households (RMB) Food 5,506 3,332 5,467 Clothing 1,675 761 1,629 T&C 2,150 671 1,762 Medical care 969 1,063 911.03 Education1) 1,402 638 1,236 Subtotal 11,702 6,465 11,005
Note: 1) Education expenses are the basic costs of education after taking out of cultural recreation expenses.
Source: The Statistical Yearbook of China, 2012.
15
The statistics on housing affordability released by the Statistics New Zealand reports an adequate level of residual income (disposable income after housing costs are deducted) that is required for a household to meet other basic needs such as food, clothing, transport, medical care and education. The lowermost lives safeguard ordinance announced by China in 1999 gives the similar standard of necessities to sustain an adequate livelihood for urban residence.
Using per capita data on household income and expense enables to eliminate the effect of household size since any normative standard for non-housing items will increase monotonously with household size (Stone, 2006, p.172). For the average household, the annual payment (P&I) for a house of 70 square meters costs almost the entire annual deposable income of a household (see Table 2.7).
Table 2.7 Housing affordability on the residual income standard
National average The bottom 20% The median 20%
Per Capita Disposable income (RMB) 21,810 8,774 19,545
Annual payment for a house of 70 square meters (P&I) 1) (RMB)
20,307
Annual payment for a house of 90 square meters (P&I)(RMB)
26,112
Minimum cost of non-housing items (RMB) 11,702 6,465 11,005
Note: 1) The principle and interest should be paid annually after deducting the down payment.
Source: the Statistical Yearbook of China, 2012.
More specifically, the bottom 20% households have no chance to buy a decent house even they spend all of their deposable income, while the median 20% households cannot afford a decent house at their current income level. Not only the bottom 20% households, but also the median 20% households need assistances to realize their ownerships of houses.
Although China’s housing market has witnessed a great development over the past years, our assessments show that it is clear that China is suffering from a housing affordability problem no matter what measurement is used. Buying a decent home (around 70 square meters) for Chinese households will cost more than seven years’ savings. According to the Demographia (2013) criterion of housing affordability (as reported in Table 2.8), the current Chinese housing market has fallen down into the interval of severely unaffordable housing market although the calculating method used
in this study is a slight different from Demographia (2013). The Chinese housing market is becoming one of the least affordable housing markets in the world.
Table 2.8 The criterion of housing affordability
Affordable Moderately Unaffordable Seriously Unaffordable Severely Unaffordable the median house price / the
median household income
≤ 3.0 3.1 to 4.0 4.1 to 5.0 ≥ 5.1
Source: the 9th Annual Demographia International Housing Affordability Survey, 2013.
Moreover, the assessed housing affordability using the residual income measure shows that not only the low-income households but also the median-income households are suffering from pressures of housing costs. Facing this situation the Chinese government is required to ‘do something’ to ameliorate the housing affordability problem.
2.4 How to make housing more affordable
What might contribute to the deteriorating housing conditions in China? The affordability of housing is treated as a function of the costs of producing and financing housing, and of household income levels or purchasing power. Numerous interrelated factors may drive the decline of affordability, including an increased willingness and capacity to pay for housing due to increased incomes and more bank lending obtained. Concurrent increases in population, decreases in household size and increases in house size may further compound the affordability problem. The requirement of improving housing affordability is becoming an enduring issue that all governments have had to address. This section provides a review of overseas policies and programs to solve the housing affordability problem. Lessons can be drawn from multi-countries that are also facing housing affordability problems.
2.4.1 Experiences of other countries
2.4.1.1 Australia
Currently, Australia is in the midst of a housing affordability crisis (Beer et al., 2004). House price growth has continued to outstrip income growth to the point that more than one million low and middle income households are now experiencing housing stress (the Australian government, 2008). Yates et al. (2007) found that 65% of low-income private rental households were experiencing housing stress in Australia. As presented in Table 2.9, Australia has a housing affordability of 5.6 which is higher than other developed countries.
Table 2.9 Housing affordability across countries
Nation Affordable Moderately
Unaffordable Seriously Unaffordable Severely Unaffordable Total Median Multiple HK (China) 0 0 0 1 1 13.5 Australia 0 0 9 30 39 5.6 New Zealand 0 0 3 5 8 5.3 United Kingdom 0 2 14 17 33 5.1 Canada 8 17 4 6 35 3.6 Ireland 1 4 0 0 5 3.2 United States 100 87 13 16 216 3.1 Total 109 110 43 75 337
Source: the 9th Annual Demographia International Housing Affordability Survey, 2013 (p. 3).
In response to an emerging housing affordability crisis, the Australian government has built a series of new initiatives which aimed to improve housing affordability. As summarized by Wilson et al. (2010), the major new initiatives include:
1) First Home Saver Accounts – whereby bigger deposits can be saved through low tax superannuation-style savings accounts topped up by additional contributions from the government.
working with all levels of government to reform infrastructure and planning requirements.
3) National Rental Affordability Scheme – seeks to increase the supply of affordable rental dwellings by providing tax incentives to encourage investment in properties rented to eligible tenants at 20% below the market rate.
4) Land release – releasing surplus commonwealth land for development to increase the overall land supply (Australian Government, 2008).
2.4.1.2 The United Kingdom
The Barker’s Review of Housing Supply (2004) reveals that the U.K. has experienced a long-term upward trend in real house prices, 2.4% per year over the last 30 years which leads to affordability problems. Alternatively, Bramley (1994) argues that housing affordability in the U.K. has been deteriorated remarkably since the late 1990s, with housing price rising faster than income. A range of policy recommendations for improving the functioning of the housing market were proposed as follows16:
1) Providing support on the demand-side to help targeted groups of first time buyers through the Home-buy program17 and via joint equity loans with mortgage lenders;
2) Continuing to tackle the under-supplied housing through measures to increase the amount of surplus public sector land being brought forward for development, and through reducing construction costs via the competition to construct homes;
3) Providing stamp duty helps for home-buyers and continuing to provide support to those who are left homeless and vulnerable.
16
‘Housing policy: an overview’, reported by the Office of the Deputy Prime Minister, July 2005. 17
Being supported by this program, the householder could initially purchase an equity stake as little as 50% and then, in most cases, ‘staircases up’ to 100% ownership as their circumstances improve. Accordingly, when the householder chooses to sell the home, they receive a share of the sales proceeds proportionate to the size of their own equity stake.
2.4.2 Efforts of the Chinese government
The growing crisis in housing affordability due to the fact that the strongly growing demand has outpaced limited housing supply, and challenged governments of different levels that are required to ‘do something’ to make housing more affordable. A flurry of studies has recently emerged and suggests that the rapid decrease in affordability of Chinese housing markets is primarily due to supply constraints. The Chinese government has conducted a series of innovations with a strong volition to prompt the housing supply.
1) Increasing the gross of land supply for residential use
Demographia (2008, p47) regards supply constraints as the most important consideration that, ‘…Affordability of housing is overwhelmingly a function of just one thing, the extent to which government place artificial restrictions on the supply of residential land’. For instance, the newly announced five regulations provide that land supply for small and medium residential houses should be increased to stimulate effective housing supply. This regulation serves to improve the current structure of new construction through reducing the proportion of luxury houses and increase the proportion of common residential houses. Chen et al. (2010) argue that housing developers tend to produce large dwellings (more than 120 square meters), which leads to a mismatched supply structure and makes housing less affordable. Combining with other instruments such as the ratio of down payment and interest rate preference, this regulation aims to optimize the supply structure by stimulating the provision of common residential housing, while curbing the supply of luxury houses.
2) Discouraging speculative or investment-driven housing demand
The current regulations aim to encourage the demand of the first house and housing improvement while discouraging speculative or investment-driven housing demand by
different down payment and interest rate. The first time home buyers can enjoy preferences such as a 20%-30% down payment of the total housing price and discounted interest rates. In contrast, the bank is required to more strictly enforce rules on mortgages for second homes and the down payment of the second house is raised to 40%-60% to curb speculative demand for housing.
3) Shortening the process of administrative approvals
The current planning procedure is notoriously long. A lot of power rests in the hands of local authorities who are able to delay and block housing proposals. Take a recent innovation for instance; the rights to release pre-sale approvals of commercialized housing are further devolved to the county level according to the decision announced in 2012 by the State Council of China which aims to improve the speed of housing supply.
4) Increase the provision of public housing
The implementation of measures has been announced to encourage housing developers to produce affordable housing by reducing the financial cost and land cost.
Besides, the government has stepped up efforts to build and manage government subsidized housing, guaranteeing satisfactory housing for the low and median income households. The Comfortable Housing Project (‘Anju Scheme’), which was carried out in 1995, attempts to provide comfortable housing to medium and lower income households at a below market price. The Anju Scheme requires commercial banks to provide construction loans and the local government to provide free serviced land for developing low cost housing construction (Liu, p.139, 1998).
2.5 Concluding remarks
The mismatching housing market in China generates a soaring housing price which has gone beyond the financial capacity of urban residents nationwide. In spite of the Chinese government efforts to improve the housing conditions, it is widely acknowledged that the majority of its urban residents are still suffering from affordability problems. Considering the current income of households, the relatively high price of houses discourages the potential home buyers to enter into the housing market. Without any assistance from the government or relatives, buying a decent house is impossible not only for the low-income households but also for the median-income households.
Faced with the demand to ‘do something’ for the housing affordability crisis, the Chinese government has tried to solve the housing shortage by increasing effective housing supply and suppressing property speculation. But there are several obstacles that might discourage the government’s efficient policies. On the one hand, the governments’ efforts to increase land supply for construction use may clash with farmland protection. On the other hand, the pursuit of revenue obtained from land leasing surpasses the enthusiasm of governments to increase land supply for public affordable housing construction use. Thus, further study is required to examine whether the current housing affordability problem is caused by supply constraints. In particular, it is urgent to explore a cure to overcome the housing affordability problem. In order to fully understand the housing market of China and fill the existing research gap, next step is to explore the source of the housing affordability problem by estimating housing supply elasticity and its determinants.
CHAPTER 3
ESTIMATING THE HOUSING SUPPLY ELASTICITY AND ITS DETERMINANTS
3.1 Introduction
Housing constructions play a critical role not only in economic development, but also in affecting the household welfare. Given the importance of housing constructions, additional efforts in this field are thus justified. The vital importance of housing supply analysis for policy making has been stressed several times. For example, as Malpezzi and Maclennan (2001) argued, ‘…most housing models and policy analysis hinge on explicit or implicit estimates of the price elasticity of housing supply, does the market respond to demand side shocks with more supply or higher prices?’ In fact, the Chinese housing market has experienced rapid growth since the housing system reform implemented in 1998. As a result, the demand of housing was enormously stimulated. Afterwards, housing prices jumped from 1,854 RMB per square meter in the year 1998 to 4,725 RMB per square meter in 2010 (with an average annual growth rate of nearly 12%), and caused a genuine concern in recent years. Consequently, a series of regulations has been implemented by the Chinese government to intervene in the housing market and to avoid overheating and possible bubbles. The interventions include interest rates adjustments, reducing and exempting real estate taxes and fees, and reducing land rents. An evaluation on pros and cons of policies requires a thorough understanding of both sides of housing demand and housing supply. However, while there are already extensive studies which focus on the housing demand side, few attentions have been paid to the housing supply side.
This chapter focuses on the supply side. The reduced-form model and the stock-adjustment model are used to estimate housing supply elasticities. It examines the
housing supply determinants in the Chinese housing market. Several questions will be explored. First, how elastic is housing supply in China? Second, do the reduced-form model and the stock-adjustment model show the same housing supply elasticity? Finally, does land regulation plays a crucial role in affecting housing supply elasticity?
The following section summarizes the existing literature. Section 3 discusses the methodology. Section 4 shows the estimated results. The final section discusses the main findings.
3.2 Previous Research
A comprehensive review of the previous studies can be found in DiPasquale (1999), who provides an excellent summary of the issues on the housing supply. This study discusses current studies on the latest developments in economics of housing supply. It pays particular attention to the most-recent studies which focus on the supply of housing in China, and in particular on the following disquieting issues. What is known concerning the approaches of housing supply research? What is the appropriate functional form for housing supply equations? What is known concerning determinants of housing supply? What appear to be the major determinants of the estimated housing supply elasticity in the previous studies?
One of the major continuing questions concerning housing supply is just how sensitive supply is to changes in prices. A perfectly elastic housing supply is supported by the earlier studies of Muth (1960), Follain (1979) and Stover (1986). Muth (1960) is generally cited as the first empirical research on the relationship between housing prices and housing supply. Using a regression model and the national data, he attempts to examine the relationship between new housing outputs and housing prices in the United States, but finds no statistically significant relationship. Alternatively, Follain (1979)