Spatial Pattern of Population Movement in
Korean Regional Hierarchy
著者
CHANG Yang, Yi, CHOI Won, Hoe
雑誌名
The science reports of the Tohoku University.
7th series, Geography
巻
56
号
1
ページ
49-66
発行年
2009-03
URL
http://hdl.handle.net/10097/45273
Spatial Pattern of Population Movement
in Korean Regional Hierarchy
Yang Yi CHANG* and Won Hoe CHOI**
Abstract This article analyzes the spatial pattern of population movement in Korean regional hierarchy. The city-county consolidation became effective in
1995, and the current administrative districts were created. The urbanization stage for Korea was considered to reach the terminal stage after 1995. Thus, this research is deemed necessary at the terminal stage. For this, the first and second flows were extracted, and horizontal and vertical analysis was carried out using population size data and population movement data. As a result, the hierarchy of Korean regions is separated into five levels. With regards to population movement, the primate city Seoul is a first order hierarchy. Metropolitan cities like Busan, Daegu, Incheon, Daejeon, Gwangju, and Ulsan are second order hierarchy. Third order hierarchy cities a 0.5-1 million population size, the fourth order hierarchy cities a 100,000-500,000 size, and the fifth order hierarchy cities less than 100,000 size. On the other hand, the population movement has four patterns. The patterns are separated as move-ment to Seoul, to a higher hierarchy, to an equal hierarchy, and to a lower hierarchy. The population movement to metropolitan cities is mainly included in the movement to a higher hierarchy.'
Key words : spatial pattern, population movement, regional hierarchy, Korea
1. Introduction
1.1 Purpose
Currently, more than 80% of the population in Korea lives in urban areas'. According to the [Environmental Statistics Yearbook of Korea j, the state of urbanization is in its terminal stage. This state started in 1995 when the population in urban areas reached 78.2%. Especially since 2007, more than 20% of the population lives in Seoul and 48.8% dwell in the capital region. Considering the dimensions of the capital region, which is 11.8%, it can be said that Korean population is concentrated in a very limited area2. There is therefore a need for research regarding the Korean regional hierarchy and population movement.
* Graduate school, Institute of Geography, Tohoku University, Sendai 980-8578, Japan ** Faculty of Geography Education , Kongju National University, 189 Gongju, South Korea Science Reports of Tohoku University, 7th Series (Geography) Vol. 56, Nos. 1/2, 2009, 49-66
In Korea, the system of cities and phase of change have been an important theme in each decade since the 1970s. However, the research related to the short term terminal urbanization stage has not been carried out. Therefore, analysis of the hierarchy transition at the terminal urbanization stage was carried out in the present study for whole regions using data from 1996, 2000 and 2005. Based on this, the interaction between entire regions of Korea can be grasped. In 1995, the city-county consolidation became effective, but research dealing with whole regions has not been carried out. After analyzing the hierarchy of Korean regions, the patterns of popula-tion movement were investigated. There have been many studies that have referen-ced patterns and reasons for population movement, but in this article, our focus is on the hierarchy of regions rather than population movement. The population was analyzed in relation to whether there was movement to higher or lower levels. Through this, the Korean regional hierarchy and population movement patterns could be identified. The results from this study can be used as the basic framework for regional policy.
1.2 Data
Drawing from literatures, the indicators of population movement/migration, bus networks, passengers, telephone calls, and financial activities were used for classifying the hierarchy. Among these, population movement was selected, for it occurs com-monly everywhere in Korea. I then analyzed the movement patterns. There are two different sources of population size data in Korea, 'Registration population' and 'Cen-sus population' data. For this study, 'Registration population' data were used because it is annual data and is related to movement data, as opposed to 'Census population' data which are gathered only every 5 years. 'Registration data', for both Koreans and Foreigners exist, and the total data was used. The data from 1996, 2000, and 2005 were used to identify the regional order after 1995.
Population movement data were used for the classifying hierarchy of each region and for finding out features of movement. These data were obtained from 'Regional migration' data by the rKorean National Statistical Officej and were used together with population size, data from 1996, 2000, and 2005. In-migrants and out-migrants appeared in these data. In-migrant data were selected to create the OD matrix. Based on the arrangement of original data, the horizontal axis of the OD matrix corresponds to departure and the vertical axis to origin, whereby departure (D) and origin (0) are entire regions.
The ratio of movement from origin to departure was evaluated with P(D)/ P(0)* 100. The best value is the movement of the inside region. As the goal of the present study was the interaction of each region, the movement of inside cities was ruled out (the best ratio appears through the diagonal because it means movement of inside city).
Table 1 Ratio of movement for each region Origin 1St flow 2' flow Origin 1St flow 2" flow Seoul Goyang 2.57 Incheon 2.27 Pyeongtaek Seoul 6.83 Anseong 5.48 Busan Seoul 4.23 Gimhae 3.16 Dongducheon Seoul 12.64 Yangju 9.54 Daegu Gveongsan 4.37 Seoul 3.31 Ansan Seoul 9.21 Siheung 6.47 Incheon Seoul 8.14 Bucheon 3.46 Goyang Seoul 21.58 Paju 7.57 Gwangju Seoul 5.35 Naju 1.71 Gwachoen Seoul 24.27 Anyang 17.06 (omitted) (omitted)
Source : Korean National Statistical Office Digital Publication (2005)
Note : These data are an example from 2005.
Hence, except for movement of inside city, the best ratio became st flow' and the second became '2' flow.' These were chosen for the direction of the moving interac-tion. According to example data from Seoul 2005, the best value is for Seoul to Goyang (2.57%) and the second value is to Incheon (2.27%). Therefore, to Goyang became a first flow and to Incheon became a second flow. In this way, the first and second flows of Korean regions were extracted and are shown in Table 1.
The Korean regional order, hierarchy, and population movement patterns were derived from these data regarding population size and population movement. To carry out this task, three figures were made. First, the Rank Size Rule for Korean regions in 1996, 2000, and 2005 were developed to grasp the transform of population size. Second, 'nodes of each region' were made by separating the 1st and 2' flows in each year. This shows the hierarchy and movement pattern. Third, the movement was displayed on the map to show the regional distribution patterns. For these, origin number for each regions, 1-167, were attached to regions that have existed since 1996, and the disappeared or created cities were attached after 1683.
1.3 Korean administrative district
Each Korean region is currently classified as either a Special city, Metropolitan city, Province, or Special province. There is one Special city, Seoul, and six Metropol-itan cities Busan, Daegu, Incheon, Daejeon, Gwangju, and Ulsan. The Metropolitan cities have population of at least a million. Each province has several City and Kun. The City should have a population of more 50,000 and the rest are Kuns (Kun has less than 50,000). Jeju-island is a Special province. Thus, Korean whole regions were separated into Special city, Metropolitan city, City, and Kun after the city-county consolidation of 1995. This article deals with every region and classifies them hierar-chically.
2. Analysis of Korean regional hierarchy
2.1 Population size and its change in Korea
After city-county consolidation in 1995, the number of Korean regions did not change significantly. There were 167 in 1995, 165 in 2000, and 167 again in 2005. This is because Yeocheon City and Yeocheon Kun were merged into Yeosu in 1998, and Jincheon and Geryong became a Kun and City, respectively, in 2003k.
Figure 1 shows 'the rank size rule of Korean regions'. The graphs have not changed significantly from 1996 to 2005. However, the populations for regions of more than 100,000 have increased, while those with less than 100,000 have decreased. This means that those living in cities with population of less than 100,000 population have moved to cities with population larger than 100,000. In particular, the popula-tions of cities located in the capital area and that have a more than 500,000 population size have grown significantly.
The populations of Seoul, which is capital city, and Busan, which is second city, have decreased by 170,000 and 220,000, respectively, but they are still first and second cities. The populations of local central cities with population of 100,000-300,000 have grown by approximately 10% (1996,-2005). Based on the populations from 1996
10,000 population (10thousand) 1,000 100 10 1 1996 2000 2005 0 50 100 150 Rank Fig. 1 Rank size rule of Korean regions
---2005, Seoul has larger than twice the population of Busan, and it can be said that a
`Primate urban s
ystem' appeared in Korea even though the population of Seoul has
actually decreased.
The hierarchies has 6 categories, at the transition of population size in 1996, 2000
and 2005 ; © more than 10 million (Seoul), © 3-10 million (Busan), C) 1---3 million
(metropolitan city), C) 0.5-1 million (central cities which population increased
large-ly), C) 100-300 thousand (local medium-small cities, population increased) , © less
than 10 thousand (population decreased).
However, these divisions are based simply
on population size, while the interactions between each region must be understood to
classify the hierarchy.
2.2 Classification of the Korean regional hierarchy through population movement
An OD matrix was drawn on the graph, whereby a vertical structure of population was revealed. The horizontal axis is the distance in a straight line from Seoul (`0'). In the graph, based on the latitude of Seoul , regions that are located on the left side of Seoul are on the left of the datum point and those on the right are on the right-side . The vertical axis of ordinates corresponds to the population size. Thus , this graph represents the regional population distribution and regional location in relation to Seoul. Seoul is located on the western side of Korea, so, right-side regions are more than left-side in the graph. Based on the above, the first and second flows of 1996, 2000, and 2005 were nested, as shown in Fig. 2.
According to Fig. 2, the increasing numbers of people moved from cities with small populations to those with a larger population. Considering all first and second flows, movement to Seoul is the highest, but there are also high values corresponding to movement to various metropolitan cities.
Most of the regions in Korea have populations of less than 100,000, although movement from these regions points toward ones with more population . Regions with population of 100,000-500,000 also have population movement toward those with larger populations. In the case of 0.5-1 million regions, there is movement toward regions of the similar size and be moved from the vicinity with population less than 500,000. Regions with populations 1-10 million regions are metropolitan cities , and there is a great deal of influx from neighboring regions. It can therefore be said that these regions are central cities in their provinces.
According to population size, Busan is the second largest city, but based on population movement, it is not. That is because, Busan does not have more 'origin (0)', than Daegu or Gwangju, and it exists on the same level as other metropolitan cities.
Seoul is the largest city in Korea, with a population of more than 10 million , and has the most 'origin (0)' from not only the vicinity but also all provinces , so it can be
1996yeai 1st flow Po:Own
I
1
!illTA
711
CI u.--,
,
,.„....;
//,
/ //
_di/
lt:'
Seoul 1996year 2nd lbw Av.,* 5GG .,(C 1i )
, / 4
•//` ,/ it., -Al - ^
iii ,,,
/ , I
,,,,,,,.1?j
„, ,i.,/,0''3l'II
i•Ia, ..• '....,/ 1?
,4„,y)/-i:-,
o, 2000year 1st flow111244.,nerl
” % 4 7.1 46 , 4144,7/71
1/ 114'
/ 171/124',,
I,11.
!"'..h'--.
' - 1 ' A 2000yeaf 2nd tlow1
11
.//
./.;
/
//ii
y,,..
•. .,. .,.' ,,„,',... /.,.:,..'/..,/i,?
/:...t,;.,'41,--,
/1
y .4.
/
II
'414, ..,!„,,,,,,.;, ,,,„.., 14; ..,.., IA ,,,,,., ,....-.,,1-,,,I..i.ot.,
41— ,3e,'- -.x. . 2005yea2ndHow 2005yein 1st fkow 1M> 1 , .. 4! . 50,1 . SW '-`' 4 / . 4 e,1\\,
,,
ir,
,,i ,..,'/I
,.',./i
'' I I, \Ail i 1
.1
. rn. . I r , ittr
I
' ' / 1 V Ye'.
''
1,
11
4,1\ ..( fli
' • u - .,. A ;,sio i -.7,
.1,,,,,1i,,) .1.,.
1
1,,,,..„
..,,14,lko,1,,,I.0:,1,I
„vtmqico1d
,„7„.,,,,,,,
,.t.,,i,ti.
L
,/,,,,,,/fry,,11,1.^01,,),,,
/,.i/,7-4'11,.1‘\
,1iI-
i-ff/111:11,,vAil-1,,rot,
r.,-,ii.-... ...4 .li,.-,1-1-'' ,. , ,1 ,,1. ,6 . ,,i0.--- -'' a .,J, - ic. .-„,i,
Fig. 2 Nodes of each regions withpopulation movement
Source : Korean National Statistical Office Digital Publication (1996, 2000 and 2005)
\ 4 , ( 400 11 Ill IV V
Table 2.1 Korean regional hierarchy and cities at each level (1996) Hierarchy II ITT IV V Population size (10 thousand) more than 1,000 50-100 10-50 less than 10 Total City Seoul
Busan, Daegu, Incheon, Gwangju*, Daejeon
Suwon, Seongnam, Anyang, Bucheon, Ansan, Goyang, Cheongju, Jeonju, Pohang, Ulsan
Uijeongbu, Gwangmyeong, Pyeongtaek, Guri, Namyangju, Siheung, Gunpo, Uiwang, Hanam, Yongin, Paju, Icheon, Hwaseong, Pocheon, Anseong, Gimpo, Chuncheon, Wonju, Gangneung, Chungju, Jecheon, Cheongwon, Cheonan, Gong-ju, Boryeong, Asan, Seosan, Nonsan, Dangjin, Gunsan, Iksan, Jeongeup, Gimje, Mokpo, Yeosu Suncheon, Naju, Gwangyang, Gyeongju, Gimcheon, Andong, Gumi, Yeongju, Yeongcheon, Sangju, Gyeongsan, Changwon, Masan, Jinju, Jinhae, Tongyeong, Sacheon, Gimhae, Miryang, Geoje, Yangsan, Jeju
Dongducheon, Gwacheon, Osan, Yangju, Yeoju, Gwangju**, Yeoncheon, Gapyeong, Yangpyeong, Donghae, Taebaek, Sokcho, Samcheok, Hongcheon, Hoengseong, Yeongwol, Pyeongchang, Jeongseon, Cheorwon, Hwacheon, Yanggu, Inje, Goseong, Yangyang, Boeun, Okcheon, Yeongdong Jin cheon, Goesan, Eumseong, Danyang, Geumsan, Yeongi, Buyeo, Seocheon, Cheongyang, Hongseong, Yesan, Taean, Namwon, Wanju, Jinan, Muju, Jangsu, Imsil, Sunchang, Gochang, Buan, Yeocheon, Damyang, Gokseong, Gurye, Yeocheon, Goheung, Boseong, Hwasun, Jangheung, Gangjin, Haenam, Yeongam, Muan, Hampyeong, Yeonggwang, Jang-seong, Wando, Jindo, Sinan, Mungyeong, Gunwi, UiJang-seong, Seongsong, Yeongyang, Yeongdeok, Cheongdo, Goryeong, Seongju, Chilgok, Yecheon, Bonghwa, Uljin, Ulleung, Uir-yeong, Haman, ChangnUir-yeong, Goseong, Namhae, Hadong, Sancheong, Hamyang, Geochang, Hapcheon, Seogwipo, Bukjeju, N amjeju the number of cities 1 5 10 57 94 167
Table 2.2 Korean regional hierarchy and cities at each level (2000) Hierarchy III IV V Population size (10 thousand) more than 1,000 100-1,000 0-100 10-.--50 less than 10 Total City Seoul
Busan, Daegu, Incheon, Gwangju, Deajeon, Ulsan
Suwon, Seongnam, Anyang, Buchoen, Ansan, Goyang, Cheongju, Jeonju, Pohang, Changwon
Uijeongbu, Gwangmyeong, Pyeongtaek, Guri, Namyangju, Siheung, Gunpo, Uiwang, Hanam, Yongin, Paju, Icheon, Hwaseong, Gwangju, Pocheon, Anseong, Gimpo, Yangju, Chuncheon, Wonju, Gangneung, Chungju, Jecheon, Cheon-gwon, Cheonan, Gongju, Boryeong, Asan, Seosan, Nonsan, Dangjin, Gunsan, Iksan, Jeongeup, Gimje, Mokpo, Yeosu, Suncheon, Gwangyang, Gyeongju, Gimcheon, Andong, Gumi, Yeongju, Yeongcheon, Sangju, Gyeongsan, Masan, Jinju, Jinhae, Tongyeong, Sacheon, Gimhae, Miryang, Geoje, Yangsan, Jeju
Dongducheon, Gwacheon, Osan, Yeoju, Yeoncheon, Gapyeong, Yangpyeong, Donghae, Taebaek, Sokcho, Sam-cheok, Hongcheon, Hoengseong, Yeongwol, Pyeongchang, Jeongseon, Cheorwon, Hwacheon, Yanggu, Inje, Goseong, Yangyang, Boeun, Okcheon, Yeongdong, Jincheon, Goesan, Eumseong, Danyang, Geumsan, Yeongi, Buyeo, Seocheon, Cheongyang, Hongseong, Yesan, Taean, Namwon, Wanju, Jinan, Muju, Jangsu, Imsil, Sunchang, Gochang, Buan, Naju, Damyang, Gokseong, Gurye, Goheung, Boseong, Hwasun, Jangheung, Gangjin, Haenam, Yeongam, Muan, Hampyeong, Yeonggwang, Jangseong, Wando, Jindo, Sinan, Mungyeong, Gunwi, Uiseong, Seongsong, Yeongyang, Yeon-gdeok, Cheongdo, Goryeong, Seongju, Chilgok, Yecheon, Bonghwa, Uljin, Ulleung, Uiryeong, Haman, Changnyeong, Goseong, Namhae, Hadong, Sancheong, Hamyang, Geo-chang, Hapcheon, Seogwipo, Bukjeju, Namjeju
the number of cities 1 6 10 57 91 165
Table 2.3 Korean regional hierarchy and cities at each level (2005) Hierarchy II III IV V Population size (10 thousand) more than 1,000 100-1,000 50-100 10-5C less than 10 Total City Seoul
Busan, Daegu, Incheon, Gwangju, Deajeon, Ulsan, Suwon
Seongnam, Anyang, Buchoen, Ansan, Goyang, Yongin. Cheongju, Cheonan, Jeonju
Uijeongbu, Gwangmyeong, Pyeongtaek, Guri, Namyangju, Siheung, Gunpo, Uiwang, Hanam, Paju, Icheon, Anseong, Gimpo, Hwaseong, Gwangju, Yangju, Pocheon, Chuncheon, Wonju, Gangneung, Chungju, Jecheon, Cheongwon, Gongju, Boryeong, Asan, Seosan, Nonsan, Dangjin, Gunsan, Iksan, Jeongeup, Mokpo, Yeosu, Suncheon, Gwangyang, Pohang, Gyeongju, Gimcheon, Andong, Gumi, Yeongju, Yeongcheon, Sangju, Gyeongsan, Chilgok, Changwon, Masan, Jinju, Jin-hae, Tongyeong, Sacheon, GimJin-hae, Miryang, Geoje, Yang-san, Jeju
Dongducheon, Gwacheon, Osan, Yeoju, Yeoncheon, Gapyeong, Yangpyeong, Donghae, Taebaek, Sokcho, Sam-cheok, Hongcheon, Hoengseong, Yeongwol, Pyeongchang, Jeongseon, Cheorwon, Hwacheon, Yanggu, Inje, Goseong, Yangyang, Boeun, Okcheon, Yeongdong, Jeungpyeong, Jin-cheon, Goesan, Eumseong, Danyang, Geryong, Geumsan, Yeongi, Buyeo, Seocheon, Cheongyang, Hongseong, Yesan, Taean, Namwon, Gimje, Wanju, Jinan, Muju, Jangsu, Imsil, Sunchang, Gochang, Buan, Naju, Damyang, Gokseong, Gurye, Goheung, Boseong, Hwasun, Jangheung, Gangjin, Haenam, Yeongam, Muan, Hampyeong, Yeonggwang, Jang-seong, Wando, Jindo, Sinan, Mungyeong, Gunwi, UiJang-seong, Cheongsong, Yeongyang, Yeongdeok, Cheongdo, Goryeong, Seongju, Yecheon, Bonghwa, Uljin, Ulleung, Uiryeong, Haman, Changnyeong, Goseong, Namhae, Hadong, San-cheong, Hamyang, Geochang, Hapcheon, Seogwipo, Bukje-ju, Namjeju the number of cities 1 7 9 57 93 167
considered a first level city. Hence, the hierarchy of Korean regions can be considered to have five classifications. These classifications are as follows :
C)more than 10,000,000 (Seoul), C) 1,000,000-10,000,000 (metropolitan city), © 500,000-1,000,000 (local central city), C) 100,000-500,000 (local medium city), © less than 100,000 (region which experienced population decrease and no influx).
As a result, the numbers of regions at each level of the hierarchy are 1-5-10-57-94 in 1996, 1-6-10-57-91 in 2000, and 1-7-9-57-93 in 2005. This results shows that hierarchy is stable, as postulated in Christaller's concept. As can be seen, there is no massive change between years. But the regions' hierarchy has changed a little. The regions that have experienced a shift in hierarchy are as follows ;
C) 1996-.2000 :
Ulsan 3,2, Changwon 4,3, Gwangju(city) 5,4, Yangju 5,4, Naju 4,5
0 2000,2005 :
Suwon 3,2, Yongin 4^3, Cheonan 4,3, Pohang 3,4, Changwon 3,4,
Chilgok 5-.4, Gimje 4,5, Jeungpyung 5, Geryong 5(newly)
Note : Each number refers to the hierarchy
3. Patterns of population movement in the Korean regional hierarchy 3.1 Pattern of population movement
Figure 2 shows the population movement patterns. The movement to Seoul has the highest value, and many of the other movements point toward a higher hierarchy. Even if the percentage was low, the movement in equal and to lower hierarchy is found. Therefore, four population movement patterns in the Korean regional hierarchy can be identified as follows :
C)To primate city Seoul
C)To a higher hierarchy except for Seoul C To an equal hierarchy
C) To a lower hierarchy
3.2 Tendency of each pattern
The four patterns have changed each year. But there are only 5-year intervals to show the transition, and the changes are not exceptionally large. This necessitates a detailed numeral analysis.
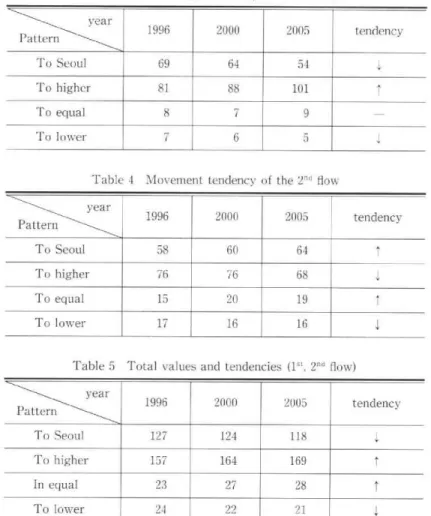
Table 3 shows the movement tendency of the first flow. The tendency shows both increases and decreases in regional amounts (1996,2000,2005 : 167-J65,167). The movement toward Seoul shows the highest value as a single region, but it shows a
tendency toward some decrease. In contrast, the movement to higher hierarchies other than Seoul shows an increased tendency, and this value is the highest among the four patterns. The movement to equal hierarchies remains the same and to lower hierarchies is decreased. Based on these results, it can be said that Korean people primarily migrate to metropolitan cities in their own province.
According to Table 4, the second flow of movement to Seoul is also the highest value for a single region, and the tendency is increased . The movement to higher hierarchies other than Seoul is decreased, especially from 2000 to 2005. The move-ment to equal hierarchies is increased and to lower is decreased . In the second flow, the movement to higher hierarchies is the highest value among the patterns .
Table 5 shows on the total values and tendencies of the first and second flows, and
Table 3 Movement tendency of the 1" flow
Pattern year To Seoul To higher To equal To lower 1996 69 81 8 7 2000 64 88 7 6 2005 54 101 9 tendency
Table 4 Movement tendency of the 2rd flow
Pattern year To Seoul To higher To equal To lower 1996 58 76 15 17 2000 60 76 20 16 2005 64 68 19 16 tendency
Table 5 Total values and tendencies (1St flow)
Pattern year To Seoul To higher In equal To lower 1996 127 157 23 24 2000 124 164 27 22 2005 118 169 28 21 tendency
it shows an overall trend. The movement to Seoul and lower hierarchies is decreased, but to higher hierarchies other than Seoul and equal hierarchies is increased. Hence,
population movement in Korea tends toward higher hierarchies and especially for metropolitan cities and Seoul. These two patterns have appeared mainly in Korea. Movement to Seoul, however, shows some decrease, despite the overall increase in movement to higher hierarchies.
3.3 Features of population movement on the map
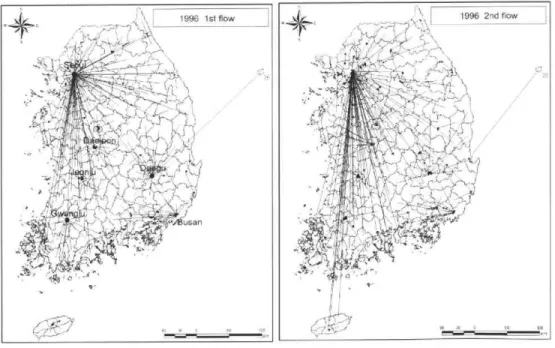
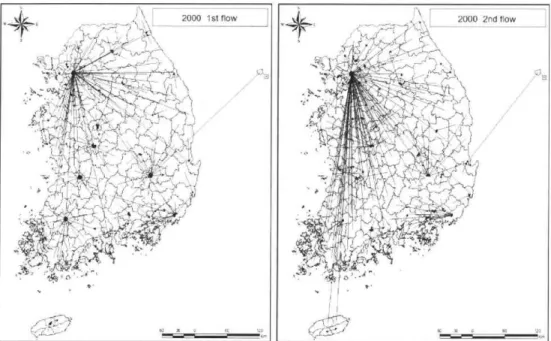
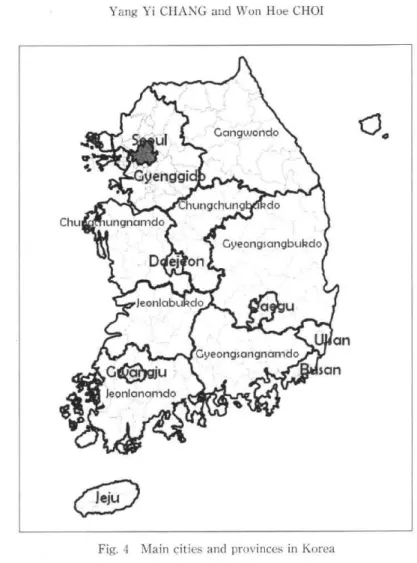
In Fig. 2, the characteristics of vertical structure are revealed. In the mean-time (Fig. 3), the horizontal features of movement between regions are revealed. The locations of each region are shown in Fig. 4 with their original numbers.
On the left side of Fig. 3 is the first flow. Each figure for 1996, 2000 and 2005 shows a very similar pattern. In the aggregate, movement is toward Seoul. But there is also a strong tendency toward concentrations moving to metropolitan cities. These cities are central cities and have the highest populations in their area. Except for Incheon and Ulsan, which are close to Seoul and Busan, respectively, the movement is toward metropolitan cities such as Busan, Daegu, Daejeon, and Gwangju. In the case of Chungcheongbukdo and Jeolabukdo provinces, movement is toward Cheongju and Jeonju, which have the highest populations in their area. In the capital area, a
,! \ 1 1996 1st flow ''';'' ,-,J.-, :677ja.:4?7:1,,----f---).' i;‘..,,..--',4---,--lr— vi
l, lekvt.::
ri
. • I, . •, ...A-4-7.45.
... -.'...,,4.:,...,..14›:i
,...,Ttk--..._b:-.,-,\., -r.,-,-.usan44.'.
.. !,'-',,n.7,'
-,-111-
4',
s? t,adk.-Y. • 0,2 1 5.02,0, \..-12,1
_,,.17,..;:•"4,('''-.:1\
1996
• \ i-- - ''''''-:'-ti: '-'-. ''' '",,:,..-.7.9.;•
'f'ili.iV
.' :S.:'2.7-.-
. '?L'''.---:;;?;-
_, ---.. !
— ' ,Li
-ocilli,'‘'
, Aliot•,.,',,,'
.',,-.-,'":9._.•-,=
.., sr.- ._
.„..•:.- ,
_
-,t---,
i
.. ,,, r,/,,_ AI •.. • ,•,, (,---•,„.,....„---„ ,, ! •,--..,11, ,•. ,,,:,,-•,,----,,....1.,,-'.,,0 ::-7 . -,. . ,Iv,
....,,,K.,.:4,4110.,,
4.1,6,,\..,..iiii....-
i-'1";Y4 i,'.u,4.11.
.!:-:..-
.;:k...,1/2 !-.4 _.: 2. • i+ 1.! 30 10 ED 1210 ,,,1 \ 2000 isi flow
,„1...
:T.-673..v.),...:,:
„Le..
,,----•.,,,,\\,
74 ,
'TA*
't7 .',,
..:,,,
.L-Aw-,,-...S.41F,---c___
, •
.
„ ?(.4•;;„:...,74%.
_ -'.__L,.
.,:•,__
vL, `)
..
14.
, 14,37 .. :;.^.,
,, . - -..;:
_z__?"-.) ,
•.-:. li-.-,
. ... ik, c
, -,,,,, ,:.,
., -,,--_
it:-..:/', '", •••/;
, H..-r'1,=(-
/*,:,•-,..
„ '•,',
,J
"
.- , ''''k Si' 't•'',-
• :4-,,.-
,:;14.-•
• , ,',,,:".
• '''''.7't\t,•1--;
"..-s'-`1,
I .A:-.7,\,-1,:
• .--.:_.•-•,-.4
-,-._;.4 , ,,--,,,..x.,,:, .__,‘• ••, .• lis \.,, -,._,•--f,'.:
,•
,.:."-'11-)--3)...,c-
i ?C--1`;:i
, 4j1.
.) 4
, ,,,•:
.,_.•
../ ...„..„.„--,,•,
4,,.
• -:. 4,.__I,•,.6 , -, ‘,---_-L-,,,c•---,,-_,.:.,) -...,..,. - --,--.•:.;p.-_•:, \,.. .-,--. ..-...., , f /.E, , i",‘''.t -t• -- ".&'-::: '''
0
.
...-...!i„..;,'1.:A*2---1
• '
50 60 2CU `\ 2000 2nd flow --;•;• iii,..41•4 .-- ---- • .... °6tAlrilkAhba.. '`, ' 1 ..-..r., Ali :-.'1..'•'•• -..11Ce., --- . A .).1,i it*' ''-%t
,\ ')''
- • )
..
'
' -•
: -, ''' 4
't ' APitV‘tiiik
'' "'-'17-1-C.'1
' •..
,11.4w.
"\-
'-..,-.-,,: .':' / ./-•
li104\1'
c..•fii;.0144'--41'-;::<-'-'
-4,,,,041,•-4-7.,.,
....,foll,q
.uir,-
'116111111
,..:.'!,i1 1 k mg _A , , ' , ._: , :,,,... ,,,,,....,e, -,,. •-,4, - , .--•-, . „ '.' .. .,' ' 4111111
'-,•
,
144M
,',...,-'
`,., •t;,...,!,
1100110
'N,1-/
,,. It,•'.,;;AC:i^-fL:
7 :
.
4:'•*.VHO
-4-
, ..-'
iirall.t.4'
'''#' ' 1LX", • '-' ' .:iii-.. • , 1.-*.': . ,...„-.1r0-.-• °". . i 5 10310BOtza ^^•^,..n [ \ 2005 ,, -' ,r'.i.,, 5‘,4:--,r'''"I'T''•\. ,,r7,,,,r „,";:,' ;'i • ::.::--,,,, ,,2-,7 - --.4 ',:,-'/,''
•
l'i ''''',
' '-:-P-'
,•'''.k.P:'-<-
Ll
:.1,1-,,
•
iil
, i ..„ en:i
_ly
-F
,, ;Th , ;
•-: • :11•--.'1,2 ,04, _ '-....„, -T- ,,,t . •,, ...,_ ,.,',,,-i !, 1_, -77.• '".4-. „ _ , -,._.. . --11.---„1,•. --.. i;,
, T`f'1--;
..-, . • •,.4 )-2 ----,
.., --,- ,,-
$
. 7...7? •'At -
ti
'' • .4.'
'''V'7•
A.
j '
....4••.•
• •.•
8`-'4.-,-,
, ..0 .7::1A<Il BO ,11 . 1st flow / 50 120 ,_ l 2005 2nd flow*.
)
A---:----1.----)13.\
,,,, .. .. {„/„. /.;.‘",(?--\
-•z •.--''C;I-1-.,^44.4...•-.\---"-rr''-.•,
,
ofit,
'.
.T;47.7.-,T---c--.',,E
..,:-._--741:-=-,:.-,,‘),
i'
Z.r '' . .' :,' - - ' i.' \ '''''''Ve. :' •--.- ...1'' ,.. '-'?",f__ ---';'(.'j.,
6'C'T
' oidfitire-,,
• •-•
,...f...
_.-
-4'1,
,•-•-••
,,' , .i.ott .",, •..-.. • _,. .• , IC , - ••,, . •- . ., -: ' 0' ' • -i,/, 4.,',..,..-*:---
. --
..,
. , 41
.: k ' ',' i ,, clietc-:"'•
'
-••
••
4
.-i'''.ki,,,-
'7.0 --'•--.‘---,:0;
.. i4:04-'
t1;4....
1
„ . ..,:*i,_•,Ar. ..*,l'...' :....::Z,1,'' .V
k$4.
"'" ':' 0...,,3'•..,,' 1
' '-
i 1-:)
00.r,60
120
Ch
an
18)
Jeju
Fig. 4 Main cities and provinces in Korea
comparison of 1996 and 2005 shows that movement inside the capital area has in-creased.
The second flow, on the right side of Fig. 3, shows concentrations of movement toward Seoul and central cities of each province. In particular, the movement from Jeolanamdo and Jeolabukdo (south-west side) with their population of less than 10 thousand to Seoul can be noted. This tendency is particularly clear in 2005. But compared with the first flow, the concentration tendency to each metropolitan city was dispersed. In other words, the concentration to metropolitan cities was most apparent in the first flow, but the concentrations move not only toward metropolitan cities but to also regional medium size cities in second flow. It can therefore be said that the concentrations to metropolitan cities was mitigated in the second flow.
observed. In the case of Daegu, a distribution of origins shapes circle in the first flow, but shapes sector in the second flow. This means that origins are distributed in a
limited area of the administrative district in the province of Deagu. In Busan, the movement from its administrative province tends to appear more strongly. This phenomenon may be concerned with locality, so, further research is required.
4. Concluding remarks
4.1 Classification of the Korean regional hierarchy
The Korean regional hierarchy and the patterns of population movement were revealed from analysis of movement data from 1996, 2000, and 2005. The hierarchy of Korea was found to have 5 classifications, since it cannot be said that Busan has taken the place of a second city with regard to population movement. It is a stable hierarchy since the number of regions decrease as one goes to a higher hierarchy. Since the primate city Seoul has more than twice the population of the second city Busan, a 'Primate urban system' appears.
4.2 Patterns of population movement in the Korean regional hierarchy
The hierarchy of Korean regions was divided into 4 ; movement to Seoul, move-ment to a higher hierarchy other than Seoul, movement to an equal hierarchy, and movement to a lower hierarchy. The movement tended to be primarily to Seoul as a single city, but in general movement to a higher hierarchy has the highest value with regard to movement patterns. Considering the first and second flows, compared between each year, the movement to Seoul decreased and movement to a higher hierarchy increased in 2005. Form a regional perspective, the increasing concentra-tions appeared primarily in metropolitan cities and mostly occurred with the first flow. In this article, the Korean regional hierarchy and population movement patterns were analyzed. Hereafter, the analysis of movement motivation which has been revealed in this research will be necessary.
Acknowledgements
The author wishes to thank Prof. Choi W.H. of the Faculty of Geography Education of Kongju University for the teaching. This article is based on Prof. Choi's idea.
Notes
1) This rate is based on a city with a population size of more than 500,000. : Including cities of more than 200,000, the Korean urbanization rate exceeded 90% in 2007 fEnvironmental
Statistics Yearbook] of Korea.
2) The population values and dimensions for 2007 are based on the rKorean Statistical Yearbook] by the Korean National Statistical Office.
3) This data is attached at the end of article.
4) This data is used by the Korean National Statistical Office, Special city, Metropolitan city, City and Kun were included. It included entire Korean regions and a method of movement
data separation.
References
Choi, J.H. (1987) : Urban System and the Spatial Structure of Financial Activities in Korea, Geography education, Korea, Vol. 18, pp. 94-124.
Choi, W.H. (2005) : The Regional Structure of Chungcheong Sphere in South Korea, The Korean Geographical Society, Vol. 49, pp. 336-354.
Choi, E.Y. (2004) : Migration Selectivity and Growing Spatial Inequality : In case of the Seoul Metropolitan Areas, Journal of the Korean Urban Geographical Society, Vol. 7, No. 2, pp.
57-69.
Hino, M. (1998) : The relationship between the centrality of cities and the agglomeration of branch offices of enterprises in Tohoku region : On the Japanese Urban Systems General
Consideration, Geographical sciences, Vol. 48, No. 3, 184-193.
Incheon development institute (2006) : Gate way city, Incheon.
Kwon, S.C. (2000) : Migration and the role of large cities in Korea with reference to geographic flow and social mobility, Journal of the Korean Urban Geographical Society, Vol. 3, No.
1, pp. 57-68.
Kwon, S.C. (2001) : Migration and Regional Development : Human Capital Drain in Korea, Journal of the Korean Urban Geographical Society, Vol. 4, No. 1, 67-79.
Kwon, Y.W. (1998) : Urban rank size rule in Korea, 1789-1995, The Korean Geographical
Society, Korea, Vol. 32, No. 1, pp. 57-7(1.
Kwon, Y.W. and Yu, H.Z. (2005) : Changes of Urban Systems and Management of Urban Governance in Korea, 2005, The Korean Geographical Society, Vol. 39, No. 1, pp. 149-159. Lee, H.S. (2003) : Changes of Global Urban System Reflected in International Air Passenger
Flow Data's 1992-2001, Journal of the Korean Urban Geographical Society, Vol. 6, No. 2,
pp. 103-117.
Lee, O.H. (1990) : Urban System and Passenger Bus Network in Korea : 1960-1985, The Korean Geographical Society, Vol. 25, No. 2, pp. 67-84.
Morikawa, H. (1990) : Urbanization and Urban Systems, Daimeido.
Yang, 0.11. (1979) : A study on the urban system in Korea through the analysis of long-distance
telephone calls between cities, Geography and Geography education, Vol. 9, No. 0, pp. 223.
Poul, J.S. (1971) : The spatial structure of migration behavior, migration and regional ment in the United States, pp. 1-133.
Richard, E.P. (1971) : The structure of Central Place Systems, Economic geography, Vol. 47, No. 2, pp. 136-55.
N •1,,V
q5.-
F. .P6..51• 525'.5.5 '.'5444' ' ,i.56 _34 15- ..3g 27 3,3. .. 37 IC4' - . 1 30 ' 17. 22 _,'7542 47 4., • ., .... .. , ,. ','• . 24_.•,'. 9 37 40, • 50 4q,431•5.45 ,35.... .1',' 26Zj' 4e . , . .. .•„. , , . . 26• .,14,',.."9 ..„,56•., 67 .,,:139 . ,.- 82 . ... .124 8.72_:•. se'''4-..'6',.'' ' '1,',.,.' _...• •4,• _135,,- ._,132 • , _ao . • .57 . ' : .' ...ra 76 65 75 60 71 126 - ..130„131 ' ' - 75•167',6 7.-62 76 73 123 . . 63 77 1 - .. 74 129 .' 85 - 121 137 :36I _:,3_,.128120' ., _B4',89,, 86'83 135 96160 86 _93.:,9' ,34 159- 161 154 149 95 - :- 94, 67. •• • ' 151 156 152 ' '114 115 132 ,.,153..142148 . 103,104,.44 - 2 5 . - 157 _143 ,_,, 1' ,. : . CC. 107 ' 1 '"" -''-';97 i1. - • . ...•,,,...• ...„7„1:55 150 .-..,..- . '--,••••'•;••:,,,Y18E'''''.• 109 158 , .. . ,.. , 4 3j 119 7 '4 164 • • 162 65 163'1 60 30 62 120 I KmTable 6 The original number of Korean regions 1 Seoul 11 Anyang 21 Osan 31 Hwa seong 41 Gang reung 51 Cheolwon 61 Boeun 71 Asan 81 Taean 91 Muju 101 Gwangyang 111 Yeongam 121 Gim cheon 131 Cheong song 141 Ul reung 151 Yang san 161 Hap cheon 2 Busan 12 Bucheon 22 Siheung 32 Gwangju {city) 42 Donghae 52 Rwacheon 62 Okcheon 72 Seosan 82 Dangjin 92 Jangsu 102 Darn yang 112 Muan 122 Andong 132 Yeong yang 142 Chang won 152 Eu ryeong 162 Jeju 3 Daegu 13 Gwang myeong 23 Gunpo 33 Yangju 43 Tae baek 53 Yanggu 63 Yeongdong 73 Nonsan 83 Jeonju 93 Imsil 103 Gok seong 113 Hamp yeong 123 Gumi 133 Yeongdeoli 143 Masan 153 Haman 163 Seogwipo 4 Incheon 14 Pyeongta ek 24 Euwang 34 Pocheon 44 Sokcho 54 Inje 64 Jincheon 74 Geumsan 84 Gunsan 94 Sun chang 104 Gurye 114 Yeong gwang 124 Yeongju 134 Cheong do 144 Jinju 154 Chang nyeong 164 Bukjeju 5 Gwangju (metro) 15 Dongdu cheon 25 Hanam 35 Yeoju 45 Sam cheok 55 Go seong 65 Gwesan 75 Yeongi 85 Iksan 95 Go chang 105 Go heung 115 Jang seong , 125 Yeong cheon 135 Go ryeong 145 Jinhae 155 Go seong 165 Nam jeju 6 Dae jeon 16 Ansan 26 Yongin 36 Yeon cheon 46 Hong cheon 56 Yang yang 66 Eum seong 76 Buyeo 86 Jeong eup 96 Buan 106 Bu seong 116 Wando 126 Sangju 136 Seong ju 146 Tong yeong 156 Namhae 166 Jeungpy eong 7 Ulsan 17 Goyang 27 Paju 37 Ga pyeong 47 Hweng seong 57 Cheongj u 67 Dan yang 77 Seo cheon 87 Nam won 97 Mokpo 107 Hwa sun 117 Jindo 127 Mung yeong 137 Chil gok 147 Sa cheon 157 Ha dong 167 Gye ryong 8 Suwon 18 Gwa cheon 28 Icheon 38 Yang pyeong 48 Yeong Wol 58 Chungju 68 Cheonan 78 Cheong yang 88 Gimje 98 Yeosu 108 Jang heung 118 Shinan 128 Gyeong san 138 Yeocheon 148 Gimhae 158 San cheong 168 Yeocheon (city) 9 Seongn am 19 Guri 29 Anseong 39 Chun cheon 49 Pyeong chang 59 Jecheon 69 Gongju 79 Hong seong 89 Wanju 99 Sun cheon 109 Gangjin 119 Pohang 129 Gunwi 139 Bonghw a 149 Milyang 159 Hamyang 169 Yeoche on (Kun) 10 Eujeon gbu 21 Nam yangju 30 Gim po 40 Wonju 50 Jeongseon 60 Cheong won 70 Boryeong 80 Yeosan 90 Jinan 100 Naju 110 Haenam 120 Gyeongju 130 Euseong 140 Uljin 150 Geoje 160 Gechang