Data Analysis of the AsiaBarometer Survey :
Well-being, Trust and Political Attitudes
著者
真鍋 一史
雑誌名
関西学院大学先端社会研究所紀要 = Annual review
of the institute for advanced social research
号
11
ページ
1-9
発行年
2014-03-31
!!!!!!!!!!!!!!!!!!!!!!!!!!!!!!!!!!!!!!!!!!!!!!!!!!!!!!!!!!!!!!!!!!!!!!!!!!!!!!!!!!!!!!!!!!!!!!!!!!!!!!!!!!!!!!!!!!!!!!!!!!!!!!!!!!!!!!!!!!!!!!!!!!!!!!!!!!!!!!!!!!!!!!!!!!!!!!!!!!!!!!!!!!!!!!!!!!!!!!!!!!!!!!!!!!!!!!!!!!!!!!!!!!!!!!!!!!!!!!!!!!!!!!!!!!!!!!!!!!!!!!!!
論 文
1 Introduction
The standard practice in the data analysis of cross-national surveys is to start with comparisons of frequency distribution of each question item and then to move on to comparisons of the pat-terns in the relationships between question items. This is conducive to the application of various methods of multivariate analysis. In such cases, however, certain preparatory analysis needs to be done. The preparatory analysis of seeking out a direction for the analysis might be consid-ered a form of “exploratory data analysis.” In survey data analysis, researchers first look at the overall structure and relationships between the data, and then try to conduct a deeper level of analysis by focusing on a particular aspect of the data. In this study, I conduct a Smallest Space Analysis (SSA) based on a matrix of Guttman’s Weak Monotonicity Coefficient that shows the relationships between question items. The coefficients indicate the similarity or dissimilarity be-tween the items of the matrix. The higher the coefficient, the greater the similarity. I have se-lected SSA because it appears to be a useful method for the understanding of the structure of data.
As a type of multidimensional scaling, SSA is a nonmetric method of expressing the relation-ship between n number of question items shown in a coefficient matrix by the size of the dis-tance between n points in an m-dimensional (m<n) space. The higher the coefficient, the smaller the distance, and the lower the coefficient the smaller the distance. Usually a 2-dimensional (plane) or 3-2-dimensional (cube) space is used to visually depict the relationship be-tween question items (for the algorism and software of SSA, see Appendix).
The goodness-of-fit of the SSA diagram to the coefficient matrix is indicated in the Shepard Diagram and the Coefficient of Alienation (Amar and Toledano, 2001). It is confirmed that in the SSA maps below alienation coefficients are all less than 0. 15, and are satisfactory.
This method of analysis is likely to be applicable as a very effective tool in examining
──────────────
AsiaBarometer official website: http.//www.asiabarometer.org
Data Analysis of the AsiaBarometer Survey:
Well-being, Trust and Political Attitudes
MANABE, Kazufumi
equivalence of measurement, a major concern when conducting cross-national surveys. In a cross-national survey that uses the same wording for the same question items can yield an SSA map showing the similar spatial structure, it is highly likely that “commonality of meaning” can likewise be established in those countries. Thus, it is highly likely that the equivalence of meas-urement can be ensured. This is an important reason for using SSA (for the further discussion, see Borg, 1998).
2 Result of Data Analysis
2. 1 Well-Being
The 19 question items compiled under the heading of “well-being” include one item related to feelings of happiness (Q 4), one item related to feelings of life enjoyment (Q 5), one item re-lated to feelings of accomplishment (Q 6), and 16 items rere-lated to life satisfaction (Q 7 a−p) (for the literature review of the research on well-being, see Robinson, Shaver and Wrightsman, 1991).
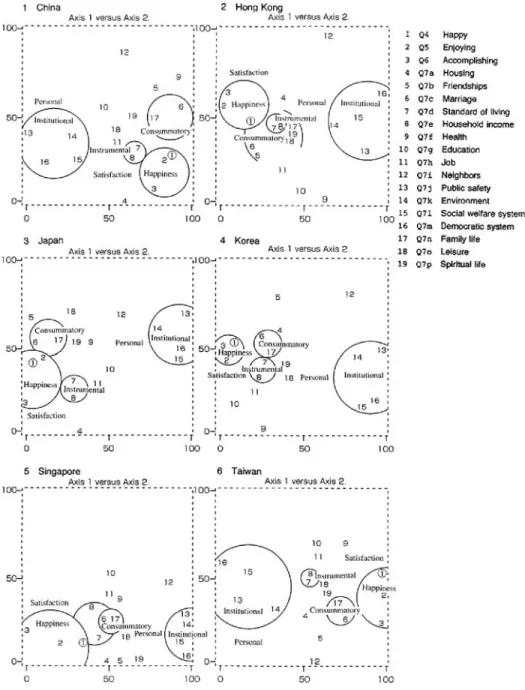
When examining the SSA maps (Figure 1) for six countries, one can focus on either (1) the commonalities evident in six countries’ SSA maps, or (2) the differences evident in six countri-es’ SSA maps. There are several commonalities evident in the SSA maps of six countries (Viet-nam is excluded from this data analysis, as some of the question items were not included on the country’s survey), three of which are discussed below.
1) The first is the positions of four items: public safety (13), the environment (14), social welfare system (15), and the democratic system (16). Among the questions asked regarding life satisfaction, these four were slightly different in terms of their content than the others. While the other question items tend to address more “personal issues,” these four tend to address more “institutional issues.” If we turn our attention to the SSA maps, these four items comprise a sin-gle independent space in all of the countries.
2) Another is that there are two types of character-defining question items that belong in the “personal issues” category: instrumental items, such as household income (8) and standard of living (7), and consummatory items, such as marriage (6) and family life (17). If we look at the SSA map, we can see a broadening pattern of the special structure of the instrumental item cluster on the one hand, and the consummatory item cluster on the other.
3) Finally, the questions “Do you feel happy?” “Do you enjoy your life?” and “Do you have a sense of accomplishment?” are located in separate area set apart from the 16 items regarding “life satisfaction” for each country. This suggests that the hypothesis to make a conceptual dis-tinction between these three items as “question items on happiness,” and the “question items on life satisfaction,” was, indeed, appropriate.
What are the differences between the countries? As is shown in the three findings above, the
19 question items addressed in this data analysis could be divided into three major groupings in each country examined (this leads to the generalizable proposition about the equivalence of the “linkage of meanings” with regard to these items), but there were differences in each country with regard to the spatial structure of the items within those groupings. To determine where these national differences come from would require an investigation of the various economic, political, social, and cultural conditions in each country.
2. 2 Trust
The 21 question items group addressed in this data analysis is divided into three items on “in-terpersonal trust” (Q 11, Q 12, and Q 13) and 19 items on “institutional trust” (Q 29 a−s). The items regarding interpersonal trust ask “Generally, do you think people can be trusted or do you think that you can’t be too careful in dealing with people?” (Q 11), “Do you think that people generally try to be helpful or do you think that they mostly look out for themselves?” (Q 12), and “If you saw somebody on the street looking lost, would you stop to help?” (Q 13). The items regarding institutional trust ask if the respondent trusts 19 institutions, systems, and
or-Figure 2 Smallest Space Analysis of the Interrelations among Trust Items 関西学院大学 先端社会研究所紀要 第 11 号
ganizations, such as “the central government,” “the local government,” “the army,” “the legal system,” “the police,” “parliament” and so on (Q 29).
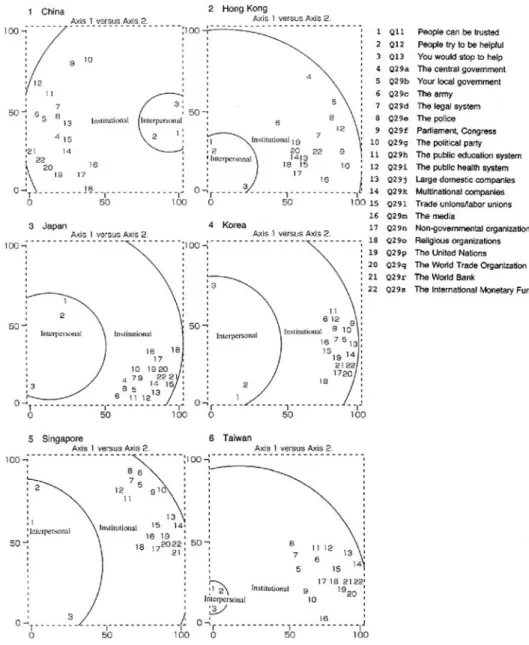
Here again, I have obtained the six 2D maps using SSA (Figure 2).
The commonalities between the countries are quite remarkable. The questions related to peo-ple’s social trust are shown in concentric circles in six countries. Questions 1, 2, and 3 on inter-personal trust are located in the inner concentric circle, while questions 4−22 on institutional trust are positioned in the outer concentric circle. In other words, there tends to be a consistent discrepancy between interpersonal trust and institutional trust (specifically, for example, the atti-tudinal tendency to say “I trust people,” but “I don’t trust institutions”) across the countries.
This is not to say that there are no differences between six countries. While the discrepancy between the two types of trust is common in six countries, the size of that discrepancy varies in six nations.
Active debates around the theme of “trust” as it is addressed here have evolved over the past decades. Francis Fukuyama, one of the scholars of this academic field, makes an analytical ar-gument in his book Trust: The Social Virtues and the Creation of Prosperity (NY: Free Press, 1995) regarding the relationship between the way social structures are created in various coun-tries and the people’s sense of trust. The generalizable proposition suggested above is believed to further contribute to the development of Fukuyama’s argument.
2. 3 Political Attitudes
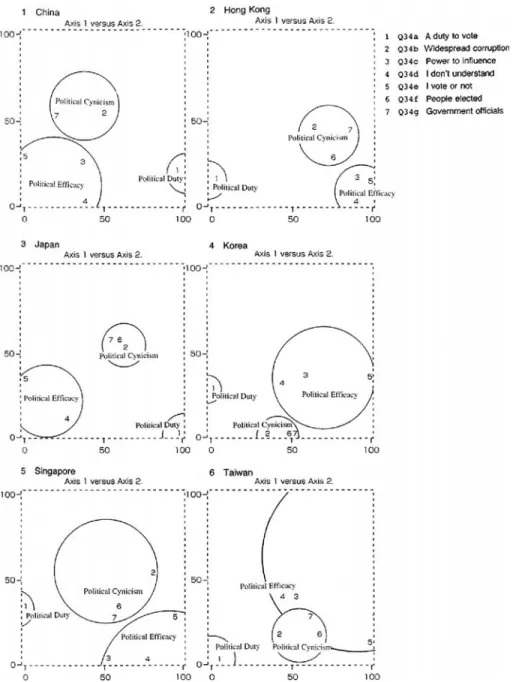
The AsiaBarometer survey contains several questions created for the purpose of measuring peo-ple’s political attitudes. For the purpose of this data analysis, I examine seven questions, Q 34 a −g. These question items have been used in various political attitude surveys conducted since G. A. Almond and S. Verba, The Civic Culture: Political Attitudes and Democracy in Five Nations (Princeton: Princeton University Press, 1963). Once again, I begin by examining the meaning of these questions. A careful examination of the meaning of each question reveals that these seven question items can be divided into three groups: (a) items regarding political duty (1), (b) items regarding political cynicism (2, 6, 7), and (c) items regarding political efficacy (3, 4, 5). The purpose of this data analysis is to verify whether this classification is applicable in a cross-national situation.
Thus, I produced the six 20 maps by applying SSA (Figure 3).
These SSA maps show that the seven questions regarding political attitudes can be divided into three groups in six countries.
3 Conclusions
By focusing on the methodological advantages of Smallest Space Analysis, this paper has made several attempts at exploratory data analysis for the purpose of pointing out the significance of the survey, suggesting possible directions for data analysis, and establishing a starting point for future data analysis efforts. It may also be considered an attempt to perform the intellectual
ex-Figure 3 Smallest Space Analysis of the Interrelations among Political Attitudes Items 関西学院大学 先端社会研究所紀要 第 11 号
ercise known as “confirmation of dimension” as a first step in empirical research on social phe-nomena. This kind of intellectual exercise will make it possible to proceed with an analysis of relationships between multiple dimensions confirmed. These kinds of data analysis procedures constitute an approach based on what is called “data science.”
Appendix I: Guttman’s Weak Monotonicity Coeeficient
Given N pairs of observations {(xi, yi) ; i=1, 2, . . . N } on two numerical (ordinal or interval) variables x and y, the weak monotonicity coefficientμ2between x and y is defined as follows:
μ2= N ! i=1 N ! j=1(xi−xj)(yi−yj) N N ! i=1 N ! j=1|xi−xj||yi−yj|
The coefficient between two variables x and y is in some sense a correlation coefficient between these variables. It tells us how much two variables vary in the same sense. In other words, when
x increases does y increase or not.
(Amar and Toledano, 2001. P.119, 219)
Appendix II: Algorism and Software
Given a symmetric matrix of dissimilarity coefficients {Dij}, Dijbeing the coefficient between elements Vi and Vj, we want to represent the elements (Vk; k=1, . . . n) as points in an m-dimensional Euclidean space such that the following monotonicity condition is fulfilled “as well as possible”:
Dij<Dkl⇔ dij<dkl (1)
for each quadruplet (i, j, k, l ), dij being the computed Euclidean distance between points representing Vi and Vj, in the m-dimensional space:
dij= "!m
a=1(x
ia−xja)2 (2)
The monotonicity condition is fulfilled as well as possible for dimensionality m thought to be the smallest.
The solution is noted:
x={xia}i=1, 2, . . . n; a=1, 2, . . . , m
The software use in this study is called “HUDAP”, and the spatial partitioning lines are also drawn using the software.
The reference person is: Dr. Reuven Amar Computer Authority
The Hebrew University of Jerusalem Mount Scopus, Jerusalem,
91905 Israel
E-mail: reuben@mscc.huji.ac.il
References
ALMOMD, G. A. and VERBA, S. (1963): The Civic Culture: Political Attitudes and Democracy in Five Nations, Princeton University Press, Princeton, New Jersey.
AMAR, R. and TOLEDANO, S. (2001): Hudap Manual with Mathematics and Windows Interface, Second Edition, The Hebrew University of Jerusalem.
BORG, I. and SHYE, S. (Eds.) (1995): Facet Theory: Form and Content, SAGE Publications, Thousand Oaks, London, New Delhi.
BORG, I. (1998): A Facet-Theoretical Approach to Item Equivalency, NACHRICHTEN SPEZIAL, ZUMA, No.3, Man-heim, Germany.
CANTER, D. (Ed.) (1985): Facet Theory: Approaches to Social Research, Springer-Verlag, New York, Berlin, Heidel-berg, Tokyo.
FUKUYAMA, F. (1995): Trust, Free Press, New York.
LEVY, S. (Ed.) (1994): Louis Guttman on Theory and Methodology: Selected Writings, Dartmouth, Aldershot. MANABE, K (2001): Facet Theory and Studies of Japanese Society, Bier’sche Verlangsanstalt, Bonn.
ROBINSON, J. P., SHAVER, P. R. and WRIGHTSMAN, L. S. (Eds.) (1991): Measures of Personality and Social Psy-chological Attitudes, Academic Press, San Diego, New York, Boston et al.
SHYE, S. (Ed.) (1978): Theory Construction and Data Analysis in the Behavioral Sciences, Jossey-Bass Publishers, San Francisco, Washington, London.
Remark
This paper is based on the author’s presentation which was made at the Specialized Session of the Joint Conference of Italian and Japanese Classification Societies “Analysis and Modeling of Complex Data in Behavioral and Social Sci-ences” held at Anacapri, Italy, 3−4 September, 2012.
Data Analysis of the AsiaBarometer Survey:
Well-being, Trust and Political AttitudesMANABE, Kazufumi
(Kwansei Gakuin University and Aoyama Gakuin University)
Abstract
The purpose of this paper is to illustrate the utility of Smallest Space Analysis (SSA) de-veloped by Louis Guttman for the data analysis of cross-national survey using the example of the AsiaBarometer survey. The AsiaBarometer is a large scale multi-national questionnaire sur-vey conducted at regular intervals (every year from 2003) within the Asia region. This paper analyzes the data from the 4th AsiaBarometer survey which was conducted from June to August 2006 in seven countries: China, Hong Kong, Japan, South Korea, Singapore, Taiwan, and Viet-nam.
The AsiaBarometer survey contains question items that measure the respondents’ beliefs, attitudes and behaviors in various aspects of everyday life, as well as items intended to measure their values related to freedom, human rights, and democracy, and their political behaviors. In this data analysis, I deal with the following three groups of question items: (1) question items on “well-being,” (2) question items on “social trust,” and (3) question items on “political atti-tudes.”
Key words: cross-national comparison, equivalence of measurement, exploratory data analysis, weak monotonicity coefficient, smallest space analysis


