ORIGINAL
The ADVIA2120i parameter Revised %MICRO is a surrogate
marker of schistocyte formation after hematopoietic
stem cell transplantation
Akishige Ikegame1, Yusuke Inoue1, Makoto Hata1, Motoki Sugasaki1, Hiroko Yoshida1, Satiko Ogasa1, Takayuki Nakao1, Kazuhiro Ikegame2, Shiro Fujii3, Eriko Shibata4, Kojiro Nagai4, Tetsuji Takayama4, and Masahiro Abe3
1Division of Medical Technology, Tokushima University Hospital, Tokushima, Japan, 2Division of Hematology, Department of Internal Medi-cine, Hyogo College of MediMedi-cine, Hyogo, Japan, 3Department of Hematology, Endocrinology and Metabolism, Institute of Biomedical Sciences, Tokushima University Graduate School, Tokushima, Japan, 4Clinical Laboratory, Tokushima University Hospital, Tokushima, Japan
Abstract : Objectives : Hematopoietic stem cell transplantation (HSCT)-associated thrombotic microangiopathy (TA-TMA) is an important early post-treatment condition. This study evaluated the Revised %MICRO, a parame-ter obtained from the ADVIA 2120i automated blood cell counparame-ter, as a surrogate marker of the schistocyte ratio. We hypothesized that individual differences between the %MICRO value and schistocyte ratio would remain constant. Design and Methods: EDTA-2K-treated peripheral blood samples were collected from 19 patients who underwent allogeneic HSCT from April 2014 to September 2018. First, the baseline difference, X, was calculat-ed using a sample from the first day after HSCT as X = %MICRO (first day) – schistocyte ratio (first day). Next, the Revised %MICRO for each subsequent day was calculated as Revised %MICRO = %MICRO – X. We evaluated correlations of the schistocyte ratio with the calculated %MICRO and Revised %MICRO and the RBC fragment, RBC distribution width, %MICRO and Revised %MICRO data obtained from the ADVIA 2120i. Results : The mean schistocyte percentage and Revised %MICRO were both 0.4% ± 0.6. RBC fragments correlated weakly with the %MICRO and schistocyte ratio, respectively (r = 0.162 and r = 0.771, respectively), whereas the Revised %MICRO correlated strongly with the schistocyte ratio (r = 0.893). Conclusion : The Revised %MICRO appears to be a good surrogate of the schistocyte ratio in a clinical setting. J. Med. Invest. 67 : 250-254, August, 2020
Keywords : Schistocytes, Hematopoietic stem cell transplantation, RBC fragments, ADVIA2120i, Revised %MICRO
1. INTRODUCTION
Hematopoietic stem cell transplantation (HSCT) is a curative option for hematologic malignancies. In such cases, the post-pro-cedural administration of calcineurin inhibitors such as cyclo-sporine or tacrolimus is required to suppress graft-versus-host disease (GVHD). However, these drugs can lead to major com-plications such as HSCT-associated thrombotic microangiopathy (TA-TMA), which was first described by Powles et al. (1). in 1980 as endothelial cell damage induced by calcineurin inhibitors. Given the dismal clinical course of severe TA-TMA, an early diagnosis is highly desirable (2-4).
TA-TMA is characterized by the appearance of schistocytes, a consequence of red blood cell (RBC) passage through damaged blood vessels. Accordingly, the schistocyte ratio correlates with the severity of TA-TMA, and Zeigler et al. even developed a TA-TMA severity classification based on this parameter (5-6). The guidelines of the International Council for Standardization in Haematology (ICSH) define a schistocyte ratio ≥ 1% as being a strong morphological indicator for the diagnosis of TMA (7). In the Japanese Society of Laboratory Hematology (JSLH), a schistocyte ratio ≥ 0.6% is used as an indicator for TMA as it allows for earlier diagnosis (8).
The enumeration of schistocytes, however, requires time, effort, and technical skill. Accordingly, an automated clinical measurement of the schistocyte ratio would greatly facilitate post-transplant management (9-11).
Previously, Lesesve et al. reported that when using the ADVIA120 automated device (Siemens Healthcare Diagnostics), the parameter RBC fragments, which denotes the proportion of RBCs with a mean corpuscular volume (MCV) < 30 fL, is a use-ful surrogate for the post-HSCT schistocyte ratio (12-14). In this study, we aimed to evaluate the Revised %MICRO, a parameter obtained from the ADVIA 2120i blood cell counter, as a surro-gate marker of schistocytes (Fig. 1).
We hypothesized that individual differences between the %MICRO value and schistocyte ratio would remain constant. According to this hypothesis, we developed a new parameter, Re-vised %MICRO, which we defined as the %MICRO value minus the baseline difference [%MICRO (first day) – schistocyte ratio (first day)]. This Revised %MICRO appears to correlate more strongly with the schistocyte ratio.
The Journal of Medical Investigation Vol. 67 2020
Abbreviations
HSCT : Hematopoietic stem cell transplantation ; GVHD : graft-versus-host disease ; TA-TMA : HSCT-associated thrombotic microangiopathy ; RBC : red blood cell ; MCV : mean corpuscular volume ; MCH : mean corpuscular hemoglobin concentration ; RDW : RBC distribution width ; SDS : sodium dodecyl sulfate ; HUS : sporadic hemolytic-uremic syndrome ; TTP : thrombotic thrombocytopenic purpura ; ROC : receiver operator characteristic.
Received for publication February 12, 2020 ; accepted March 16, 2020. Address correspondence and reprint requests to Akishige Ikegame, Di-vision of Medical Technology, Tokushima University Hospital, 2-50-1 Kuramoto, Tokushima 770-8503, Japan and Fax : +81-88-633-7009.
2. METHODS
2.1 Patients and samples
Peripheral blood samples were collected from 19 patients who underwent allogeneic HSCT from April 2014 to September 2018 and were treated with EDTA-2K to prevent coagulation. The hemoglobin criterion was set at a mean corpuscular hemoglobin concentration (MCH) > 29.0 pg/L. This criterion yielded 7 cases with a schistocyte ratio > 0.6% and 12 with a schistocyte ratio < 0.6% (Table 1). This study protocol and consent procedure were approved by the Ethics Committee of Tokushima University Hospital (No.3319), and performed in compliance with the Hel-sinki Declaration.
2.2 Cell counts using ADVIA2120i
The automated cell-counting analyzer, ADVIA2120i (Siemens Healthcare Diagnostics), was used in this study. This device performs an integrated analysis of RBCs and platelets to yield a value for the %RBC fragments. Specifically, platelet scatter sig-nals acquired at low (2–3º) and high angles (5–15º) are converted into volume and refractive index values. The platelet scatter-gram displays cells with volumes ≤ 30 fL and refractive indices of 1.35–1.40. Here, we studied the correlations of the schistocyte ratio with the %RBC fragments and RBC distribution with (RDW) (Fig. 2A and 2B).
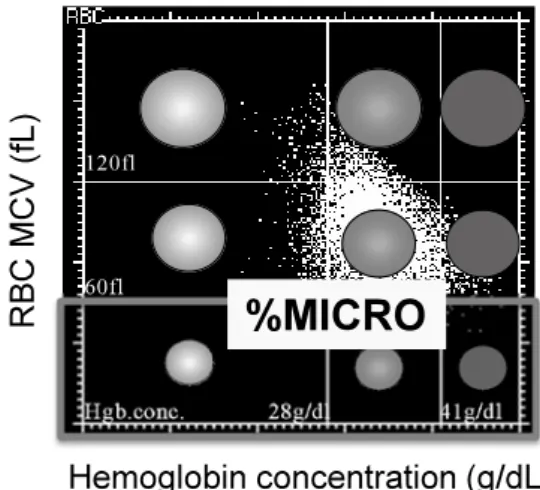
To determine the %MICRO value, the ADVIA2120i uses two-angle laser flow cytometry with exposing sodium dodecyl sulfate (SDS) to obtain isovolumetric sphering measurements of RBC. The scattered light from a 670-nm laser beam is used to measure the RBC volume and determine the MCV and hemoglobin level. The RBC matrix is then displayed as a plot of the hemoglobin level (horizontal axis) vs. the MCV (vertical axis). %MICRO is defined as the ratio corresponding to a MCV of 30–60 fL.
2.3 Microscopic enumeration of schistocytes
Schistocytes from 4,000 May–Giemsa-stained RBCs were counted under a microscope (magnification, 1000×). We applied the following morphological criterion proposed by Dacie and Table 1. Revised %MICRO and schistocyte ratios from patients
with and without BMT related TMA
TMA Schistocyte ratios (%) %Micro (%)Revised
Myelofibrosis yes 0.3 ± 0.2 0.5 ± 0.5
AML with inv (16) yes 1.7 ± 1.0 1.8 ± 1.0
AML t (11 ; 17) (q23, q25) yes 0.3 ± 0.2 0.7 ± 0.4
AML without maturation yes 0.4 ± 0.1 0.4 ± 0.2
AML t (9 ; 11) (q22 ; q23) yes 0.8 ± 0.5 0.8 ± 0.6 B-ALL no 0.1 ± 0.1 0.1 ± 0.1 AML t (11 ; 19) (q23 ; p13.1) no 0.0 ± 0.1 0.0 ± 0.0 AML with MRC no 0.3 ± 0.1 0.3 ± 0.2 AML with MRC no 0.0 ± 0.0 0.0 ± 0.0 B-ALL no 0.2 ± 0.2 0.1 ± 0.1 MDS yes 0.3 ± 0.2 0.3 ± 0.3 MDS no 0.3 ± 0.2 0.3 ± 0.2 MDS no 0.0 ± 0.0 0.0 ± 0.0 MDS no 0.0 ± 0.0 0.0 ± 0.0 MDS no 0.2 ± 0.2 0.3 ± 0.2 MDS no 0.2 ± 0.2 0.3 ± 0.3 ATLL yes 1.0 ± 0.7 0.7 ± 0.4
Hepatosplenic T cell lymphoma no 0.0 ± 0.0 0.0 ± 0.0
Granulocyticsarcoma no 0.0 ± 0.1 0.0 ± 0.0
Fig 2. Correlations of the schistocyte ratio with red blood cell (RBC) parameters in 299 samples. A. Correlation with the %RBC fragment value. B. Correlation with the RBC distribution width (RDW). Eval-uation was performed 299 samples obtained from 19 patients after HSCT.
Fig 1. Red blood cell (RBC) matrix obtained using the ADVIA 2120i blood cell counter. The %MICRO displays the RBC ratio up to a mean corpuscular volume of 30–60 fL for total RBCs.
Lewis to well-stained entities : 1) small and irregular, 2) helmet, 3) sharp, and 4) small spherocyte-shaped (15). One technician performed all enumerations to rule out inter-operator variability. The schistocyte ratio was calculated as the ratio of the schisto-cyte count to the total RBC count.
2.4 Definition of Revised %MICRO
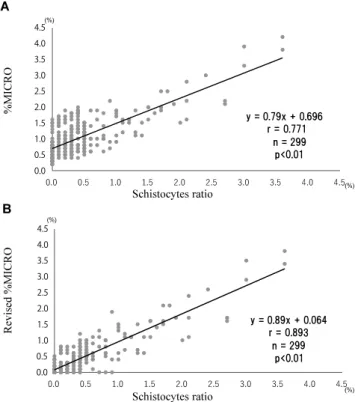
We hypothesized that the difference between the %MICRO and schistocyte ratio would remain constant in each patient. First, we calculated the baseline difference, X, using the sample of first day after HSCT as X = %MICRO (first day) – schistocytes ratio (first day). Next, we calculated the Revised %MICRO for each subsequent day as Revised %MICRO = %MICRO – X. We then analyzed the correlations of the schistocyte ratio with the %MICRO and Revised %MICRO values (Fig. 3A and 3B).
2.5 Cut-off value of the Revised %MICRO
The Japanese Society of Laboratory Hematology defined a schistocyte ratio > 0.6% as the cut-off value for TA-TMA. Therefore, we used a receiver operating characteristic curve to determine the Revised %MICRO cut-off value equivalent to a schistocyte ratio of 0.6% (8).
2.6 Statistical analysis
All statistical analyses were performed using EZR software, version 1.27 (Saitama Medical Center, Jichi Medical University, Saitama, Japan) (16). Statistical comparisons were performed using the parametric paired ROC curve for continuous parama-ters depending upon normality between the TMA and non-TMA groups.
3. RESULTS
Our microscopic analysis of various samples revealed that most schistocytes are larger than 30 fL. Therefore, we focused on the %MICRO parameter, which denotes RBCs with a MCV of 30–60 fL as a surrogate marker of the schistocyte ratio. The AD-VIA2120i uses the Baso and Perox channels to perform the total nucleated cell count and leukocyte cell differential, respectively. RBCs are measured using the RBC/PLT channel, which deter-mines all RBC counts following exposure to sodium dodecyl sulfate (SDS) to yield isovolumetric sphering measurements, MCV, and MCH. Accordingly, we generated an RBC-scattered matrix for each sample using the MCV and MCH and designated the fraction with an MCV of 30–60 fL as the %MICRO output (Fig. 1).
Correlations of the schistocyte ratio with %RBC fragments (y = 0.06x + 0.237, r = 0.162), %MICRO (y = 0.79x + 0.696, r = 0.771), and Revised %MICRO (y = 0.89x + 0.064, r = 0.893) are shown in Fig. 2, 3A and 3B respectively. The Revised %MICRO was able to detect a fraction of samples with a low schistocyte ratio ( < 0.6%) that would have been difficult to de-tect microscopically.
3.1 Cut-off value for Revised %MICRO
The ROC curve analysis revealed that the cut-off value of “Revised %MICRO” equivalent to 0.6% of schistocytes ratio was 0.6% (same value by chance) with the sensitivity 0.852, and the specificity 0.821 (Fig. 4).
3.2 Example of Revised %MICRO monitoring in a case of TMA after HSCT
We present acute myeloid leukemia with the (inv16) (p13.1 ; q22) CBFB-MYH11 translocation as one of the represen-tative cases that developed TMA after HSCT.
We monitored the Revised %MICRO and schistocyte ratio in the case of TA-TMA. The schistocyte ratio began to increase Fig 3. Correlations of the schistocyte ratio with ADVIA 2120i
pa-rameters in 299 samples. A. Correlation with the %MICRO, which de-notes red blood cells (RBC) with a mean corpuscular volume of 30–60 fL. B. Correlation with the Revised %MICRO.
Fig 4. Determination of the cut-off value for the schistocyte ratio using receiver operating characteristic (ROC) curves of the Revised %MICRO.
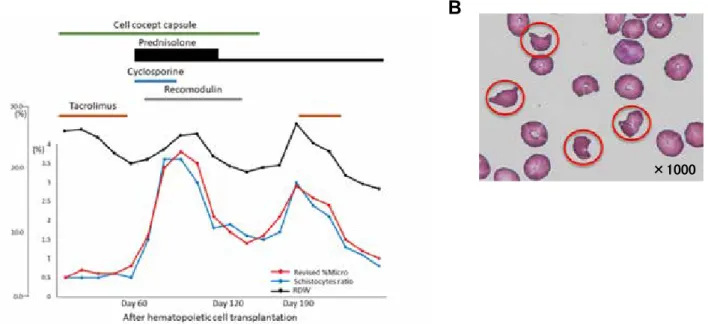
on day 60 after HSCT and reached 3.6% on day 81. The patient was switched from tacrolimus to cyclosporine, and prednisolone was initiated with recombinant thrombomodulin. Subsequent-ly, the patient’s schistocyte ratio decreased to 1.5% but began to increase again on day 192. The association of the Revised %MICRO value with the schistocyte ratio remained consistent throughout the patient’s clinical course (Fig. 5A and 5B).
4. DISCUSSION
As noted above, TA-TMA is characterized by the induction of schistocytes in the peripheral blood in response to passage through damaged vascular endothelium. Although the quanti-tative monitoring of the schistocyte ratio is provides a critical assessment of TA-TMA, manual microscopic counting is chal-lenging and subject to inter-operator variance. We previously re-ported that the %MICRO, a parameter automatically generated by the ADVIA2120i device, exhibits a good correlation with the microscopic schistocyte ratio and may thus be a useful surrogate marker (17). However, poikilocytes, a characteristic of iron-defi-cient anemia, can yield falsely high %MICRO values. We found that because of these poikilocytes, the %MICRO values were not consistent with the schistocyte ratios in the context of hypochro-mic anemia (low MCH). Therefore, we focused on samples with MCH vales > 29.0 pg/L. Furthermore, schistocytes also appear in the context of various diseases such as sporadic hemolytic-ure-mic syndrome (HUS) / thrombotic thrombocytopenic purpura (TTP), burn injury, and scleroderma-related renal crisis. There-fore, the pathogenesis of TMA may interact with discrepancies between the physiologic properties and morphology and thus af-fect the difference between the %MICRO value and the schisto-cyte ratio. To clarify the significance of %MICRO, we focused this study on the post-transplant context and aimed to identify the best association between the %MICRO value and schisto-cyte ratio. We observed a weak correlation between %RBC fragments and the schistocyte ratio, which can be explained
by the exclusion of patients with marked schistocyte diseases such as TTP/HUS. Accordingly, the %RBC fragments would not be associated microscopically with the schistocyte zone. In contrast, we observed a moderate correlation of %MICRO with the schistocyte ratio. However, the %MICRO value was always higher than the schistocyte ratio, which might be attributed to the nature of the parameters. While a microscopic analysis would only count small RBCs (MCV ~30–60 fL) with a high MCH as schistocytes, %MICRO includes all RBCs with a MCV of 30–60 fL, regardless of hemoglobinemia. To exclude the low hemoglobinemia fraction from small RBC, we hypothesized that 1) the magnitude of the low-hemoglobin fraction would vary among HSCT patients but 2) the variance would remain small within each patient. Therefore, to reduce noise and address the observation that the %MICRO value was always higher than the schistocyte ratio, we developed a new parameter, Revised %MICRO, which was shown to exhibit a much stronger correla-tion with the schistocyte ratio. By chance, the cut-off Revised %MICRO value corresponding to a 0.6% schistocyte ratio was also 0.6%, based on the valance of sensitivity and specificity. However, given the trend towards a moderately higher Revised %MICRO value relative to the schistocyte ratio when the former value exceeds 0.6%, microscopic counts should also be performed during post-HSCT monitoring.
We further investigated the association of Revised %MICRO with the RDW, which was previously reported to associate with the schistocyte ratio (18). However, we found that the Revised %MICRO” correlated more precisely with the schistocyte ratio, as the sensitivities for the interactions of the schistocyte ratio with %RBC fragments and RDW were too low to enable clinical monitoring in cases with schistocyte counts < 1.0%. In other words, among the ADVIA2120i-derived parameters, Revised %MICRO exhibited the best relationship with the schistocyte ratio even at low values of the latter. Possibly, microscopic de-termination of the schistocyte ratio in cases with an increasing Revised %MICRO may be an effective means of avoiding overt TA-TMA.
Fig 5. Representative patient data. A. A case of acute myeloid leukemia in a patient harboring the inv (16) (p13.1q22) mutation (CBFB-MYH11 translocation). A post-hematopoietic stem cell transplantation (HSCT) analysis reveals that the Revised %MICRO reflected the schistocyte ratio rather than the red blood cell (RBC) distribution width (RDW) trend. B. RBC morphology in peripheral blood at the time of the peak of schistocyte ratio, 81 days after HSCT.
In conclusion, Revised %MICRO exhibited the strongest cor-relation with the schistocyte ratio among all tested ADVIA2120i parameters. Moreover, Revised %MICRO enabled accurate monitoring even in cases with low schistocyte ratios ( < 1.0%). To put the schistocytes ratio chosen under the microscope into effect seems watching a fluctuation of the schistocytes ratio Revised %MICRO, and when admitting the increased tendency, import-ant to stop TMA after hematopoietic stem cell transplimport-antation .
CONFLICTS INTEREST
The authors declare no conflicts of interest.
AUTHOR CONTRIBUTIONS
AI and YI designed the study. AI, KI and ES prepared the manuscript. MH, MS, and HY conducted the automated analy-sis. KK, SF and MA provided clinical samples. SO, TN, and KN contributed to the statistical analysis. TT supervised the project.
REFERENCES
1. Powles RL, Clink HM, Spence D, Morgenstern G, Watson JG, Selby PJ, Woods M, Barrett A, Jameson B, Sloane J, Lawler SD, Kay HE, Lawson D, McElwain TJ, Alexander P : Cyclosporin A to prevent graft-versus-host disease in man after allogeneic bone-marrow transplantation. Lancet 1 : 327-329, 1980
2. Nakamae H, Yamane T, Hasegawa T, Nakamae M, Terada Y, Hagihara K, Ohta K, Hino M : Risk factor analysis for thrombotic microangiopathy after reduced intensity or myeloablative allogeneic hematopoietic stem cell transplan-tation. Am J Hematol 81 : 525-531, 2006
3. Roy V, Rizvi MA, Vesely SK, George JN : Thrombotic thrombocytopenic pur-pura-like syndromes following bone marrow transplantation : an analysis of associated con-di-tions and clinical outcomes. Bone Marrow Transplant 27 : 641-646, 2001
4. Ho VT, Cutler C, Carter S, Martin P, Adams R, Horowitz M, Ferrara J, Soiffer R, Giralt S : Blood and marrow trans-plant clinical trials network toxicity committee consensus summary : thrombotic microangiopathy after hematopoietic stem cell transplantation. Biol Blood Marrow Transplant 11 : 571-575, 2005
5. Zomas A, Saso R, Powles R, Mackay H, Singhal S, Treleaven J, Mehta J : Red cell fragmentation (schistocytosis) after bone marrow transplantation. Bone Marrow Transplant 22 : 777-780, 1998
6. Zeigler ZR, Shadduck RK, Nemunatis J, Andrews DF, Rosenfeld CS : Bone marrow transplant-associated throm-botic microangiopathy : a case series. Bone Marrow Trans-plant 15 : 247-253, 1995
7. Zini G, Onofrio G, Briggs C, Erber W, Jou JM, Lee SH, Mcfadden S, Vives-corrons JL, Yutaka N, Lesesve JF : ICSH recommendations for identification, diagnostic value, and quantitation of schistocytes. Int J Lab Hematol 34 : 107-116, 2012
8. Lesesve JF, Alla F, Dugue F, Salignac S, Clement L, Lecompte T, Bordigoni P : Evaluation of schistocyte monitoring after haematopoietic stem cell taransplantation. Int J Lab Hema-tol 33 : 343-356, 2011
9. Hervent AS, Godefroid M, Cauwelier B, Billiet J, Emmerechts J : Evaluation of schistocyte analysis by a novel automated digital cell morphology application. Int J Lab Hematol 37 : 588-596, 2015
10. Jiang M, Saigo K, Kumagai S, Imoto S, Kosaka Y, Matsumoto H, Fujimoto K : Quantification of red blood cell fragmenta-tion by automated haematology analyser XE-2100. Clin Lab Haematol 23 : 167-172, 2001
11. Saigo K, Saigo K, Jiang M, Tanaka C, Fujimoto K, Kobayashi A, Nozu K, Iijima K, Ryo R, Sugimoto T, Imoto S, Kumagai S : Usefulness of automatic detection of fragmented red cells using an hematology analyzer for diagnosis of thrombotic microangiopathy. Clin Lab Hematol 24 : 347-351, 2002 12. Lesesve JF, Salignac S, Lecompte T, Bordogoni P :
Auto-mated measurement of schistocytes after bone marrow transplantation. Bone Marrow Transplant 34 : 357-362, 2014
13. Lesesve JF, Asnafi V, Braun F, Zini G : Fragmented red blood cells automated measurement is a useful parameter to exclude schistocytes on the blood film. Int J Lab Hematol 34 : 566-576, 2012
14. Schapkaitz E, Mezgebe MH : The clinical significance of schistocytes : a prospective evaluation of the International Council for Standardization in Hematology SchistocJyte Guidelines. Turk J Haematol 34 : 59-63, 2017
15. Dacie SJ, Lewis SM : Practical Haematology, 6th ed. Lon-don : Churchill Livingstone : 68-69, 1984
16. Kanda Y : Investigation of the freely available easy-to-use software ‘EZR’ for medical statistics. Bone Marrow Trans-plant 48 : 452-458, 2013
17. Ikegame A, Maruden N, Miyake T, Inoue C, Satoh M, Shono K, Nagamine Y, Doi T, Abe M, Tanaka O : Detection of fragmented red cells using %MICRO(ADVIA120). Jour-nal of The Japanese Society for Laboratory Hematology 12 : 202-209, 2011
18. christopher MM, Hawkins MG, Burton AG : Poikilocytosis in Rabbits : Prevalence, Type, and Association with Dis-ease. PLOS ONE 9:11:e112455, 2014