N‑3 polyunsaturated fatty acids intake and serum fatty acid levels in patients with
Crohn's Disease : Comparison with ulcerative colitis patients : ASPEN (American Society for Parenteral and Enteral Nutrition) 2017
Nutrition Science & Practice Conference in Orlando, USA
著者名(英) Michiko Nakamura, Yoko Oohinata journal or
publication title
Kyoritsu journal of nursing
volume 5
page range 40‑43
year 2018‑03
URL http://id.nii.ac.jp/1087/00003227/
N-3 polyunsaturated fatty acids intake and serum fatty acid levels in patients with Crohn’s Disease
― Comparison with ulcerative colitis patients ―
ASPEN (American Society for Parenteral and Enteral Nutrition)
2017 Nutrition Science & Practice Conference in Orlando, USA クローン病患者の n-3 系不飽和脂肪酸摂取と血清脂肪酸の特徴
―潰瘍性大腸炎患者との比較-
ASPEN(アメリカ静脈経腸栄養学会)2017、栄養科学・実践カンファレンス、
米国オーランド
Michiko Nakamura 1) Yoko Oohinata 2)
中村美知子1) 大日向陽子2)
キーワード:n-3 系多価不飽和脂肪酸摂取、血清脂肪酸、クローン病患者、潰瘍性大腸炎患者
key words:n-3 polyunsaturated fatty acids intake,serum fatty acid levels, Crohn’s disease patients,
ulcerative colitis patients
要 旨
ASPEN(American Society for Parenteral and Enteral Nutrition)は 1976 年に米国で設立され、
臨床栄養・代謝の研究と実践を通して患者のケアを改善することを目指している
1)。世界中に会員がお
り、2017 年現在 6,500 名以上で構成され、メンバーは医師、管理栄養士、薬剤師、看護師、研究者、学 生などである。会員は、栄養サポートに関する臨床実践、研究、教育の向上を追究している。
ASPEN2017 年は、2 月 18 日~21 日に米国の Orlando World Center Marriott Resort and Convention Center in Orlando で開催され、メインテーマは Clinical Nutrition Week (CNW:臨床栄養研究)であっ た。発表テーマや内容は臨床における患者の栄養管理の基礎研究・実践研究に関する大変興味深いもの であった。以下、筆者らが発表した「クローン病患者の n-3 系多価不飽和脂肪酸摂取と血清脂肪酸の特 徴ー潰瘍性大腸炎患者との比較―」を紹介する。
国際学会報告
受付日:2017 年 11 月 22 日 受理日:2017 年 11 月 22 日 1)共立女子大学 看護学部 2)山梨大学大学院 総合研究部
1.Introduction
Daily n-3 polyunsaturated fatty acids
(PUFAs) intake is important for patients with inflammatory bowel disease
2-3). In this study, we compared n-3 PUFAs intake and serum fatty acid levels between patients with Crohn’s disease and patients with ulcerative colitis.
Based on the results, we provide suggestions for
dietary n-3 PUFAs consumption for these patients.
2.Methods
The 22 outpatient participants had either
Crohn’s disease (CD group; n =11) or ulcer-
ative colitis (UC group; n=11)(Table 1). The
participants’ dietary intakes (including nutri-
tional intake) were surveyed at home every
N-3 polyunsaturated fatty acids intake and serum fatty acid levels in patients with Crohn’s Disease
other week for 2 months, resulting in five data sets per participant. Nutritional Value Calcula- tor Software ver6.0 (Kenpakusha, Japan) was used to calculate nutritional intake. Serum tri- glycerides (TG), total cholesterol (T-cho), high-density lipoprotein cholesterol(HDL-cho), low-density lipoprotein cholesterol(LDL-cho), total saturated fatty acids (SFAs), monounsatu- rated fatty acids (MUFAs) and PUFAs levels were determined. Blood samples were collected three times during the survey’s period.
Data Analysis: Student’s t-tests were used to evaluate the differences in nutritional consump-
tion and serum lipid levels between the two groups.
3.Results
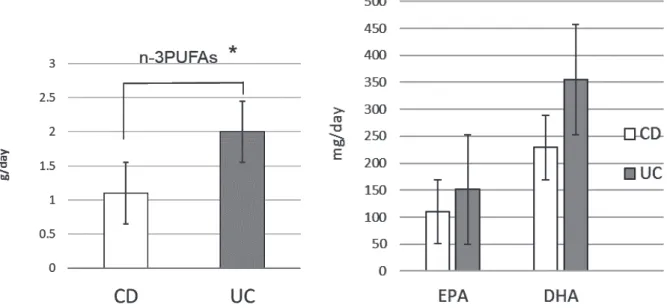
In the CD group, average daily intakes of PUFAs (6.8 ±3.8 g), n-3 PUFAs (1.1 ±0.5 g), and n-6 PUFAs (5.5±3.5 g) were significantly lower than in the UC group (p <0.05), while the n-6/n-3 intake ratio was 6.6±3.4 (6.4±2.3)
in the CD group (Table 2). In addition, EPA and DHA intakes were low in both groups
(Fig.1). The CD group consumed significantly less meat (55.3 ±31.4 g) and fat (6.1 ±5.4 g)
N=22
Mean ± SD Mean ± SD
Total energy (kcal) 1898.9 ± 424.5 1987.3 ± 295.9 0.577
P:F:C ratio ‐
Total fat (g) 32.2 ± 20.9 59.9 ± 12.6 0.001
Cholesterol (mg) 275.5 ± 147.0 431.8 ± 94.2 0.008
SFA (g) 9.2 ± 6.7 16.9 ± 4.6 0.005
MUFA (g) 10.9 ± 7.9 21.1 ± 4.6 0.001
PUFA (g) 6.8 ± 3.8 12.4 ± 3.1 0.001
n-6 PUFAs (g) 5.5 ± 3.5 10.4 ± 2.7 0.001
n-6/n-3 ratio 6.6 ± 3.4 6.4 ± 2.3 0.908
Grains (g) 390.7 ± 150.2 453.2 ± 104.8 0.271
Vegetables (g) 178.7 ± 137.5 232.2 ± 109.3 0.325
Pulses (g) 18.4 ± 17.3 47.9 ± 44.4 0.054
Fish and shellfish (g) 51.9 ± 50.0 58.4 ± 26.9 0.706
Meat (g) 55.3 ± 31.4 96.0 ± 33.0 0.008
Eggs (g) 36.7 ± 34.4 58.9 ± 13.6 0.060
Dairy Product (g) 41.7 ± 84.0 63.7 ± 47.7 0.459
Fats and Oils (g) 6.1 ± 5.4 12.6 ± 5.8 0.014
Food intake / day §2
§3 Six participants(54.5%) used elemental diet and the average daily energy intake was 950.0 ± 216.1 kcal.
§2 The date indicates the mean ± standard deviation of the five days dietary intakes.
§1 Student's t -test was used to calculate the statistical significance(p < 0.05).
16.2 : 15.2 : 68.6 15.6 : 27.3 : 57.1 Nutrients / day §2
CD (n=11) §3 UC (n=11)
P value §1 Table 2. Nutrients and Food intake in Crohn’s disease patients
―
Comparison with ulcerative colitis patients
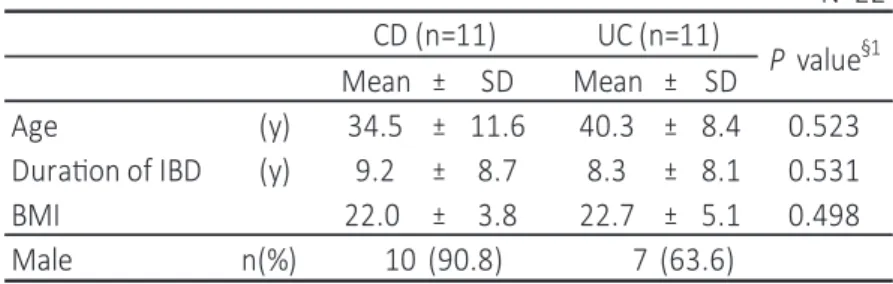
―N=22 Mean ± SD Mean ± SD
Age (y) 34.5 ± 11.6 40.3 ± 8.4 0.523 Duration of IBD (y) 9.2 ± 8.7 8.3 ± 8.1 0.531
BMI 22.0 ± 3.8 22.7 ± 5.1 0.498
Male n(%) 10 (90.8) 7 (63.6)
§1 Student's t -test was used to calculate the statistical significance(p < 0.05).
CD (n=11) UC (n=11)
P value §1
Table 1 Characteristics of subjects
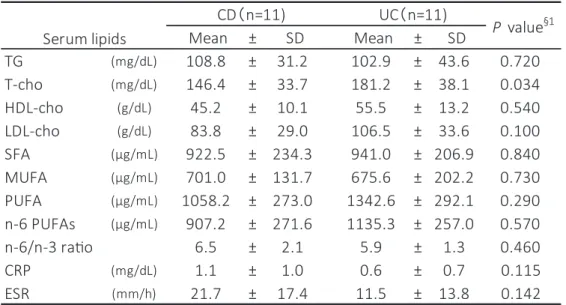
than the UC group (p<0.05). Fish and shell- fish intake in the CD group was 51.9 ±50.0 g and was not significantly different between the groups (Table 2). In the CD group, serum n-3 PUFAs (147.8±34.5 μ g/mL), and DHA (83.3
±22.2 μ g/mL) levels were significantly lower than in the UC group (p<0.05), and the n-6/n-3 serum ratio of 6.5 ±2.1 (5.9 ±1.3 in the UC group) was high. Additionally, the CRP level was 1.1 ±1.0 mg/dL and the ESR was 21.7 ±
17.4 mm/h in the CD group (Fig.2, Table3).
4.Conclusions
The n-3 PUFAs intake in the CD group was lower than that in the UC group. The n-6/n-3 intake ratio and serum n-6/n-3 ratio in both groups were high. In the CD group of the n-3 PUFAs, EPA and DHA intakes were particular- ly low. Increasing intake of EPA- and DHA-en-
Fig. 1 Intake of n-3 PUFAs, EPA, and DHA in Crohn’s disease patients
―
Comparison with ulcerative colitis patients
―:
* Student’s t-test was used to calculate the statistical significance(p < 0.05)
Fig. 2 Serum n-3 PUFAs, EPA, and DHA in Crohn’s disease Patients
―Comparison with ulcerative colitis patients
―:
* Student’s t-test was used to calculate the statistical significance (p < 0.05)
N-3 polyunsaturated fatty acids intake and serum fatty acid levels in patients with Crohn’s Disease
riched foods (e.g., fish) would be able to im- prove serum n-3 PUFAs levels and alleviate inflammation
4).
Reference
1) ASPEN: Leading the Science and Practice of Clinical Nutrition ⓒ Copyright 2017 American Society for Parenteral and Enteral Nutrition
(ASPEN)
2) Shoda R, Matsueda K, Yamato S et al.:Epidemi- ologic analysis of Crohn disease in Japan in- creased dietary intake of n-6 polyunsaturated fat-
ty acids and animal protein relates to the increased incidence of Crohn disease in Japan, American Journal of Clinical Nutrition, 63, 741 - 745, 1996.
3) Andrea B, Corrado B, Massimo C. et al.:Effect of an Enteric-Coated Fish-Oil Preparation on Re- lapses in Crohn’s Disease, The New England Journal of Medicine, 334(24), 1557 - 1560, 1996.
4) Michael JJ, Robert AG, Leslie GC: Dietary poly- unsaturated fatty acids and inflammatory media- tor production, American Journal of Clinical Nu- trition, 71(suppl), 343 - 348, 2000.
N=22
Mean ± SD Mean ± SD
TG (mg/dL) 108.8 ± 31.2 102.9 ± 43.6 0.720
T-cho (mg/dL) 146.4 ± 33.7 181.2 ± 38.1 0.034 HDL-cho (g/dL) 45.2 ± 10.1 55.5 ± 13.2 0.540 LDL-cho (g/dL) 83.8 ± 29.0 106.5 ± 33.6 0.100
SFA (μg/mL) 922.5 ± 234.3 941.0 ± 206.9 0.840
MUFA (μg/mL) 701.0 ± 131.7 675.6 ± 202.2 0.730
PUFA (μg/mL) 1058.2 ± 273.0 1342.6 ± 292.1 0.290
n-6 PUFAs (μg/mL) 907.2 ± 271.6 1135.3 ± 257.0 0.570
n-6/n-3 ratio 6.5 ± 2.1 5.9 ± 1.3 0.460
CRP (mg/dL) 1.1 ± 1.0 0.6 ± 0.7 0.115
ESR (mm/h) 21.7 ± 17.4 11.5 ± 13.8 0.142
Serum lipids
CD ( n=11) UC ( n=11)
P value §1
§1 Student's t -test was used to calculate the statistical significance(p < 0.05).
Table 3 Serum lipid composition in Crohn’s disease patients
―