DOCTORAL Dissertation
Feeding Habit Analysis of Early Life Fishes in the East China Sea, based on Ultra-sensitive Stable Isotopes Analyses
Weiping Mei
Graduate School of Fisheries and Environmental Sciences Nagasaki University
May 2018
1
TABLE OF CONTENTS PAGE
Contents……….…...….……1
List of Figures ………...……3
List of Tables ………5
Abstract ……….…...….……7
Abbreviations ……….….…….11
Chapter 1. General introduction and background information………….…...…15
1.1 Importance of ecological studies on larval and juvenile fishes in fishery resource management 1.2 Background information of early life fishes in the ECS 1.2.1 Hydrodynamics in the East China Sea 1.2.2 Ecological characteristics of mesopelagic fishes at early life stage 1.2.3 Ecological characteristics of the larvae of T. japonicus, a representative epipelagic fish 1.3 Feeding habit analysis methods of fish larvae and juveniles 1.3.1 Stomach content analysis 1.3.2 Molecular biology analysis 1.3.3 Stable isotope analysis 1.3.4 Other methods 1.4 Factors affecting SI ratios of fish larvae or juveniles 1.4.1 Turnover, half-life time and trophic enrichment factor of SIA 1.4.2 The maternal effect on SI ratios of fish larvae 1.4.3 Other factors 1.5 Objectives of the present study Chapter 2. Improvements for stable isotopes analyses of fish larvae………39
2.1 Ultra-sensitive EA/IRMS system setting 2.2 Minimizing contamination 2.3 Correction of the effect of the preservation methods on SI ratios Chapter 3. Feeding habits of mesopelagic fish larvae and maternal effect on stable isotope ratios……….………49 3.1 Introduction
3.2 Materials and methods
3.2.1 Study area and sample collection
3.2.2 Sample preparation and analysis
3.2.3 Statistical analysis
2
3.3 Results
3.3.1 Isotopic compositions and its shift with body weight 3.3.2 Spatial distributions of δ
13C and δ
15N
3.3.3 Isotopic comparisons of the larval fishes between 2009 and 2010 3.3.4 Isotopic niches overlap among 6 species fishes in the late larval period 3.4 Discussion
3.4.1 Correlations between isotopes and other variables
3.4.2 Fish species- and weight-specific δ
15N values in the larval stage 3.4.3 Food sources and isotopic niches overlap among 6 species fish larvae 3.5 Conclusion
Chapter 4. Factors controlling on spatiotemporal variations in stable nitrogen isotopes of Trachurus japonicus ……….………89 4.1 Introduction
4.2 Materials and methods 4.2.1 Sample collection
4.2.2 Sample preparation and stable isotope analysis 4.2.3 Data analysis
4.3 Results
4.3.1 Spatial variations in SI ratios 4.3.2 Interannual differences in SI ratios
4.3.3 Relationship between SI ratios and other variables 4.4 Discussion
4.4.1 Spatial difference in δ
15N values between NECS and SECS 4.4.2 Interannual differences in δ
15N values of T. japonicus juveniles 4.4.3 Food sources and isotopic niche overlaps
Chapter 5. General discussion ………...…….……...…………117 5.1 Contribution of “breeder type identification based on stable isotopes” to fishery resources analyses
5.2 Is sample of individual fish necessary for SIA of larval fish?
5.3 Feeding habit analysis for fish larvae and juveniles
5.4 Implications for the improved management of fish resources
Acknowledgments ………...…...…137
References ………....………139
3
List of Figures
No. Text Page 1.1 A framework for life cycle of fish and its related influencing factors……...…35 1.2 Map of East China Sea, showing various water masses and currents,
and spawning areas of some fishes………36 1.3 Figure for life history of mesopelagic and epipelagic fishes………...…37 1.4 A framework presenting feeding habit analysis of fish larvae/juveniles
and its related influencing factors ………… ………..…….38 2.1 Dimensions and composition of the original EA oxidation and reduction
columns and the modified columns for conventional and ultra-sensitive
EA/IRMS, respectively………..……. ………..……45 2.2 Comparison of conventional and ultra-sensitive EA/IRMS for 0.32 mg
L-alanine………..….……46 2.3 Calibration lines for isotope ratio, content, and peak area for carbon
and nitrogen used L-alanine as standard in this study……….…..…47 2.4 Blank contamination of carbon content to stable isotope analysis….…...…....48 3.1 Adult fish sampling stations (a) for Diaphus slender type, L. ochotensis
and M. asperum in Feb. and Mar. 2008 and S. gracilis and V. nimbaria in Feb. 2015, and larval fish sampling stations (black dots) in (b) Feb.
2009 and (c) Feb. 2010 in the Kuroshio waters of the northeastern East
China Sea, on a map of sea water temperature at 200-m depth layer……...75 3.2 Relationships between body weight (dry-weight) and tissue isotopes
(δ
13C and δ
15N) in 6 taxa of larval fishes in February 2009 and 2010……..…76 3.3 Plots for the core isotopic niche spaces of 6 taxa of fishes during the
late larval period ………..……77 3.4 Stable isotopes measured in the targeted mesopelagic fish larvae, and
those estimated for eggs of an “income breeder”, for estimation of
spawning strategy……….……78
S3.1 A schematic diagram of fish species- and weight-specific patterns in
4
tissue isotopes during the growth of fishes in the larval stage………..……..…86 S3.2 Concept for estimating spawning strategy of the targeted fish species
in the natural environment based on the stable isotopes………....…87 4.1 Map of East China Sea showing the sampling stations in April from
2005 to 2010. ………...109 4.2 The δ
13C-δ
15N diagram of T. japonicus individuals collected in the East
China Sea over 6 years between 2005 and 2010 with the samples of
all sizes and 13.0–17.9 mm SL………..…..110 4.3 Spatial differences in stable isotopes and SL of T. japonicus between
the NECS and SECS in each year between 2005 and 2010………....111 4.4 Interannual differences in stable isotopes and standard length (SL) of
T. japonicus juveniles (SL > 13.0 mm) distributed in the SECS…………....112 4.5 Comparison of stable isotope ratios between epipelagic T. japonicus
larvae (8–12.9 mm SL) and mesopelagic fish larvae (6–18mm SL)
distributed in the East China Sea (ECS) in 2009 and 2010……….…...113 S4.1 A δ
13C-δ
15N diagram of T. japonicus individuals for each SL rank in the
East China Sea over six years between 2005 and 2010………..…....116 5.1 Hypothesis to judge fish breeder type in the field based on stable isotopes…132 5.2 Variation of breeding strategy according to the proportion of the energy
sources; potential plasticity of breeding strategy under climate and other environment change; and changes in the superiority of breeding strategy
in environmental deterioration from the viewpoint of fish egg production...133 5.3 A schematic of a comparison of stable isotope variations of fishes or
other organisms based on stable isotope analysis using fish individual
and mixed sample.………..…….…134 5.4 A framework for feeding habit analysis of fish larvae and juvenile by
using different methods.………..………..….….135 S5.1 Simulated comparison of the contribution of different diets to consumer based
on the results from (a) conventional SI analysis using multiple samples and (b)
ultra-sensitive SI analysis using single sample.………..……...….….136
5
List of Tables
No. Text Page 1.1 Background information of six taxa of mesopelagic fishes ………….…….…33 1.2 Half-life time and TEF values in stable isotopes of some larval or juvenile
fishes based on rearing experiment ………....……34 3.1 Isotopic compositions (δ
13C and δ
15N) of 6 taxa of mesopelagic fish
larvae in the ECS ……….……..…….71 3.2 Overlap percentage of SEAc among 6 taxa of mesopelagic fishes during
late larval period………..…. ………...……..72 3.3 Relationships (spearman r values) between isotopes of fishes in the
larval stage and other variables……….……..………73 S3.1 The nonlinear correlations between dry-weight and SL………...…...83 S3.2 Median δ
13C and δ
15N ratios for 6 taxa of mesopelagic fish taxa during
late larval period………..….….…...84 S3.3 Median SL, δ
13C and δ
15N ratios of 6 taxa of mesopelagic fishes during
early larval period in the area west and east of Kuroshio axis………….…....84 S3.4 Stable isotopes in particulate organic matter (POM) collected at the
area east of Kuroshio axis in November 2012………...…..85 4.1 Pearson correlation coefficients between stable isotope ratios and other
variables………...……….……107 S4.1 Sampling information of T. japonicus………...114 S4.2 The number of the T. japonicus samples for each SL rank during every year..115 5.1 Comparison of predicted values and measured values of isotope ratios of
L-alanine mixture samples.………...……….…………..…130
5.2 Comparisons of conventional and ultra-sensitive stable isotope analysis...131
6
7
Abstract
With the increasement in fish consumption in the world, fisheries production including aquaculture has increased dramatically, but if sustainable fisheries management is not implemented, fisheries resources will decrease steadily. In general, the variation in the biomass of adult fish can be explained by the juvenile recruitment variability. Several species of early life fishes (including larvae and juveniles) have been reported that those showing fast growth in food-abundant environment have low mortality rate or high survival rate. Actually, the relationship between food resources and growth rate of Trachurus japonicus larvae and juveniles is reported in the East China Sea (ECS), where is a spawning and nursing ground for many commercially- important species. However, there are still many unknown points for the fishery resources in the ECS, such as the prey species and food competitions of early life fishes, and the effect of climate and other environmental changes.
In this thesis, Chapter 1 provides a general background information from the literature review on the importance of research on early life fishes, the hydrography of the ECS, and the feeding ecology of representative species distributed in the ECS. In addition, although stomach/gut content analysis and molecular biological approach have been carried out, the lower feeding incidence (i.e. high emptying rate of stomach/gut content) limits the feeding habit analysis of some species of fish larvae.
Thus, I reviewed the current status and problems of feeding habit analysis of early life fishes using conventional stable isotope analysis (SIA) method and discussed the possibility of improvement of SIA. Finally, I described the purpose of this study to clarify the feeding habits of representative larval fish.
Chapter 2 provides an ultra-sensitive elemental analyzer/isotope ratio mass
spectrometer (EA/IRMS) system for stable isotope analysis for feeding habits analysis
of very small-size fish individuals. To minimize the contamination beyond fish samples
8
themselves, different pretreatments on the capsules in which the sample is wrapped were compared. Furthermore, a correction of the effect of preservation methods on stable carbon and nitrogen isotope ratios (δ
13C, δ
15N) was also carried out.
Chapter 3 discusses the feeding habits of six taxa of mesopelagic fish larvae, and the shift in δ
13C and δ
15N along the development, based on the field samples collected from the Kuroshio waters of the northeastern ECS. The δ
13C and δ
15N of larval fishes showed large variation during early period of the larval stage. It suggested maternal effects from parents (i.e. some SI characters of parent fishes are transferred into larval individuals), and non-selective feeding on a variety of plankton species due to poor swimming ability. The similarity between stable isotope (SI) ratios measured in larval tissues and those estimated for eggs of an “income breeder” in the spawning area support an “income breeder” strategy in Diaphus slender type and Vinciguerria nimbaria, while Lipolagus ochotensis seemed to show “capital breeder”-like characteristics. SI ratios of the fish larvae became relatively constant at species-specific body dry-weights (0.51.0 mg), probably due to the commencement of selective feeding, meaning SI ratios during late larval periods could be used for trophic position analysis. There was great overlap (44.6–76.5%) in trophic niche among the larval fishes within the same taxonomic family of Myctophidae. Even if principal diet components cannot be identified with gut contents analysis for some fish species, diet information from other fish species occupying a similar isotopic niche can thus improve our understanding of the diets of larval fishes, using ultra-sensitive SIA method.
Chapter 4 deals with the factors controlling the spatial and interannual shifts in SI values of Japanese jack mackerel Trachurus japonicus larvae and juveniles sampled in the shelf break region of the ECS in April during six consecutive surveys (2005–2010).
The δ
13C values of fish were similar between northern and southern ECS. Spatial
distribution showed that the δ
15N of fishes were higher in the southern ECS, probably
9
because of the lower nitrogen fixation and the presence of larger body size of fish occupying a higher trophic level. Interannual variations in δ
15N of T. japonicus juveniles might be mainly contributed by the variation in the abundance of the main diet such as Oncaeidae copepodites and Corycaeus. The isotopic overlaps between epipelagic T. japonicus larvae and other dominant mesopelagic fish larvae were negligible, suggesting lesser competition for food sources. Knowledge regarding spatiotemporal variation of SI ratios of T. japonicus can be applied to understand the feeding habits and migrations of other fishes in the ECS, thus will be effectively used for fishery resource management.
Chapter 5 discusses applicability and limitations of breeding strategy analysis by
using SI of fish individuals in detail. The breeding strategy is not entirely fixed for each
fish species but has plasticity depending on the environment. A “capital breeder”-like
fish can maintain the quality of egg production even if the spawning environment
become worse (e.g. decreased food resources). Therefore, the SIA can greatly
contribute to the analysis of breeding strategy of fishes, especially in relation to the
variations in fishery resources and environmental factors. Moreover, it is discussed in
detail that ultra-sensitive SIA for fish individual can avoid underestimating the
deviation of isotopic ratios among individuals, leading to correct feeding habit analysis
of early life fishes. Although many feeding habit analyses has been carried out by
conventional SIA method, it is critical for us to consider the accurate analytical
techniques and potential effects of both biological and environmental factors on SI
ratios of early life fishes.
10
11
Abbreviation List
AGR: Absolute Growth Rate (mm d
-1) ANOVA: Analysis of Variance
ANCOVA: Analysis of Covariance
CalC: Carbon content of Calanidae copepodites and adults (mg C 1000 m
-3) Chl.a: Chlorophyll a
CTD: Conductivity-Temperature-Depth profiler DIC: Dissolved Inorganic Carbon
DIN: Dissolved Inorganic Nitrogen DON: Dissolved Organic Nitrogen DNA: DeoxyribonucleicAcid
EA/IRMS: Elemental Analysis - Isotope Ratio Mass Spectrometry FHA: Feeding Habit Analysis
G: relative growth (standardized IGR) GCA: Gut Content Analysis
IGR: Instantaneous Growth Rate (% d
-1)
NCBI: National Center for Biotechnology Information genebank OC: Oxidation column (of EA/IRMS equipment)
OncC: Carbon content of Oncaeidae copepodites (mg C 1000 m
-3) ParC: Carbon content of Paracalanidae copepodites (mg C 1000 m
-3) POM: Particulate Organic Carbon
POM: Particulate Organic Matter
RC: Reduction column (of EA/IRMS equipment) RNA: Ribonucleic Acid
SCA: Stomach Content Analysis SD: Standard Deviation
SEA: Standard Ellipse Area
SEAc: SEA after small sample size correction
12
SI: Stable Isotope
SIA: Stable Isotope Analysis SIAR: Stable Isotope Analysis in R
SIBER: Stable Isotope Bayesian Ellipses in R SL: Standard Length or body length
SST: Sea Surface Temperature T
20: Temperature at 20-m depth TEF: Trophic Enrichment Factor VPDB: Vienna Pee Dee Belemnite
Location, water mass and current
AEKA: the area east of the Kuroshio axis AWKA: the area west of the Kuroshio axis CCC: China Coastal Current
CDW: Changjiang Diluted Water ECS: East China Sea
ECSSSW: East China Sea Shelf Surface Waters KBCNT: Kuroshio Branch Current North of Taiwan KBCWK: Kuroshio Branch Current West of Kyushu KIW: Kuroshio Intermediate Water
KSW: Kuroshio Surface Water
KTW: Kuroshio Tropical Water
NECS: Northern East China Sea
SECS: Southern East China Sea
TSW: Taiwan Strait Water
TSWC: Tsushima Warm Current
YSCW: Yellow Sea Cold Water
YSCoW: Yellow Sea Coastal Water
YSWW: Yellow Sea Warm Water
13
Terminology of early life history stages
Notes: Terminology of early life history stages on upper panel is partly extracted from the descriptions in Kendall et al. (1984).
In the Chapter 3 of this thesis, larval stage was separated according to the characteristics of stable isotopes (SI) for the convenience of the explanation: the period with variable SI ratios, and the period with constant SI ratios with standard deviations less than 0.4‰.
The exact body length ranges of the targeted mesopelagic fishes at each development stage (e.g. flexion stage, post-flexion stage, transformation stage, and juvenile stage) are not previously reported. And the category of this conventional development stages does not match to new category based on SI ratios. In this study, therefore, the period of larval fishes lighter and heavier than the species-specific dry weight (hereafter W
s) were termed as “early larval period” and “late larval period”, respectively. Furthermore, the larval fish during those periods were correspondingly termed as “early larval fish”
and “late larval fish”. W
sindicate the dry weights of fish after delipidation when the
stable isotope ratios become stable (< 0.4‰ standard deviation, see explanation in
Chapter 3).
14
15
Chapter 1
General introduction and background information
1.1 Importance of ecological studies on larval and juvenile fishes in fishery resource management
The world’s fisheries and aquaculture sectors have gone through a dramatic development in the last 70 years, and there have been large increases in their production.
Total world fish production was only 19.3 million tonnes in 1950, and it dramatically increased to 174 million tonnes in 2017 (FAO 2011, 2018). Correspondingly, fish stocks will decrease if there is no effort to restore the ecosystem, such as the case in the Mediterranean where ca. 34% of fishery resource were exhausted (Vasilakopoulos et al.
2014; Piroddi et al. 2017). Besides, a global meta-analysis across 262 fish stocks in 39 large marine ecosystems suggested fundamental biological change in fish stock productivity at early life stages (Britten et al. 2016). For example, the maximum recruitment capacity (i.e. the juvenile production of each spawning stock size) per decade has declined at a rate of ca. 3% on average, compared with the historical maximum recruitment capacity in global fish stocks (Britten et al. 2016). The fluctuations in fish stock is commonly associated with the variability of fish recruitment (i.e. survival of fish larvae and juvenile offspring) (Pepin and Myers 1991; Britten et al.
2016).
On the other hand, even a slight change in breeding strategy of adult fish
16
corresponding to environmental changes can result in a shift in the quantity and quality of fish egg (McBride et al. 2015), subsequently a shift in fish larvae and juvenile production. In addition to the factors affecting fish egg, there are also many other factors affecting the fish recruitment, which are often associated with different hypotheses to explain recruitment variability (Houde 2008). These hypotheses mainly include
“Critical Period” hypothesis (i.e. failure of finding suitable prey in sufficient quantity during first-feeding stage, in other words, during critical developmental stage, would lead to massive mortality and order-of-magnitude losses of larvae in a short span of time, Hjort 1914), “Match-Mismatch” hypothesis (e.g. a match in seasonal timing of fish spawning and larval production with the spring zooplankton bloom was critical for promoting strong year-classes of fishes inhabiting temperate or high-latitude waters, Cushing 1990), and “Ocean Stability” hypothesis (e.g. disturbance and mixing of preferable prey by storms could cause mass mortality in upwelling waters because of poor food conditions, Lasker 1975). All above hypotheses highlight that food sources and related environmental factors are very important for the survival of larvae and juveniles.
In detail, it has been reported that recruitment variability could be affected by
temtemperature, interspecific interactions, and spawner effects (i.e. abundance, age,
and physiological condition of adults) (Pritt et al. 2014). For example, when the mixed
layer of Kuroshio Extension region was deep in winter, the phytoplankton bloom occurs
due to enough nutrient supplies in spring, then cause an increase in zooplankton density,
finally result in a high survival (low mortality) of Japanese sardine (Sardinops
17
melanostictus) larvae and juveniles (Nishikawa and Yasuda 2008). Their results were correspondent with the reports that the mortality from predation was lower for Japanese sardine larvae with a higher grwoth rate, and resulting in higher survival rate (Takasuka et al. 2007; Takasuka 2009). Hence, it’s important to link the study on food availability for early life fishes to recruitment variability (Fig. 1.1).
Similarly in the East China Sea (ECS), the higher phytoplankton productivity during the flexion and post-flexion stage (5–11 mm body length) was found to be important to growth rate and subsequet survival of juvenile Japanese jack mackerel (Trachurus japonicus) (Takahashi et al. 2016).
However, many points (e.g. the fish-species specific diet compositions, and food competition among fish species) are still left to be clearly explanined even from stomach content analysis for early life fishes, especially for those fishes in small body size and/or low feediing incidence. If above-mentioned points are not clear, it’s difficult to judge which fish species have higher potential to survive against future environmental changes such as climate change, which could affect the components at lower trophic positons (e.g. plankton species and their distribution) in the ECS. Thus, further studies on the survival strategy related to food sources, food competitions etc.
of early life fishes are essential, combining with the effect of environmental and other biotic factors (Fig. 1.1).
1.2 Background information of early life fishes in the ECS
1.2.1 Hydrodynamics in the East China Sea
18
The East China Sea (ECS) is a largest marginal sea surrounded by China mainland,
Taiwan Island, Ryukyu Islands, and Korean peninsula. The oceanographic conditions
are very complicated, because the ECS is influenced by several currents and water
masses, notably the China Coastal Current (CCC), Changjiang Diluted Water (CDW),
and Kuroshio Current (Fig. 1.2). The branch of Kuroshio current intrudes from
northeastern Taiwan onto the continental shelf of ECS (i.e. KBCNT), while another
branch turns northward along 128–127°E (i.e. Kuroshio Branch Current west of Kyushu,
KBCWK) and then meet with Tsushima Warm Current (TSWC). Generally, CCC flow
southward from Yellow Sea, Changjiang mouth to Taiwan, while offshore waters flow
northward along the Kuroshio Surface Water (KSW) in winter (Chen 2008). The
freshwater discharges from Changjiang River (i.e. CDW) also affect the hydrographic
system of the ECS, especially during summer. The subsurface Kuroshio Tropical Water
(KTW) and Kuroshio Intermediate Water (KIW) flow eastward onto the shelf break
region of ECS throughout the year (Chen et al. 1995; Chen 2009). The near-surface
waters of ECS exchange with surface waters of the nutrient-rich South China Sea (SCS)
through the Taiwan Strait (Chen and Wang 1999; Chen 2009). A permanent upwelling
in the northeast of Taiwan is found as the major contributor of nutrients sources to the
southern ECS (Gong et al. 1997; Wong et al. 2000). The temperature and salinity of
three main water masses are various: CCC exhibits low temperature, low salinity in
winter; the Taiwan Strait Water (TSW) with high temperature, low salinity in summer,
but weak in winter; KSW with high temperature, high salinity throughout the year
(Chen et al. 2014).
19
ECS become one of the most important spawning and nursery ground in the western North Pacific for both commercial fishes (e.g. Japanese sardine Sardinops melanostictus and chub mackerel Scomber japonicus; Sugisaki et al. 2010; Chen et al.
2014) and mesopelagic fishes (e.g. Japanese lanternfish Notoscopelus japonicus and Eared blacksmelt Lipolagus ochotensis; Sassa and Hirota, 2013), especially in winter and spring. And some early life fishes are reported to be distributed in the different water mass depending on morphological development. For example, Japanese jack mackerel Trachurus japonicus primarily spawn in the continental shelf of southern ECS during later winter and early spring (Sassa et al. 2008a; Yoda et al. 2014). Their newly hatched larvae are entrained northward by the Kuroshio Branch Current north of Taiwan (KBCNT) in spring, thereby the juveniles mainly appear in the northern ECS in early summer (Sassa et al. 2006, 2008a).
1.2.2 Ecological characteristics of mesopelagic fishes at early life stage
Mesopelagic fishes, with a biomass of at least 10 billion tons, dominate the world’s
total fish biomass (Irigoien et al. 2014). These fishes are important food sources for
commercially important fish species such as yellowfin tuna Thunnus albacares (Potier
et al. 2007). Since most species show active diurnal vertical migration (Fig. 1.3)
(Watanabe et al. 1999; Luo et al. 2000; Yatsu et al. 2005), they also have important
implications for biogeochemical cycling in the ocean. For instance, mesopelagic fishes
provide trophic connectivity and transport organic carbon between the surface and the
mesopelagic layers (Kaartvedt et al. 2012; Irigoien et al. 2014).
20
The larvae of several mesopelagic fishes, such as Diaphus slender type, Myctophum asperum, and Notoscopelus japonicus (Myctophidae), Lipolagus ochotensis (Microstomatidae), Sigmops gracilis (Gonostomatidae), and Vinciguerria nimbaria (Phosichthyidae), dominantly occur in the continent shelf of the ECS during winter (Sassa et al. 2004; Watanabe et al. 2010; Sassa and Hirota 2013; Sassa and Konishi 2015). The exact body length ranges of most of the above mesopelagic fishes at each development stage (e.g. flexion stage, post-flexion stage, transformation stage, and juvenile stage) are not previously reported, although many studies have been done for commercially important species. During larval stage, mesopelagic fishes are known to be widely distributed in the upper layer (e.g. 25–80 m depth for Diaphus slender type, M. asperum, and N. japonicas), while they move to the mesopelagic zone when they begin to transform to juvenile stage: further information of habitat depth and seasonal occurrence of representative mesopelagic fish larvae are listed in Table 1.1.
The overlaps in horizontal and vertical distributions between mesopelagic fish larvae (e.g. Myctophids, L. ochotensis, V. nimbaria) and small epipelagic fishes (e.g.
sardine and anchovy) were found in the Kuroshio-Oyashio transition area during spring
(Kubota 2004). Hence, there are possibilities of competition for food sources and/or
habitats between mesopelagic and epipelagic fishes. Whereas, it is a challenge to
investigate the feeding habits of mesopelagic fish larvae, because of the small size and
high empty rate of stomach/gut contents (e.g. >80% gut contents in Diaphus slender
type, N. japonicus and L. ochotensis were digested materials and not identified; C Sassa,
unpublished data)
21
1.2.3 Ecological characteristics of the larvae of T. japonicus, a representative epipelagic fish
The larvae of several commercially important fishes, such as Japanese jack mackerel Trachurus japonicus (Sassa et al. 2006), Japanese amberjack Seriola quinqueradiata (Yamamoto et al. 2007), Chub mackerel Scomber japonicus, and spotted mackerel S. australasicus (Sassa and Tsukamoto 2010), are distributed in the ECS. Of these species, T. japonicus larvae have been widely studied in the ECS, from a view point of a variety of ecological topics including their distribution, migration, growth, food sources, survival strategy, and so on. Formation of spawning ground of T.
japonicus is related to topographic rather than hydrographic conditions, based on study of interannual variations in distribution and abundance of T. japonicus larvae (Sassa et al. 2016b). Besides, the spawning period ranges from January to June in different locations; January and March in the southern ECS, April and May in the northern ECS or southern Kyushu, Japan (Yoda et al. 2004). Meanwhile, spawning temperature also shows a large range from 15ºC to 26ºC with an optimal spawning temperature of 20–
23ºC (Ochiai et al. 1983; Yoda et al. 2004). After spawning, habitat temperature for fish
larvae in southern ECS is 3–5 ºC warmer than that in the northern ECS, suggesting the
connection with higher growth rates of the larvae in the southern ECS (Sassa et al. 2006,
2016b). The growth rate of T. japonicus larvae are positively correlated with habitat
temperature and food availability (Sassa et al. 2014). Furthermore, the growth rate
during the flexion and post-flexion stage (5–11 mm body length) enhanced from higher
plankton productivity, is well-related to the juvenile survival of T. japonicus than the
22
growth rate during the early larval stage (Takahashi et al. 2016).
The larvae of T. japonicus starts first feeding in the 4
thdays after hatching with ca.
3.1 mm body length, despite of a weak visual acuity (Umeda and Fujioka 1988). It mainly preys on copepod nauplii and Paracalanus parvus, and their feeding incidence is ca. 80% when body length is less than 4 mm, and increases to 100% when 4–10 mm (Sassa et al. 2008a).Their prey size increases with larval development, but niche breadth does not change along the larval stage (Sassa et al. 2008a).
As mentioned above, the potential competition for food sources and/or habitats between T. japonicus larvae and mesopelagic fish larvae is critical issue but remain unclear because the information (e.g. stomach/gut contents and their spatiotemporal variations) of mesopelagic fish larvae is limited.
1.3 Feeding habit analysis methods of fish larvae and juveniles 1.3.1 Stomach content analysis
Using the residual prey items in stomach or gut of fish, stomach content analysis
(SCA) or gut content analysis (GCA) is the most basic and intuitive method to achieve
the feeding habits of fish. The greatest benefit of SCA or GCA is that it can be used to
identify the diet of fish in species level through their morphological characteristics. For
example, based on the GCA, it was clarified that T. japonicus larvae less than 5 mm
standard body length (SL) in the Kuroshio frontal area of the southern East China Sea
(ECS) mainly feed on copepod nauplii and copepod eggs, rather than those copepod
copepodites with relatively high swimming ability (Hirota et al. 2016). T. japonicus
23
larvae more than 5 mm SL mainly fed on copepod copepodites and/or copepod eggs at 0–30 m depth, while mainly fed on copepod copepodites at depth deeper than 30 m.
Hence, if the stomach or gut contents are mostly identified into species level, the GCA or SCA is very effective for feeding habit analysis.
However, the smaller-size diets of fish larvae are more difficult to identify, particularly when the shape of diets is incomplete due to digestion (Rønnestad et al.
2013). Besides, some fish larvae or juveniles show high rate of empty stomach. For example, 80–95% of gut contents in Diaphus slender type, Notoscopelus japonicus and Lipolagus ochotensis were digested materials and not identified (C. Sassa, unpublished data). Further, the stomach or gut contents always used to reflect their recent food sources just before sampling, rather than long-term integrated-feeding habits. Hence, the empty or digested stomach contents of fish and the limited information on the diet which the fish incorporated just within a few hours are the other demerit for SCA and GCA.
1.3.2 Molecular biology analysis
The limitation of visual observation method (e.g. microscope) due to very small or incomplete food organisms evoke the necessity of an identification method with higher taxonomic resolution.
In the past, the RNA/DNA ratio had been used to assess the feeding conditions of
fish larvae (i.e., high RNA/DNA ratios indicate good conditions for growth, whereas
low RNA/DNA ratios indicate poor conditions for growth) (Theilacker et al. 1996). It’s
24
based on the theory that the amount of DNA in each cell is reported to be constant, whereas the amount of RNA was considered to be related with the amount of protein synthesis associated with cell division and proliferation (Miller and Kendall 2009).
Recently, with the development of molecular biology technologies and the continuous expansion of their database (e.g. NCBI and SILVA) of worldwide organisms, its’ application to the diet analysis of small-size larval and juvenile fish has become possible. For example, the identification of fish larvae by using mitochondrial 16S ribosomal RNA (16S rRNA, with its fragment of ca. 610 bp), while the V9 hyper- variable region in the nuclear gene coding 18S ribosomal RNA (18S rRNA, V9 region of ca. 130bp) is used to detect dominant eukaryotic taxa present in gut contents which cannot be detected by visual observation. If the 18S analysis could not reach a species- level identification of gut contents (mostly Copepods, e.g. Calanidae and Paracalanidae), a higher taxonomic resolution metagenetic method by using 28S ribosomal DNA D2 region (ca. 350–400 bp) is optimized (Hirai et al. 2015).
Based on 18S rRNA technique, the diet of European eel Anguilla anguilla larvae (Body length of 9.2–24.7 mm) was estimated to be mainly consist of gelatinous plankton which is difficult to identify by microscopic technique (Ayala et al. 2018). By the combined 16S rRNA, 18S rRNA and 28S rDNA analyses, the main diets for larval fish of Japanese sardine Sardinops melanostictus (body length of 4.0–9.1 mm) and Pacific round herring Etrumeus teres (4.3–9.5 mm) were successfully identified to be the eggs or nauplii of copepod Calanus sinicus (species level, Hirai et al. 2017).
Molecular biology method has benefit for the identification of the small-size diets
25
(e.g. eggs or nauplii of copepod) in species level. But this method also provides the limited information on the feeding habit reflecting just short period, similarly with the SCA and GCA.
1.3.3 Stable isotope analysis
Unlike SCA, GCA, and molecular biology method, the stable isotope analysis (SIA) is effective for elucidating the time-integrated structures and dynamics of food webs, including both short term (e.g. based on stable isotopes in the tissue with rapider metabolism: liver of fish) and long term (e.g. based on stable isotopes in the tissue with slower metabolism: muscle of fish) -integrated feeding habits. And it is possible to analyze the feeding habits when diets of fish cannot be identified due to empty stomach/gut contents.
Empirically, the nitrogen stable isotope ratio (δ
15N), which generally exhibits 2–4‰
enrichment in animals compared to their diets, is a robust tool for estimating trophic
positions (Minagawa and Wada, 1984; Vander-Zanden and Rasmussen, 2001; Post,
2002; McCutchan et al. 2003). On the other hand, carbon stable isotope ratio (δ
13C)
exhibits only 0.5–1.2‰ enrichment between each trophic level. δ
13C values vary
substantially among different primary producers, because the primary producers have
different carbon-related photosynthetic pathways, thus δ
13C is commonly used for
determining original dietary sources (Fry and Sherr, 1984; Vander-Zanden and
Rasmussen, 2001; McCutchan et al. 2003). Based on SIA, the diet of larvae of eight
fish species (5–17.9 mm SL) from the Amazon floodplain were estimated to be mainly
26
C4 grasses, although their main energy sources are C3 plants (Leite et al. 2002).
Lanternfish (Myctophidae, 42–122 mm SL) was reported to have spatial variations in their diet (Flynn and Kloser 2012), and 18 dominant mesopelagic fish species (13–193 mm SL) in the western Mediterranean were also successfully evaluated that there were differences in trophic positions with overlapping distribution (Valls et al. 2014).
However, if the fish size is too small (e.g. body length < 5 mm), it’s also difficult to analyze single individual sample using conventional SIA method.
1.3.4 Other methods
In addition to the above-mentioned three methods, fatty acid analysis is also an alternative to study the feeding habits of fish. It is based on the fact that each group of organisms has a specific suite of fatty acid markers (Dalsgaard et al. 2003). When diets are eaten by predator, the fatty acid markers, which commonly cannot be synthesized by predator, will be transferred along the food chain (Olsen 1999; Parrish et al. 2000).
For example, fatty acid analysis indicated that the main diets of two cichlid fish species
(Oreochromis niloticus and Sarotherodon galilaeus) are live diatoms (specific fatty acid,
16:1ω7c, and 20:5ω3), bacteria (17:1ω7), and decayed materials [i.e. decayed diatoms
(fatty acid 14:0) and bacteria (odd saturated fatty acids, such as 13:0, 15:0, 17:0, and
23:0; Hama 1999] (Abd El-Karim et al. 2016). Moreover, direct field observation
(Errington 1932) and fecal analysis (Mills 1992) are also used for feeding habits
analyses, even though they are not popular in the diet analysis of fish.
27
1.4 Factors affecting SI ratios of fish larvae or juveniles
When the body sizes of fish larvae or juvenile and their diets are too small to identify, SIA is a robust tool for feeding habit analysis. However, there are several environmental and biotic factors affecting the accuracy of SIA (Fig. 1.4).
1.4.1 Turnover, half-life time and trophic enrichment factor of SIA
Turnover rate or half-life time of SI is generally calculated by the regression equation of the exponential function that fits best for a set of time-course isotopes data [δ = P
3+ P
1*exp(P
2*T)] based on diet-switch experiment (Tieszen et al. 1983). The turnover rate (P
2) means the rate for the isotope of switched diet to be assimilated into the consumer’s tissue. The half-life time [ln(1-50%)/P
2] is the time it takes for the isotope of consumer’s tissue to reach a midpoint between the initial (diet-switch start) and final (isotopic value of consumer’s tissue reaches steady state which is indicated by the asymptotic isotopic value in exponential equation) isotopic values. These knowledges are very important when we apply SIA to investigate the feeding habit and migration of larval and juvenile fish in field. Serval studies have proceeded this point by conducting rearing experiments (Table 1.2).
Suzuki et al. (2005) conducted a diet switch experiment for juvenile Japanese
temperate bass Lateolabrax japonicus and found that the half-life times were similar
for muscle and fin for both δ
13C and δ
15N (i.e. 19.3–25.7 days), while those for liver
were shorter (i.e. 5.3 days for δ
13C and 14.4 days for δ
15N). It suggested that fin or
muscle is suitable to reflect the SI changes in medium or long-time scale, while liver
28
has potential to provide more recent information of diet shift or migration of fish in the juvenile stage.
Bosley et al. (2002) reported that the half-life time of juvenile winter flounder Pseudopleuronectes americanus (fed with rotifers Brachionus plicatilis and switched to brine shrimp Artemia spp.) was significantly affected by temperature for both δ
13C (4.1 ± 0.6 and 2.2 ± 0.3 days at 13°C and 18°C, respectively) and δ
15N (3.9 ± 0.7 and 3.1 ± 0.3 days at 13°C and 18°C, respectively). It suggested that environmental factors have potential effect on the fish growth rate, thus turnover of SI ratios in their body.
This phenomena was also found for summer flounder Paralichthys dentatus that higher temperature resulted in shorter half-life time of SI (Witting et al. 2004).
Tanaka et al. (2010) found that larval Pacific bluefin tuna Thunnus orientalis fed with yolk-sac larvae of spangled emperor Lethrinus nebulosus showed significantly higher δ
15N values and higher growth than those fed with plankton (rotifers and Artemia nauplii), suggesting that growth variations of tuna larvae were different corresponding to different prey species (Table 1.2). Based on the dataset from (Tanaka et al. 2010), I calculated that the half-life time of Thunnus orientalis larvae was very fast (i.e. ca. 1 day) for both δ
13C and δ
15N of “fish larvae fed group”. Uriarte et al. (2016) reported that half-life time for δ
15N of larval Atlantic bluefin tuna Thunnus thynnus (fed with rotifers and switched to yolk-sac larvae of gilthead seabream Sparus aurata) was 2.5 ± 0.3 days.
Species-specific trophic enrichment factor [hereafter TEF, the difference in isotopic
value between two adjacent trophic levels (e.g. primary consumer and primary
29
producer)] of SI is another important factor which affects the SIA applications in the field, although average TEF values have been often applied in food web studies (see section 1.3.3). Herzka and Holt (2000) reported that the TEFs of larval red drum Sciaenops ocellatus were about +1‰ for δ
13C and +1.6‰ for δ
15N. The TEFs of marine fish larvae or juveniles were reported to range widely (i.e. +0.4–4.1‰ and +0.1–5.3‰
for δ
13C and δ
15N, respectively (Le Vay and Gamboa-Delgado 2011). Suzuki et al. (2005) reported that the TEF of Lateolabrax japonicus juveniles showed large ranges for both carbon and nitrogen isotopes in different tissues (i.e. liver < muscle < fin for δ
13C with ranges between –0.80‰ and +3.66‰ and liver < fin < muscle for δ
15N with ranges between +0.59‰ and +3.12‰).
To summarize, these studies indicated that the half-life time of larval and juvenile fish was very short (one or few days), suggesting the possibility that SI values in whole body or muscle could be used to reflect the SI changes (or feeding habit changes) in a short-time scale for fish in the larval stage. Furthermore, there are large differences in TEF according to fish species, organs and development stages, suggesting a species- specific TEF is preferred for feeding habit analysis.
1.4.2 The maternal effect on SI ratios of fish larvae
Generally, maternal effect, defined as the causal influence of the maternal genotype
or phenotype on the offspring phenotype, has been used for fish behavior research
(Heyer et al. 2001). In the stable isotope field, the maternal effect is represented as the
residual SI in early life fish from their parents. Uriarte et al. (2016) reported that the
30
maternal effect on SI ratios of Thunnus thynnus larvae continue till flexion stage (i.e.
the SI values of fish larvae are influenced by two factors: isotopes of their diets, and isotopes of their parents) based on a rearing experiment. In particular, the SI ratios of T.
thynnus larvae around yolk-sac stage were similar with those of eggs of parents, then gradually changed with the diet. After the maternal effect disappeared at flexion stage, the SI ratios of fish could be used for trophic analysis. Therefore, the maternal effect must be considered when we apply SIA for other fishes in larval stage.
1.4.3 Other factors
As mentioned above and in Figure 1.4, the intrinsic biotic factors (turnover rate, TEF, maternal transmission etc.) could be affected by both external biotic factors (e.g.
prey utilization) and environmental factors (e.g. temperature). We should consider the possible influencing factors when we apply SIA to feeding habit analysis of fish larval and juveniles.
1.5 Objectives of the present study
As mentioned above, the small-size and high stomach empty rate of fish larvae limit
the feeding habit analysis by the methods of both stomach/gut content analysis and
molecular biology analysis. Although the stable isotopes effectively provide the long
term integrated information on diets, there are many unclear issues (e.g. the maternal
effect on the targeted fish species in the field experiment, the relationship with different
breeding type of fishes, too small sample-size) on stable isotope analysis of larval fish.
31
In this study, the primary objectives were to:
(i) build a set of ultra-sensitive stable isotope analysis system for small-size fish larvae (Chapter 2);
(ii) clarify the weight-related SI variations associated with maternal effect, then apply to estimate the feeding habits of six taxa of mesopelagic fishes in the ECS (Chapter 3).
(iii) investigate the factors controlling the spatiotemporal variations in SI ratios of epipelagic Trachurus japonicus larvae and juveniles (Chapter 4);
(iv) consider an appropriate feeding habit analysis for larval fish by using SIA, and
discuss the contribution of this study to the fishery resource management (Chapter
5).
32
33
Tables and Figures of Chapter 1
Table 1.1 Background information of six taxa of mesopelagic fishes.
Family Species Habitat depth
of larval fish †
Occurrence patterns of larval fish ‡
Body length at different period ‡‡ Trophic level of adult fish ¶
Scientific name Common name hatching flexion transformation
Microstomatidae
Lipolagus ochotensisEared blacksmelt 30–100 m Winter N.A. N.A. 15.7–21.5 mm 3.3 ± 0.0
Myctophidae
Diaphus slender typeN.A. 25–80 m Year-round
<3.0 mm4 -4.5 mm 10–11.5 mm 3.1 ± 0.3
§Myctophum asperum
Prickly lanternfish 35–80 m Early summer
<2.3 mm4.5–6.0 mm 10–13 mm 3.7 ± 0.38
Notoscopelus japonicas
Japanese lanternfish 30–75 m Winter N.A. N.A. 3.2 ± 0.1
Gonostomatidae
Sigmops gracilisSlender fangjaw 55–100 m Autumn N.A. N.A. 15–25 mm 3.3 ± 0.4
Phosichthyidae
Vinoiguerria nimbariaOceanic lightfish 0–100 m at night, >200 m at
daytime
Year-round N.A. N.A. >15 mm 3.2 ± 0.1
Notes: † Data of all larval fishes distributed in the Kuroshio Current region of the western North Pacific were cited from Watanabe et al. (2010),
except V. nimbaria larvae distributed off southern Japan cited from (Ozawa et al. 1977).
‡ Seasonal occurrence of fish larvae on the onshore side of the Kuroshio off southern Japan were cited from Sassa and Hirota (2013).
‡‡ Data of Diaphus slender type and M. asperum from (Richards 2006), and those of L. ochotensis, S. gracilis and V. nimbaria were cited from Sassa and Kawaguchi (2006).
¶ Data were cited from FishBase (http://www.fishbase.org/search.php).
§ Trophic level of Diaphus is information of Diaphus fulgens (slender type).
N.A. indicates no data or information.
34
Table 1.2 Half-life time and TEF values in stable isotopes of some larval or juvenile fishes based on rearing experiment.
Fishes Development stage
SL range (mm) Half-life time (days) TEF Notes References
Initial Final δ13C δ15N ∆δ13C ∆δ15N
Japanese temperate
bass
Lateolabraxjaponicus
Juvenile 84.0 ± 10.4
178.0 ± 14.4 (control) and 164.9
± 13.2 (treatment)
Liver = 5.29;
Muscle = 21.00;
Fin = 25.67
Liver = 14.44;
Muscle = 19.25;
Fin=22.36
Liver = +0.34‰;
Muscle = +2.40‰;
Fin = +3.66‰
Liver = +0.59‰;
Fin = +2.21‰;
Muscle = +2.41‰
Water temperature was 18°C (<45 DAH), then gradually increased to 23°C.
Diet switch from an artificial diet (C-type,
<65 DAH, control) to another artificial diet (Hirame-S, 65–100 DAH, treatment).
(Suzuki et al.
2005)
Winter flounder
Pseudopleuronectesamericanus
Juvenile nd nd 4.1 ± 0.6
(13°C) and 2.2 ± 0.3
(18°C)
3.9 ± 0.7 (13°C) and
3.1 ± 0.3 (18°C)
nd nd Diet switch from the rotifers Brachionus
plicatilis (0 day since diet switch) to thebrine shrimp Artemia sp (0–16 days since
diet switch).
(Bosley et al.
2002)
Pacific bluefin tuna
Thunnus orientalisLarval and juvenile
7.38 ± 0.67
ca. 30 (“fish larvae fed
group”)
0.99 (turnover rate = 0.7)
1.16 (turnover rate = 0.6)
nd nd Water temperature was 28.9 ± 0.3°C. Diet switched from rotifers and Artemia nauplii
(0–14 DAH) to only yolk-sac larvae of spangled emperor Lethrinus nebulosus
(15–26 DAH).
(Tanaka et al.
2010)
Atlantic bluefin tuna larvae
Thunnus thynnusPost-flexion stage
5.5 - 6.5
ca. 35 nd 2.5 ± 0.3 nd 0.4 ±
0.3‰
Water temperature was 24°C on average.
Diets: rotifers (0–18 DAH), Artemia salina (16–20 DAH), yolk-sac larvae of gilthead
seabream Sparus aurata (17–32 DAH)
(Uriarte et al.
2016)
Notes: ‘nd’ means no data. TEF, trophic enrichment factor; DAH, day after hatching. For more details, please refer to their respective ‘References’.
35
Fig. 1.1 A framework for life cycle of fish and its related influencing factors.
Firstly, the “breeding strategy” of adult fish, corresponding to “breeder type” (i.e. “income
breeder”. “capital breeder”, “capital-income continuum”), will govern the fish egg
production. Secondly, when fish egg growth, serval factors will affect the survival of fish
larvae and juveniles, including food resources, food competitions, environmental factors,
etc. This led to a lot of hypotheses to explain its’ variability, such as “critical period
hypothesis”, “match-mismatch hypothesis”, and “ocean stability hypothesis”. Thirdly,
overfishing will directly result in the fishes becoming depleted, and will threaten the
sustainable management of fisheries. Finally, all above mentioned may be affected by
environmental factors. More details refer to the main text in Chapter 1. Image sources of
larval and adult fish (an example of Scomber japonicus) are
http://small.fishes.science/larval-scomber-japonicus/ and
https://commons.wikimedia.org/wiki/File:Scomber_japonicus.jpg, respectively.
36
Fig. 1.2 Map of East China Sea, showing (a) virous water masses and currents, and (b) spawning areas of some fishes.
CCC = China Coastal Current; CDW = Changjiang Diluted Water; ECSSSW = East China Sea Shelf Surface Water; KBCNT = Kuroshio Branch Current north of Taiwan; KBCWK
= Kuroshio Branch Current west of Kyushu; KIW = Kuroshio Intermediate Water; KSW =
Kuroshio Surface Water; KTW = subsurface Kuroshio Tropical Water; TSW = Taiwan Strait
Water; TSWC = Tsushima Warm Current; YSCW = Yellow Sea Cold Water; YSCoW =
Yellow Sea Coastal Water; YSWW = Yellow Sea Warm Water.
37
Fig. 1.3 Figure for life history of mesopelagic and epipelagic fishes. Modified from Sassa
(2012)
38
Fig. 1.4 A framework presenting feeding habit analysis of fish larvae/juveniles and its
related influencing factors. The dashed line (---) indicates the potential impact, and the
arrow (→) indicates the direction of the impact.
39
Chapter 2
Improvements for stable isotopes analyses of fish larvae
2.1 Ultra-sensitive EA/IRMS system setting
Generally, 0.3–0.8 mg dorsal muscle is necessary (e.g. Suzuki et al. 2005; Vizza et al.
2013) for the bulk stable carbon and nitrogen isotope analysis of large fish samples (e.g.
juvenile and adult fish) using conventional elemental analyzer/isotope ratio mass spectrometer (EA/IRMS). On the other hand, because of the small size/weight of larval fish, the whole body is suggested to be used rather than muscle tissue (Deniro and Epstein 1978).
However, in my study, the dry-weight of total fish larvae was mostly ca. 0.05 mg. That is the one tenth of the sample weight commonly used in the analyses by EA/IRMS. Although many of previous studies pooled larval fish individuals as one sample for stable isotope analysis (SIA) (e.g. Herzka and Holt 2000; Uriarte et al. 2016), such a bundled sample would mask the variation of SI ratios in each sample (see section 5.2), resulting in missing the relationship between SI ratios and biological and environmental parameters. Therefore, I tried to analyze the stable isotope (SI) ratio in each individual fish sample to clarify the feeding habit of the small larval fish.
A sub-micromolar level measurement of stable nitrogen isotope (δ
15N) of chlorophyll- a (Chl.a) has been successfully conducted by using EA/IRMS with an modified narrower combustion furnace (Houghton et al. 2000). Analytical precision of this method was 0.2‰
for samples containing >150 nmol nitrogen (N
2). Carman and Fry (2002) has developed an
EA-IRMS system with one-reactor setup to a Carlo Erba NA1500 elemental analyzer,
40
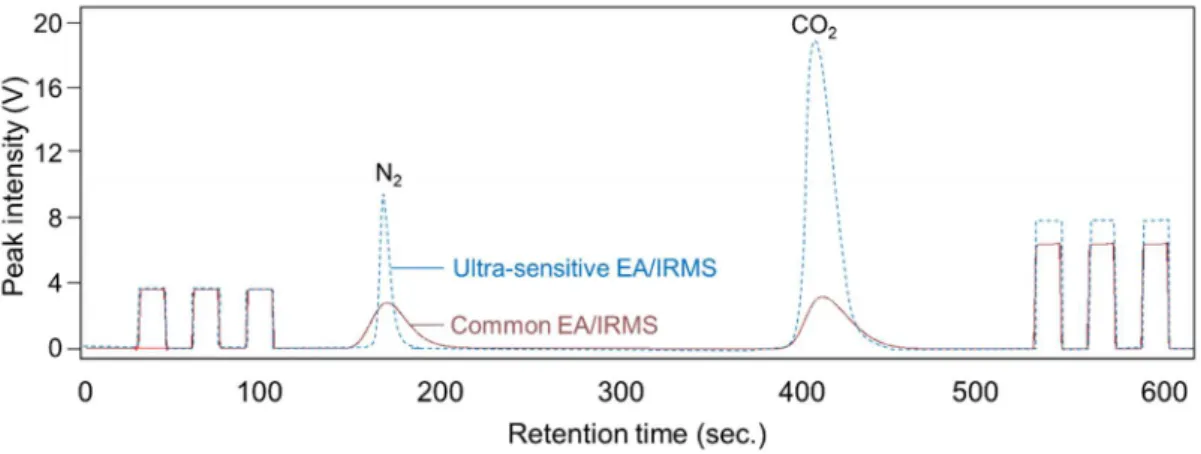
instead of conventional two-reactors setups, and resulted in a possibility of SIA (for the diets of marsh meiofaunal species) at a precision of 0.3‰ for small samples containing more than at least 1 µgN and 2 µgC. In my study, an EA/IRMS (Flash EA, Delta V Advantage, Thermo Fisher Scientific) with narrow-diameter customized both combustion and reduction columns (Fig. 2.1) was set up following the system described in Ogawa et al.
(2010). The intensities were improved for both δ
13C and δ
15N by using ultra-sensitive EA/IRMS rather than common EA/IRMS (Fig. 2.2).
Quality assurance of SI ratios was tested by running one known standard (L-Alanine SS09, SI Science Co., Ltd., Japan) for each five unknown (fish) samples. Based on replicate measurement of this standard, analytical precision was generally better than ± 0.2‰
standard deviation (SD) for both δ
13C in sample sizes > 18 µg-C and δ
15N in sample sizes >
7 µg-N (Fig. 2.3).
Additionally, stable isotope (SI) ratios of
13C/
12C and
15N/
14N were expressed in δ notation defined as follows:
δ
13C, δ
15N (‰) = (R
sample/R
standard− 1) × 1000
where the term R denotes the ratios of
13C/
12C or
15N/
14N, and Vienna Pee Dee Belemnite (VPDB) and atmospheric nitrogen were used as standards for carbon and nitrogen isotopes, respectively.
2.2 Minimizing contamination
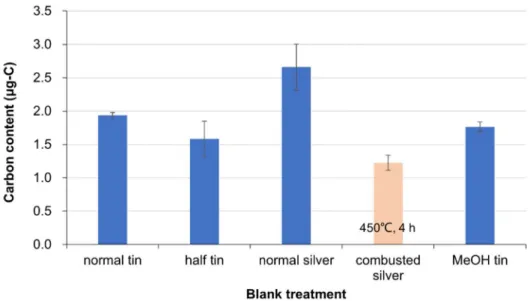
The smallest sample of larval fish analyzed in this study was ca. 0.05 mg body weight
(ca. 3–6 mm body length for each fish species). The mean carbon contents of total dry
41
weight of fish larvae were ca. 43% for all fish species, which was consistent with those of Engraulis japonica larvae (Uye 1982). Thereby, the carbon contents of smallest samples were ca. 20 μgC. In the SIA, the powder sample of fish or fish individual was wrapped with a blank tin or silver capsule. However, the capsules are often suffered from carbon contamination from machine oil etc. during the production process. To minimize the potential carbon contaminations, the blank capsules with a various type of treatment were tentatively analyzed prior to the process of fish samples. As the results of the analyses of 5 blank capsules for each treatment, the carbon contents (mean ± SD) were as follows: 1.94
± 0.04, 1.59 ± 0.26, 2.66 ± 0.35, 1.23 ± 0.11, 1.76 ± 0.07 μg for normal tin, half-size tin, normal silver, combusted silver (450°C, 4 h) and MeOH preserved tin (2 h) capsules, respectively (Fig. 2.4). It means that the contamination of carbon from the blank capsule into the smallest samples accounted for as much as 8.0% or 9.7%, except for combusted silver capsule showing 6.2% contamination. In this study, therefore, the combusted silver capsule was used for SIA of fish samples.
2.3 Correction of the effect of the preservation methods on SI ratios
The fish samples used as the basis for discussion of spawning strategy (see Chapter 3) required correction to account for the effect of organic solvents on tissue stable isotopes (SI), because the cited particulate organic matter (POM) isotope ratios used in Figure 3.
were not based on samples preserved in organic solvent. Syväranta et al. (2011) reported
that SI in Asiatic clam samples preserved in 70%-ethanol after some days fixation in 4%-
formalin (hereafter Et and Fo, respectively) significantly increased compared to those of
42
natural samples (δ
natural) which were analyzed immediately after collection (i.e. ∆δ
13C = δ
13C
Fo, Et– δ
13C
natural= 1.6 ± 0.3‰, ∆δ
15N = δ
15N
Fo, Et– δ
15N
natural= 1.0 ± 0.3‰). Vizza et al. (2013) also reported that SI in the caudal fin of some species of salmon and trout significantly increased when the samples were preserved in 70% Et compared to frozen samples (i.e. ∆δ
13C = δ
13C
Et– δ
13C
frozen= 1.3–1.4‰, ∆δ
15N = δ
15N
Et– δ
15N
frozen= 0.2–0.4‰).
Because the effect of organic solvents on SI ratios are variable depending on the sample species and lipid contents (refer to citations in the above two papers), it was difficult to accurately correct the effect of organic solvent on SI in our fish samples.
In my study, therefore, the SI determined without any correction were used for exploring the relationships between stable isotopes ratios and environmental and biotic parameters (i.e. δ
13C and δ
15N in Results and Discussions sections in Chapter 3 and Chapter 4 indicate δ
13C
Fo, Etand δ
15N
Fo, Et, respectively). On the other hand, a correction for the effect of organic solvent on SI was applied following the equations below, which are based on the reported average SI ratios (i.e. ∆δ see above; Syväranta et al. 2011; Vizza et al. 2013), only when the corrected δ
13C and δ
15N (δ
corrected) of mesopelagic fish species were compared with natural POM isotopes from other studies in Kuroshio area (Cheung et al. 2017; H.
Saito unpublished data), as shown in Supplementary Figure S3.2.
δ
13C
corrected= δ
13C
Fo, Et– 1.5‰, δ
15N
corrected= δ
15N
Fo, Et– 0.5‰.
The effect of organic solvents on the SI ratios among developmental stages (i.e. different
sizes) could not be assessed. We considered that the effect is likely to be similar across
developmental stages because adults of mesopelagic species were not large relative to
larvae (less than 10 cm). On the other hand, the effects of formalin and formalin-ethanol
43
preservation on δ
13C and δ
15N were similar for the same species (Syväranta et al. 2011).
Therefore, the same correction was applied to both formalin preserved (adult fish) and
formalin-ethanol preserved (larval fish) samples.
44
45
Tables and Figures in Chapter 2
Fig. 2.1 Dimensions and composition of the original EA oxidation and reduction columns
(Left) and the modified columns (Right) for common EA/IRMS and ultra-sensitive
EA/IRMS, respectively.
46
Fig. 2.2 Comparison of (a) common EC/IRMS and (b) ultra-sensitive EA/IRMS for 0.32
mg L-alanine.
47
Fig. 2.3 Calibration lines for isotope ratio, content, and peak area for carbon and nitrogen
used L-alanine as standard in this study.
48
Fig. 2.4 Blank contamination of carbon content to stable isotope analysis.
49