Potent influence of obesity on suppression of plasma B-type natriuretic peptide levels in patients with acute heart failure: An approach using covariance structure analysis
Koji Kinoshita, Makoto Kawai⁎, Kosuke Minai, Kazuo Ogawa, Yasunori Inoue, Michihiro Yoshimura
Division of Cardiology, Department of Internal Medicine, The Jikei University School of Medicine, Japan
a b s t r a c t a r t i c l e i n f o
Article history:
Received 13 March 2016 Accepted 11 April 2016 Available online 16 April 2016
Background:Plasma B-type natriuretic peptide (BNP) levels may vary widely among patients with similar stages of heart failure, in whom obesity might be the only factor reducing plasma BNP levels. We investigated the effect of obesity and body mass index (BMI) on plasma BNP levels using serial measurements before and after treatment (pre- and post-BNP and pre- and post-BMI) in patients with acute heart failure.
Methods:Multiple regression analysis and covariance structure analysis were performed to study the interactions between clinical factors in 372 patients. The pre-BMI was shown as a combination index of obesity andfluid accumulation, whereas the post-BMI was a conventional index of obesity.
Results:There was a significant inverse correlation between BMI and BNP in each condition before and after treatment for heart failure. The direct significant associations of the log pre-BNP with the log post-BNP (β:
0.387), the post-BMI (β:−0.043), and the pre-BMI (β: 0.030) were analyzed by using structural equation modeling. The post-BMI was inversely correlated, but importantly, the pre-BMI was positively correlated, with the log pre-BNP, because the pre-BMI probably entailed an element offluid accumulation. There were few patients with extremely high levels of pre-BNP among those with high post-BMI, due to suppressed secretion of BNP.
Conclusions:The low plasma BNP levels in true obesity patients with acute heart failure are of concern, because plasma BNP cannot increase in such patients.
© 2016 The Authors. Published by Elsevier Ireland Ltd. This is an open access article under the CC BY-NC-ND li- cense (http://creativecommons.org/licenses/by-nc-nd/4.0/).
Keywords:
Biochemical marker B-type natriuretic peptide Body mass index Obesity
Covariance structure analysis Fluid accumulation
1. Introduction
B-type or brain natriuretic peptide (BNP) is one of the natriuretic peptides and is widely used for diagnosis and predicting prognosis in heart failure[1–5]. Although the plasma BNP level is thought to be a good biochemical marker of heart failure, the levels may vary widely among patients in whom the severity of heart failure is clinically in the same range[6]. The wide range of plasma BNP levels may be explained by a number of factors contributing to the secretion of BNP, which differ among individuals and vary according to conditions.
Among the factors contributing to plasma BNP levels, ventricular hemodynamic overload significantly stimulates the secretion of BNP;
combined ventricular dysfunction and associated bodyfluid overload are the major stimulating factors[2,3]. Volume overload induced by renal dysfunction is another major contributor to increased plasma BNP levels. Aging and male sex also influence plasma BNP levels[7].
Neurohumoral factors, the renin–angiotensin–aldosterone (RAA) sys- tem, endothelin-1, oxidative stress, inflammatory cytokines, and others can increase plasma BNP levels[8–10]. The conditions associated with these factorsfinely modulate plasma BNP levels according to the individ- ual. In circumstances such as these, it is interesting to note that the above factors are almost all positive regulators of plasma BNP levels; the nega- tive regulatory factors are rare. Fat accumulation/obesity may be the only applicable factor decreasing plasma BNP levels. However, the true impact of obesity on plasma BNP levels has not yet been clarified. It is un- certain whether obesity per se has a major impact on plasma BNP levels.
It is possible that the main cause of the wide range of plasma BNP levels in clinically similar stages of heart failure may be the result of habitus, with obesity or slenderness contributing to the development of heart failure. Plasma BNP levels are likely to increase in slenderness but not in obesity among patients with heart failure. To precisely determine the effect of obesity on plasma BNP levels, it is necessary to identify a suit- able marker of fat accumulation/obesity during heart failure.
Body mass index (BMI) is the simplest and best marker of fat accumulation or obesity in general; however, the BMI of a patient with heart failure represents not only fat accumulation/obesity but also bodyfluid excess due to heart failure, because BMI is calculated as International Journal of Cardiology 215 (2016) 283–290
⁎ Corresponding author at: Division of Cardiology, Department of Internal Medicine, The Jikei University School of Medicine, 3-25-8 Nishi-shimbashi, Minato-ku, Tokyo 105- 8461, Japan.
E-mail address:[email protected](M. Kawai).
http://dx.doi.org/10.1016/j.ijcard.2016.04.111
0167-5273/© 2016 The Authors. Published by Elsevier Ireland Ltd. This is an open access article under the CC BY-NC-ND license (http://creativecommons.org/licenses/by-nc-nd/4.0/).
Contents lists available atScienceDirect
International Journal of Cardiology
j o u r n a l h o m e p a g e :w w w . e l s e v i e r . c o m / l o c a t e / i j c a r d
学 日付 : 2018.12.14 15:04:29 +09'00'
body weight (kg) divided by the square of the height (cm). Fluid accu- mulation due to cardiac dysfunction would further augment cardiac overload and thereafter tends to increase plasma BNP levels, whereas obesity itself decreases plasma BNP levels. Therefore, the BMI before treatment (pre-BMI) was used as a combined index of obesity and fluid accumulation for descriptive purposes in this study, whereas the BMI after treatment (post-BMI) was an index of obesity, as convention- ally applied. To the best of our knowledge, no study has focused on the true effect of obesity on plasma BNP levels during the“wet”period by using the BMI during the“dry”period.
Another impediment to this type of analysis is statistical computing intractableness. Theoretically, the secretion of BNP is influenced by many factors at all times. It is thus quite logical to simultaneously in- clude every possible factor includingfluid accumulation into the same analysis. It might thus be preferable in this study to use BMI before treatment as a component of the same equation, because it partially representsfluid accumulation. However, the BMI before treatment would surely be confounded with the BMI after treatment, and therefore, multiple regression analysis cannot be applied simultaneous- ly. Furthermore, many other clinical factors related to each other would simultaneously influence plasma BNP levels. Simultaneous comparison of the influence of possible factors affecting plasma BNP levels requires highly technical computing; covariance structure analysis or data- mining technology would be required for this complex statistical analysis.
We investigated the impact of obesity on plasma BNP levels by using a path analysis based on covariance structure analysis in patients admitted to our institution with acute heart failure. Among hemodynamic parameters and blood samples measured serially during treatment, we used two data points: before and after the treatment of acute heart failure.
2. Methods 2.1. Study patients
The study population consisted of 372 consecutive patients hospital- ized due to acute heart failure between 2012 and 2014 at Jikei Universi- ty Hospital. The sampling data included BMI and plasma BNP levels on admission before treatment, and after intensive treatment for acute heart failure. We excluded patients with acute myocardial infarction (AMI), because plasma BNP levels noticeably and rapidly increase dur- ing the 24 h after onset of AMI in a monophasic manner, then transiently decrease, possibly followed by another increase two to three days after onset (depending on the degree of ventricular remodeling), thus resulting in a biphasic profile[11]. Patients who required emergency surgery, including coronary artery bypass and noncardiac surgery, dur- ing the period between the collection of thefirst and second plasma BNP samples were also excluded. The study protocol (27–243 [8128]) was approved by the Ethics Committee of The Jikei University School of Medicine, and we complied with the routine ethical regulations of our institution. This is a retrospective study and informed consent could not be obtained from each patient. Instead of obtaining informed con- sent from each patient, we posted a notice about the study design and contact information at a public location in our institution.
2.2. Diagnosis of acute heart failure
Acute heart failure was diagnosed according to the guidelines for the treatment of acute heart failure published by the Japanese Circulation Society. Patients with heart failure symptoms (New York Heart Association [NYHA] functional class II to IV) underwent several exami- nations (blood gas analysis, blood sampling, electrocardiogram, plain chest radiography, and echocardiogram), and agreed to be admitted to our hospital.
2.3. Treatment of acute heart failure
The patients were treated with drugs, such as diuretics, angiotensin- converting enzyme inhibitors, angiotensin II receptor blockers, aldoste- rone antagonists, beta blockers, nitrates, carperitide (human atrial natri- uretic peptide), and, if necessary, catecholamines and mechanical support such as respirators, intra-aortic balloon pumping, or percutane- ous cardiopulmonary support.
2.4. Blood sampling and measurement of plasma BNP and other levels
We collected data for plasma BNP and other levels. Thefirst sample was obtained immediately after admission and before intensive treatment (pre-BNP). In each case, the second sample was collected when the clinical symptoms of acute heart failure improved and the patient's condition stabilized. Whole blood (5 mL) was collected in tubes containing potassium ethylenediaminetetraacetic acid (EDTA) (1 mg/mL blood). Plasma BNP was measured with a rapid enzyme- linked immunosorbent assay (nonextracted) using an antibody to human BNP (Shionogi Co. Ltd., Tokyo, Japan). Serum biochemical analy- ses including creatinine (Cr) were performed in a central laboratory in our hospital during the study.
2.5. Echocardiographic examination and other measurements
An echocardiographic examination was performed in all patients by three expert cardiologists, and left ventricular ejection fraction (LVEF) was used as a marker of systolic dysfunction. BMI was calculated on the basis of height and weight on admission and after therapy.
2.6. Statistical analysis
Continuous variables were expressed as the means ± standard devi- ation (SD) or medians. The correlation between two factors was expressed as Spearman's correlation coefficient and single regression analysis. Multiple regression analysis was performed when multiple values were compared. In the multivariate analysis, natural logarithmic conversion (log) was performed on the BNP values, because they were not normally distributed. A chi-squared analysis was applied for a test for comparison between two groups, if it is necessary. Statistical analy- ses were performed using SPSS Statistics version 23.0 (SPSS Inc., Chica- go, IL, USA), and differences were considered to be statistically significant for P-valuesb0.05.
Path analysis was used to investigate the relation between clinical factors in this study population and especially to survey probable causal effects on the plasma BNP levels before the treat- ment. Path analysis was performed with IBM SPSS AMOS version 23 (Amos Development Corporation, Meadville, PA, USA)[12]. The obtained structural equation models were tested and confirmed at the significance level for P-valuesb0.05. The causality model defines some hierarchical regression models between clinical factors and the plasma BNP levels. Paths between variables are drawn from independent to dependent variables with directional arrow for every regression model (arrowhead on one end only). A two-way arrow between two variables indicates the correlation between these two variables. For every regression, the total variance in dependent variable is theorized to be caused either by independent variables of the model or by extraneous variables (e). Each path has a coefficient showing the standardized coefficient of regressing independent variable on dependent variable of the relevant path. The indirect effect was determined by multiplying the path coefficients of intervening variables.
3. Results
3.1. Study population
The baseline characteristics of the study population are shown in Table 1. No patients died during therapy and the clinical symptoms of acute heart failure were successively improved by intensive treatment, although the remediation levels varied among the patients. This study included 51 patients (13.7%) in NYHA functional class II, 196 patients (52.7%) in class III and 125 patients (33.6%) in class IV among 372 pa- tients in total. The period between the two points of sampling was 19.1 ± 12.3 days (3 days minimally and 91 maximally).
3.2. Single regression analysis for the determination of the impact of BMI on the plasma BNP levels in each phase, before and after the treatment
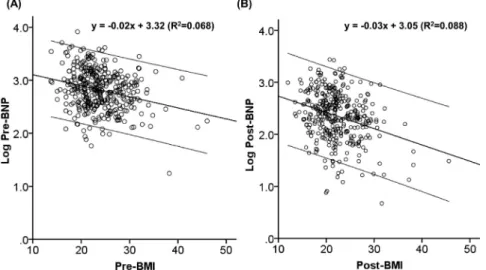
By the single regression analysis, there was a significant correlation between the pre-BMI and the log pre-BNP and between the post-BMI and the log post-BNP as shown inFig. 1A and B (Pb0.001, respectively).
This suggests that the BMI seemingly affected the plasma BNP levels before and after the treatment.
3.3. Multiple regression analysis for a determination of the impact of BMI on the plasma BNP levels in each phase, before and after the treatment
To examine the effect of the BMI on the plasma BNP levels, the multivariable regression analysis was performed; and the analysis identified the pre-BMI as an independent negative correlate of the log pre-BNP (Table 2A). Other independent correlates included female gender, age, the serum creatinine levels and the LVEF, and these factors were significantly associated with the log pre-BNP as independent positive correlated factors. Also, another multivariate analysis identified that the post-BMI as an independent negative correlate of the log post-BNP (Table 2B). Other independent correlates included female gender, age, the serum Cr levels and the LVEF, and these factors were significantly associated with the log post-BNP as independent positive correlated factors. These multivariate analyses would also confirm the previousfindings that obesity was inversely associated with the plasma BNP levels.
Nonetheless, the impact of true obesity on the plasma BNP levels in the acute phase of heart failure would be still unclear using multiple
regression analysis alone because the plasma BNP levels in the acute phase of heart failure are influenced by obesity andfluid accumulation in a complex manner, as shown inFig. 2. Multiple regression analysis would have a limitation in comparing the true relationship between obesity and plasma BNP levels before treatment; it was unfortunate that multivariate analysis by simultaneous inclusion of both pre-BMI and post-BMI in one equation is inappropriate because pre-BMI and post-BMI were the confounding variables (Pb0.001), as shown in Table 3.
3.4. Analysis of an association between obesity and plasma BNP levels in the acute phase of heart failure by covariance structure analysis
In order to examine the true impact of obesity on plasma BNP levels in the acute phase of heart failure, we conducted path analysis based on covariant structure analysis. To clarify the factors truly influencing the log pre-BNP, the theoretical pass model wasfirst proposed, as shown inFig. 3A; this model was constructed based on theoretical concerns and by reference to Pearson's correlation coefficient as shown in Table 3. Log pre-BNP lay centrally in the path model. Log pre-BNP must be affected by log post-BNP, and pre-BMI must also be affected by post-BMI. Log pre-BNP would be affected by not only pre-BMI but also post-BMI, which was the main focus of this study. Other parameters including age, gender, pre-Cr, post-Cr and LVEF were proposed as potential factors affecting log pre-BNP. Pre-Cr would be associated with post-Cr. After thefirst analysis (Table 4A), we found that the contribution of age and gender on log pre-BNP was relatively small;
we then simplified the path model. The results of thefinally proposed path analysis (standard regression coefficients, squared multiple correlations, and correlations among exogenous variables between each clinical factor) are summarized inFig. 4B andTable 4B. Thefinal structure equation modeling showed a goodfit as follows: chi-square minimum discrepancy/degree of freedom ratio (CMIN/DF) = 1.364 (≤2.000 is for a goodfit model, P = 0.182), goodness offit index (GFI) = 0.989 (≥0.900 is for a goodfit model), adjusted goodness of fit index (AGFI) = 0.972 (≥0.900 is for a goodfit model), comparative fit index (CFI) = 0.998 (≥0.900 is for a goodfit model), parsimonious comparative fit index (PCFI) = 0.523, non-centrality parameter (NCP) = 4.006 (90% confidence interval [CI], 0 to 18.338), minimum value of the discrepancy function F (FMIN) = 0.040 (90% CI, 0 to 0.049), root mean square error of approximation (RMSEA) = 0.031 (≤0.050 is for a goodfit model, 90% CI, 0 to 0.067), Akaike's information criterion (AIC) = 49.006, and expected cross-validation index (ECVI) = 0.132 (90% CI, 0.121 to 0.171). There was a direct significant association of log pre-BNP with log post-BNP (unstandardized regression coefficients,β: 0.387, Pb0.001), pre-Cr (β: 0.067, Pb0.001), LVEF (β:
−0.005, Pb0.001), post-BMI (β:−0.043, Pb0.001), and pre-BMI (β: 0.030, P = 0.007). It is important that the post-BMI was inversely correlated with the log pre-BNP, whereas the pre-BMI was positively correlated with the log pre-BNP. This is probably because the pre-BMI entailed an element offluid accumulation, which would increase the pre-BNP. This suggests that obesity itself substantially suppressed an increase in the plasma BNP levels in acute heart failure. It is also inter- esting to see that the absolute influence of obesity on the plasma BNP levels matched that of LVEF, a probable major component of an increase in the plasma BNP levels.
3.5. The distribution patterns of obese and nonobese patients according to the degree of plasma BNP levels in the acute phase of heart failure
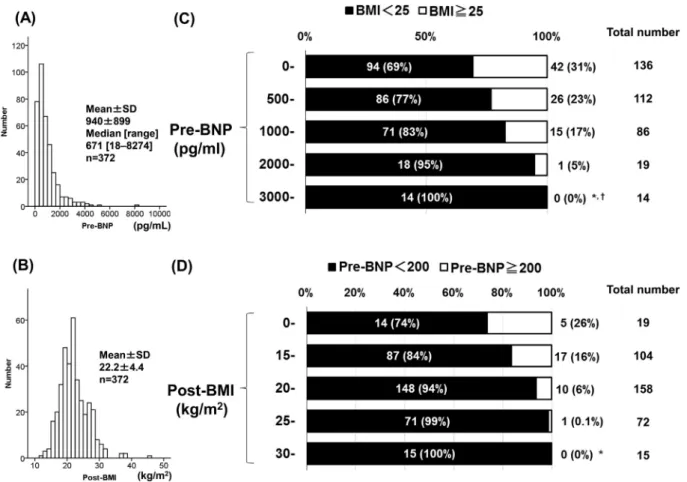
The result of pass analysis indicated that the post-BMI, reflecting obesity, would be important for determination of the log pre-BNP. We then examined the number of obese patients according to the plasma BNP level in the acute phase. UsingFig. 4A showing the histogram for pre-BNP, the distribution patterns of the study population were examined by dividing patients into obese (post-BMI ≧ 25) and Table 1
The characteristics of all patients.
Characteristics (n = 372) Overall; mean ± SD (median) [interquartile range]
Gender: male/female 267/105
Age (years old) 68.4 ± 15.2
BMI (kg/m2) 23.8 ± 4.7 (23.1) [13.7–46.0]
Creatinine (mg/dL) 1.34 ± 1.02
CRP (mg/dL) 1.01 ± 1.52
BNP (pg/mL) 939.8 ± 899.3 (671.1) [17.6–8274.1]
Log BNP 2.82 ± 0.37 (2.83) [1.25–3.92]
NYHA class [I/II/III/IV] (%) 3.2 ± 0.7 [0/51/196/125] (0%/13.7%/52.7%/33.6%)
LVEF (%) 40.6 ± 15.8
Underlying cardiovascular disease number (% of overall) Ischemic heart disease 42 (11.9%)
Congestive heart failure 231 (62.5%)
Arrhythmia 26 (7.0%)
Cardiomyopathy 47 (11.1%)
Valvular disease 26 (7.5%)
Hypertension 230 (61.8%)
Type 2 diabetes mellitus 125 (33.7%)
Dyslipidemia 196 (52.8%)
Renal dysfunctiona 254 (68.3%)
BMI, body mass index; BNP, B-type natriuretic peptide; eGFR, estimated glomerularfiltra- tion rate; CRP, C-reactive protein; NYHA class, New York Heart Association functional clas- sification; LVEF, left ventricular ejection fraction.
aRenal dysfunction means eGFR ofb60 mL/min/1.73 m2.
nonobese (post-BMIb25) groups, as shown inFig. 4C. Obesity was pres- ent in 31% of patients with a level less than 500 pg/mL, 23% with a level 500 pg/mL, 17% with a level 1000 pg/mL, 5% with a level 2000 pg/mL, and 0% with a level 3000 pg/mL and over. This result suggests that there were few very obese patients among the group with high plasma BNP levels in the acute phase of heart failure. The absolute influence of obesity on plasma BNP levels might surpass that of cardiac dysfunction, renal dysfunction, and other factors among patients with severe obesity.
3.6. The distribution patterns of patients with low and high plasma BNP levels in the acute phase of heart failure according to the degree of obesity
Fig. 4B shows the histogram for post-BMI. We examined the number of patients with low and high plasma BNP levels (pre-BNP) in the acute phase of heart failure according to the degree of obesity (post-BMI). The distribution patterns of the study population were examined by divid- ing patients into groups who had extremely high pre-BNP (pre-BNP
≥200 pg/mL) and others (pre-BNPb200 pg/mL), as shown inFig. 4D.
BMI less than 15 kg/m2was present in 26% of patients with extremely high pre-BNP, 16% in the group with BMI 15 kg/m2, 6% in the group with BMI 20 kg/m2, 0.1% in the group with BMI 25 kg/m2, and 0% in the group with BMI 30 kg/m2and over. This result also suggested that there were few obese patients with high plasma BNP levels in the acute phase of heart failure.
4. Discussion
In order to use plasma BNP levels to evaluate heart failure more ef- fectively and accurately in routine emergency medical care, it is neces- sary to examine the factors influencing the levels. Thus, it would be important to examine the extent to which obesity negatively influences plasma BNP levels in acute heart failure. If the impact of obesity on plas- ma BNP levels is high, the attending physician should monitor patients with increased BMI very carefully, to avoid underestimating the degree of heart failure when using BNP.
The tendency toward an inverse relationship between obesity and low plasma BNP levels was reported by Wang et al.[13]and others[6, 7,14]. We also investigated the degree of influence of obesity on plasma BNP levels, and examined the relationship between the BNP level and BMI in patients who were admitted to our cardiovascular unit[15].
The BMI was a significant factor reducing plasma BNP levels, and its im- pact significantly increased in relation to the BMI value. However, BMI in that study was measured at only one point in patients admitted to our institution with and without acute heart failure. Therefore, the true impact of obesity on plasma BNP levels might have remained un- clear because the component offluid accumulation was not taken into account in that study. Furthermore, the influence of other factors on the plasma BNP level may not have been adequately examined. Thus, a high level of statistical analysis is warranted to discuss the importance of obesity on plasma BNP levels.
Fig. 1.Single regression analysis. (A) Single regression analysis for pre-BMI and log pre-BNP before treatment. (B) Single regression analysis for post-BMI and log post-BNP before treatment. These panels show the single regression lines (oblique center lines) and the 95th percentile lines (oblique parallel lines) in scatter plots. These equations indicate the single regression formulas. Pre-BMI means BMI before treatment. Log pre-BNP means the natural logarithmically-converted pre-BNP before treatment. Post-BMI means BMI after treatment.
Log post-BNP means the natural logarithmically-converted BNP after treatment. R2: squared Pearson's correlation coefficient; BMI: body mass index; BNP: B-type natriuretic peptide.
Table 2
The results of multiple regression analysis to identify the clinical factors influencing the logarithmic pre-BNP and post-BNP levels (in upper and lower tables, respectively).
A. Model for log pre-BNP (R2= 0.230) Regression coefficient Standard regression coefficient P-value 95% CI VIF
Age 0.002 0.085 0.118 −0.001 to 0.005 1.402
Gender −0.057 −0.069 0.147 −0.135 to 0.020 1.090
Pre-BMI −0.016 −0.199 b0.001 −0.024 to−0.008 1.210
Pre-creatinine 0.107 0.291 b0.001 0.073 to 0.140 1.041
LVEF −0.007 −0.314 b0.001 −0.010 to−0.005 1.201
Constant 3.256 – b0.001 2.955 to 3.556 –
B. Model for log post-BNP (R2= 0.186)
Age 0.008 0.257 b0.001 0.005 to 0.011 1.393
Gender 0.038 0.036 0.457 −0.062 to 0.137 1.090
Post-BMI −0.022 −0.203 b0.001 −0.032 to−0.011 1.193
Post-creatinine 0.080 0.198 b0.001 0.042 to 0.118 1.032
LVEF −0.005 −0.183 b0.001 −0.008 to−0.002 1.200
Constant 2.374 – b0.001 1.998 to 2.750 –
R2, adjusted coefficient of determination; BMI, body mass index; BNP, B-type natriuretic peptide; Pre-, before treatment; Post-, after treatment; LVEF, left ventricular ejection fraction; CI, confidence interval; VIF, variance inflation factor.
As shown in Table 2A and B, there was a significant inverse correlation between the BMI and plasma BNP levels both before and after treatment for acute heart failure, by single and multiple regression analysis (also seeTable 3). This result suggests that BMI suppresses plasma BNP levels regardless of the patient's condition before and after treatment. This would support previousfindings; however, the im- pact of obesity on plasma BNP levels in the acute phase of heart failure remained unclarified because the pre-BNP, post-BNP, pre-BMI, post- BMI, and other parameters were statistically related in a complex man- ner, as shown inFig. 2. It would be theoretically difficult to compare the relationship using multiple regression analysis alone.
In order to examine the true influence of obesity on plasma BNP in the acute phase of heart failure, we proposed covariance structure analysis. In this study, wefirst proposed a path model as shown in Fig. 3A. We then adjusted the model for betterfit. Finally, we showed the successfulfinal model as shown inFig. 3B. Interestingly, there was a significant positive correlation between the pre-BMI and the log pre- BNP, probably because the pre-BMI entailed an element offluid accu- mulation, whereas there was a significant inverse correlation between the post-BMI and the log pre-BNP. This indicated for thefirst time the true effect of obesity on plasma BNP levels in acute heart failure; obesity substantially interfered with the positive influence on the increase in plasma BNP levels caused by cardiac dysfunction, bodyfluid excess, renal dysfunction, and other factors. The absolute influence would compete with other major components.
The current information obtained from path analysis can be useful in routine clinical settings. For example, if a symptomatic patient has an in- creased BMI but the concurrent plasma BNP level is relatively low, the phy- sician might not consider heart failure in the diagnosis. This is of concern because the plasma BNP cannot increase, even in heart failure, if the patient has true obesity. On the other hand, if the plasma BNP levels are high in a patient with increased BMI, the patient may not be obese, but may simply havefluid accumulation. Diuretics may be able to reduce the excess body weight and simultaneously decrease the plasma BNP level.
In the current study, statistical analysis revealed an inverse correlation between plasma BNP levels and BMI. It is important to discuss the pathophysiological function of adipocytes and their relation- ship to a decrease in plasma BNP levels. First, it is probable that natriuretic peptide reduces BMI by improving the function of adipocytes. Second, it is likely that unknown factors secreted by adipocytes attenuate the production of BNP in the heart and/or augment BNP clearance in the body. Although it is unclear which mechanism is predominant, it is conceivable that these pathways are mutually related as follows.
It can be assumed that a high BNP level plays a causative role in lowering BMI. In this regard, there is an important report using BNP transgenic mice that showed that NP/cGK cascades promote muscle mitochondrial biogenesis and fat oxidation via the upregulation of PGC-1αand peroxisome proliferator-activated receptor (PPAR) γ, thus preventing obesity and glucose intolerance[16]. It is thus possible to suppose that an increase in BNP secretion accelerates lipolysis in adipocytes, resulting in a low BMI. On the other hand, it is conceivable that a high degree of obesity plays a causative role in lowering the plasma BNP level. It has been reported that the heart utilizes fatty acids mainly as an energy source in patients with obesity, with the concomitant suppression of glucose utilization via the activation of PPARα[17,18]. It is also interesting that PPARαsuppresses BNP produc- tion[19]. Therefore, it is conceivable that increased plasma free fatty acid availability suppresses BNP production. In addition, it has been demonstrated that hypoxia-inducible factor (HIF) 1αplays a crucial role in BNP production[20,21]. Insulin induces HIF-1α[22,23]and it is therefore conceivable that BNP production is reduced under conditions of insulin resistance via HIF-1α suppression in obese patients, as discussed previously[24,25].
At present, it is unclear whether the substantial link between fat accumulation/obesity and low BNP levels is favorable or unfavorable in heart failure, but this should be investigated in the future for a possible therapy based on this phenomenon. However, a recent study Fig. 2.Explanatory drawing of possible link between BMI and plasma BNP levels before and after treatment. Multiple regression analysis showed a significant correlation between BMI and plasma BNP levels before and after treatment; however, the link between post-BMI and pre-BNP was unclear in multiple regression analysis. Pre-BMI means BMI before treatment. Pre- BNP means BNP levels before treatment. Post-BMI means BMI after treatment. Post-BNP means BNP levels after treatment. BMI: body mass index; BNP: B-type natriuretic peptide.
Table 3
The results of Pearson product–moment correlation coefficient analysis to identify the clinical factors influencing the logarithmic pre-BNP and post-BNP levels.
R (n = 372) Age Pre-BMI Log pre-BNP Pre-Cr Post-BMI Log post-BNP Post-Cr LVEF
Pre-BMI −0.383† – −0.260† −0.110* 0.961† −0.289† −0.065 −0.047
Log pre-BNP 0.092 −0.260† – 0.325† −0.297† 0.592† 0.292† −0.268†
Post-BMI −0.369† 0.961† −0.297† −0.095 – −0.296† −0.055 −0.039
Log post-BNP 0.283† −0.289† 0.592† 0.270† −0.296† – 0.244† −0.084
R, Pearson's correlation coefficient; BMI, body mass index; BNP, B-type natriuretic peptide; Cr, creatinine; Pre-, before treatment; Post-, after treatment; LVEF, left ventricular ejection frac- tion; P value: *, Pb0.05;†, Pb0.001; no mark, not significant.
reported that an increase in production of endogenous natriuretic pep- tide is beneficial for energy efficiency in obese patients; drugs that inhibited the degradation of natriuretic peptide were beneficial for heart failure[26]. In addition, we recently reported that plasma BNP
levels were inversely associated with insulin resistance in patients with chronic heart failure[25].We also reported that low plasma levels of BNP were significantly associated with ischemic heart disease[27].
These newfindings would indicate that an increase in the production Fig. 3.Pass models. (A) Pass model theoretically proposed. (B) Pass model modified for bestfit. Each path has a coefficient showing the standardized coefficient of a regressing independent variable on a dependent variable of the relevant path. These variables mean standardized regression coefficients (direct effect) [underlined parts mean remarkable values], squared multiple correlations [in narrow italics] and correlations among exogenous variables [inside round brackets]. BMI: body mass index; BNP: B-type natriuretic peptide; LVEF; left ventricular ejection fraction; Cr: creatinine kinase; e: extraneous variable.
Table 4
The results of standardized regression coefficient analysis to identify the clinical factors influencing the logarithmic pre-BNP and post-BNP levels in each pass model.
BNP Clinical factor Direct effect Indirect effect Total effect
(A) Pass model theoretically proposed
Log pre-BNP ← Log post-BNP 0.492 0 0.492
← Pre-BMI 0.360 0 0.360
← Post-BMI −0.492 0.245 −0.247
← Age −0.047 0.128 0.081
← Gender −0.076 0.018 −0.058
← LVEF −0.222 −0.091 −0.313
← Pre-Cr 0.193 0 0.193
← Post-Cr 0 0.098 0.098
Log post-BNP ← Post-BMI −0.205 0 −0.205
← Age 0.259 0 0.259
← Gender 0.037 0 0.037
← LVEF −0.184 0 −0.184
← Post-Cr 0.199 0 0.199
Pre-BMI ← Post-BMI 0.961 0 0.961
The results (direct, indirect, and total effects) of the pass model theoretically proposed (A) and the pass model modified for the bestfit (B) analysis to identify the clinical factors influencing both the logarithmic post-BNP and pre-BNP levels (seeFig. 3).
(B) Pass model modified for the bestfit (removed“age and gender”)
Log pre-BNP ← Log post-BNP 0.484 0 0.484
← Pre-BMI 0.374 0 0.374
← Post-BMI −0.506 0.220 −0.286
← LVEF −0.226 −0.047 −0.274
← Pre-Cr 0.183 0 0.183
← Post-Cr 0 0.111 0.111
Log post-BNP ← Post-BMI −0.288 0 −0.288
← LVEF −0.098 0 −0.098
← Post-Cr 0.230 0 0.230
Pre-BMI ← Post-BMI 0.961 0 0.961
The standardized total (direct and indirect) effect of each variable on both pre-BNP and post-BNP levels after standardizing all variables.
BMI, body mass index; BNP, B-type natriuretic peptide; Cr, creatinine; Pre-, before treatment; Post-, after treatment; LVEF, left ventricular ejection fraction.
of BNP is beneficial for energy metabolism and suppression of ischemic heart disease, although more detailed study is necessary.
5. Conclusion
The current path analysis logically showed that obesity itself strong- ly suppressed plasma BNP levels in acute heart failure. If the plasma BNP levels are high in a patient with increased BMI, the patient may not have true obesity but simply havefluid accumulation. On the other hand, a patient with an increased BMI but a low plasma BNP level is of concern, because the plasma BNP cannot increase, even in heart failure, if the pa- tient has true obesity. Knowledge of the pathophysiological mecha- nisms of the strong link between obesity and low natriuretic peptide levels, which remain unclear, would be of value for future research on energy metabolism in heart failure.
6. Study limitations
There were some study limitations. First, we examined serial plasma BNP levels in 372 patients during treatment for acute heart failure and showed that levels seldom increased in obese patients even with se- verely reduced cardiac function. However, it is still undetermined whether plasma BNP levels are actually limited to an increase in obese patients with very severe cardiac dysfunction during the terminal stages of heart failure. Second, we proposed and modified a path model for the bestfit; however, the current predictors of pre-BNP were explained by only 45.1% of the variance. Other path models may be better and we may have to modify the current model. For example, the LVEF was
measured at only one point before admission. However, the LVEF would change slightly during treatment. The LVEF after treatment would be useful for the purposes of accuracy. Moreover, we previously reported that the left ventricular end-systolic volume index (LVESVI) was associated with plasma BNP levels more sensitively than the LVEF [3]. Unfortunately, we had no data for the LVESVI in this study. If the LVESVI is used in a path analysis, the estimates of squared multiple cor- relations for the pre-BNP would be further improved.
Funding sources
No funding was received for this study.
Author contributions
Conceived and designed the experiments: KK, MK, and MY.
Acquisition of data: KK, KM, KO, and YI.
Analyzed the data: KK, MK, KM, YI, and MY.
Wrote the paper: KK, MK, and MY.
Final approval of the version to be submitted: KK, MK, KM, KO, YI, and MY.
Conflict of interest
None of the authors have any conflicts of interest to disclose.
Fig. 4.Histograms and distribution of study patients according to pre-BNP and post-BMI. (A) The histogram for patient numbers according to plasma BNP levels before treatment for heart failure. (B) The histogram for patient numbers according to BMI after treatment for heart failure. (C) The distribution patterns of obese and nonobese patients according to the plasma BNP level in the acute phase of heart failure. *Pb0.05 vs. 0–500, Pb0.05 vs. 500–1000. (D) The distribution patterns of patients with low and high plasma BNP levels in the acute phase of heart failure according to the degree of obesity. *Pb0.05 vs. 0–15. Pre-BNP means the plasma BNP levels before treatment. Post-BMI means BMI after treatment. BMI: body mass index; BNP: B- type natriuretic peptide.
Acknowledgments
We thank all of the trial physicians and nurses at all of the participat- ing hospitals for their important contributions to this study. We would like to thank Kumiko Nishiyama for data assistance.
References
[1] T. Sudoh, K. Kangawa, N. Minamino, H. Matsuo, A new natriuretic peptide in porcine brain, Nature 332 (1988) 78–81.
[2] M. Mukoyama, K. Nakao, K. Hosoda, et al., Brain natriuretic peptide as a novel cardi- ac hormone in humans. Evidence for an exquisite dual natriuretic peptide system, atrial natriuretic peptide and brain natriuretic peptide, J. Clin. Invest. 87 (1991) 1402–1412.
[3] H. Yasue, M. Yoshimura, H. Sumida, et al., Localization and mechanism of secretion of B-type natriuretic peptide in comparison with those of A-type natriuretic peptide in normal subjects and patients with heart failure, Circulation 90 (1994) 195–203.
[4] S. Suzuki, M. Yoshimura, M. Nakayama, et al., Plasma level of B-type natriuretic pep- tide as a prognostic marker after acute myocardial infarction: a long-term follow-up analysis, Circulation 110 (2004) 1387–1391.
[5] L.B. Daniels, P. Clopton, K. Jiang, B. Greenberg, A.S. Maisel, Prognosis of stage a or B heart failure patients with elevated B-type natriuretic peptide levels, J. Card. Fail.
16 (2010) 93–98.
[6] T. Nakane, M. Kawai, K. Komukai, et al., Contribution of extracardiac factors to the inconsistency between plasma B-type natriuretic peptide levels and the severity of pulmonary congestion on chest X-rays in the diagnosis of heart failure, Intern.
Med. 51 (2012) 239–248.
[7] M. Kawai, M. Yoshimura, M. Harada, et al., Determination of the B-type natriuretic peptide level as a criterion for abnormalities in japanese individuals in routine clin- ical practice: the J-ABS multi-center study (Japan Abnormal BNP Standard), Intern.
Med. 52 (2013) 171–177.
[8] O. Nakagawa, Y. Ogawa, H. Itoh, et al., Rapid transcriptional activation and early mRNA turnover of brain natriuretic peptide in cardiocyte hypertrophy: evidence for brain natriuretic peptide as an‘emergency’cardiac hormone against ventricular overload, J. Clin. Invest. 96 (1995) 1280–1287.
[9] E. Harada, O. Nakagawa, M. Yoshimura, et al., Effect of interleukin-1 beta on cardiac hypertrophy and production of natriuretic peptides in rat cardiocyte culture, J. Mol.
Cell. Cardiol. 31 (1999) 1997–2006.
[10] T. Inoue, M. Kawai, T. Nakane, et al., Influence of low-grade inflammation on plasma B-type natriuretic peptide levels, Intern. Med. 49 (2010) 2659–2668.
[11] E. Morita, H. Yasue, M. Yoshimura, et al., Increased plasma levels of brain natriuretic peptide in patients with acute myocardial infarction, Circulation 88 (1993) 82–91.
[12] Ghasemi V. Tehran: Jameeshnasan Publisher, Structural Equation Modeling in Social Researches Using Amos Graphics, 2013 361.
[13] T.J. Wang, M.G. Larson, D. Levy, et al., Impact of obesity on plasma natriuretic peptide levels, Circulation 109 (2004) 594–600.
[14] T. Date, T. Yamane, S. Yamashita, et al., Paradoxical clearance of natriuretic peptide between pulmonary and systemic circulation: a pulmonary mechanism of main- taining natriuretic peptide plasma concentration in obese individuals, J. Clin.
Endocrinol. Metab. 97 (2012) E14–E21.
[15] S. Arase, M. Kawai, T. Nakane, et al., The increasing impact of a higher body mass index on the decrease in plasma B-type natriuretic peptide levels, IJC Metab. Endocr.
4 (2014) 39–46,http://dx.doi.org/10.1016/j.ijcme.2014.07.007.
[16] K. Miyashita, H. Itoh, H. Tsujimoto, et al., Natretic peptides/cGMP/cGMP-dependent protein kinase cascades promote muscle mitochondrial biogenesis and prevent obesity, Diabetes 58 (2009) 2880–2892.
[17] N.H. Banke, A.R. Wende, T.C. Leone, et al., Preferential oxidation of triacylglyceride- derived fatty acids in heart is augmented by the nuclear receptor PPARα, Circ. Res.
107 (2010) 233–241.
[18]J.G. Duncan, K.G. Bharadwaj, J.L. Fong, et al., Rescue of cardiomyopathy in peroxi- some proliferator-activated receptor-αtransgenic mice by deletion of lipoprotein li- pase identifies sources of cardiac lipids and peroxisome proliferator-activated receptor-αactivators, Circulation 121 (2010) 426–435.
[19] F. Liang, F. Wang, S. Zhang, D.G. Gardner, Peroxisome proliferator activated receptor (PPAR) alpha agonists inhibit hypertrophy of neonatal rat cardiac myocytes, Endocrinology 144 (2003) 4187–4194.
[20] Y. Luo, C. Jiang, A.J. Belanger, et al., A constitutively active hypoxia-inducible factor- 1alpha/VP16 hybrid factor activates expression of the human B-type natriuretic peptide gene, Mol. Pharmacol. 69 (2006) 1953–1962.
[21] A. Weidemann, B. Klanke, M. Wagner, et al., Hypoxia, via stabilization of the hypoxia-inducible factor HIF-1alpha, is a direct and sufficient stimulus for brain- type natriuretic peptide induction, Biochem. J. 409 (2008) 233–242.
[22]C. Treins, S. Giorgetti-Peraldi, J. Murdaca, G.L. Semenza, E. Van Obberghen, Insulin stimulates hypoxia-inducible factor 1 through a phosphatidylinositol 3-kinase/
target of rapamycin-dependent signaling pathway, J. Biol. Chem. 277 (2002) 27975–27981.
[23] Z.N. Demidenko, M.V. Blagosklonny, The purpose of the HIF-1/PHD feedback loop:
to limit mTOR-induced HIF-1α, Cell Cycle 10 (2011) 1557–1562.
[24] Y. Mizuno, E. Harada, D. Katoh, et al., Cardiac production of B-type natriuretic pep- tide is inversely related to the plasma level of free fatty acids in obese individuals
—possible involvement of the insulin resistance, Endocr. J. 60 (2013) 87–95.
[25] Y. Inoue, M. Kawai, K. Minai, et al., The impact of an inverse correlation between plasma B-type natriuretic peptide levels and insulin resistance on the diabetic con- dition in patients with heart failure, Metabolism 65 (2016) 38–47,http://dx.doi.org/
10.1016/j.metabol.2015.09.019.
[26] J.J. McMurray, M. Packer, A.S. Desai, et al., PARADIGM-HF investigators and commit- tees. Angiotensin-neprilysin inhibition versus enalapril in heart failure, N. Engl. J.
Med. 371 (2014) 993–1004.
[27] K. Minai, T. Ogawa, M. Kawai, et al., The plasma B-type natriuretic peptide levels are low in males with stable ischemic heart disease (IHD) compared to those observed in patients with non-IHD: a retrospective study, PLoS One 9 (2014) e108983,http://
dx.doi.org/10.1371/journal.pone.0108983.