Amperometric Detection of Nitrogen Oxides by Means of Interdigitated Array Electrodes
journal or
publication title
Analytical Sciences
volume 13
number 6
page range 981‑986
year 1997‑12
URL http://hdl.handle.net/2298/11002
doi: 10.2116/analsci.13.981
Amperometric Detection of Nitrogen Oxides by Means of Interdigitated Array Electrodes
Kei Toda, Shuichi Hashiguchi, Seiki Oguni and Isao Sanemasa
Department ofEnvironmental Science, Faculty of Science, Kumamoto University, Kurokami, Kumamoto 860, Japan
The detection of nitrogen oxides contained in air was investigated using their redox cycles. NO and NO2 gases can be detected by means of interdigitated array (IDA) electrodes made of Au that are fabricated on a gas-permeable membrane.
The IDA electrodes were applied to a gas detection system for the first time. Although the membrane is soft and flexible, and has pores, the electrodes can be formed successfully on it by photolithography devised in our laboratory. Between the electrodes, redox cycles are produced, and, hence, the gas sensitivities increase. The reactions in this redox cycles are not simple, and it was confirmed that nitrate produced on the generator electrode reacts with NO gas on the collector in the NO detection system. The increase in sensitivity based on the generation of the redox cycle in amperometric detection appears to be improved by decreasing the distance between the electrodes.
Keywords Nitrogen oxides gas sensor, interdigitated array electrode, redox cycle
Solid-state gas sensors have many advantages; e.g.
they are small in size, maintenance-free and possess the possibility of being manufactured through micro- fabrication. On the other hand, amperometric gas sensors using liquid electrolytes have relatively stable characteristics, and the sensor current can be analyzed theoretically. Thus, amperometric gas sensors have also been widely studied in recent years, mostly aimed at measuring hydrocarbons, carbon oxides1"4, nitrogen oxides, sulfur compounds5, reduced nitrogen6, oxygen78 and toxic hydride gases.9 Chang etal. reported on amperometric gas sensors in a review.10 Of these gases, nitrogen oxides represent those largely contribute to acid-rain. The control of gases from exhausts of auto mobiles and combustion is a social problem that we must come to grips with urgently. Amperometric measurements of NO* were studied by Sedlak11"14 and Dutta15 etal. previously. NO and NO2 gases were measured discriminatively by using a Teflon-bonded diffusion electrode through the oxidation and reduction of the gases, respectively. A study from a practical point of view was also reported.16
Recently, a highly sensitive amperometric measure ment has been carried out using redox cycles, and it has caught wide attention.17"25 A pair of interdigitated array (IDA) electrodes arranged closely to each other is fabricated on a substrate through a conventional photolithographic technique. An analyte is oxidized on one of the IDA electrodes (generator), and the product diffuses to reach the adjacent electrode (collector) surface, and is reduced there. The reduced species can be oxidized again on the generator electrode. According
ly, a redox cycle is generated between the IDA electrodes.
With this method, even trace amounts of components can be determined, because of its repeating reaction. Until now, experiments using such redox cycles have been carried out in solution systems, and the IDA electrodes are made up on flat substrates, such as silicon or glass wafers. This study is the first case where redox cycles were applied to gas detection using IDA electrodes.
The advantages of using IDA electrodes are also expected to be seen in gas-sensing systems. Different from the solution system, however, the electrodes should be fabricated on a gas-permeable membrane in order to obtain good responses and sensing characteristics. We thus started this study in order to develop a technique for preparing IDA electrodes on a membrane, and then, attempted to apply the electrodes to NO* gas detection.
Experimental
Electrodes
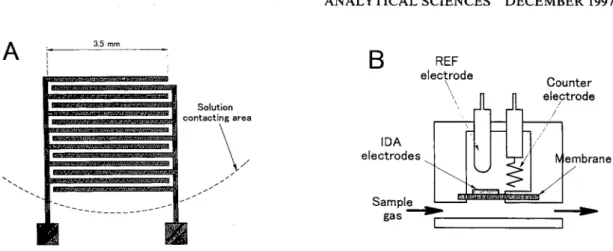
The construction of the IDA electrodes and the gas sensor used are shown in Fig. 1. The IDA electrodes were formed, as mentioned below, on a gas-permeable membrane (membrane filter FP-022, Flon Industry) made of PTFE. The fabrication process is shown in Fig. 2. The membrane was 25 mm in diameter and 0.06 mm thick and the pore size was 0.22 urn. Since the membrane was soft and flexible, it had to be fixed on a hard and flat substrate. The membrane, after being washed with acetone, was put on a 3-inch (76.2 mm) silicon wafer with photoresist (MP1400-22, Shipley) used
Solution contacting area
IDA
electrodes N embrane
Fig. 1 IDA electrodes and sensor structure used: (A) structure of the IDA electrodes fabricated on the PTFE membrane, the width and gap were 100 urn each, the length of the arms was 3.5 mm; (B) whole structure of the gas sensor constructing the IDA electrodes. The cell was made of PVC and was 30 mm in inner diameter and 36 mm in height; the inner volume was 25 ml.
The counter and reference electrodes were Pt black and Ag/AgCl, and the inner solution was 0.05 M H2SO4.
as a binder. After baking it to assure bonding of the two in a thermo-controlled box at 80° C for 20 min, the same photoresist was spin-coated on the membrane at 1000 rpm; then, the resist-pattern was made by a conventional photolithography technique. Prior to development, the thus-treated membrane was soaked in chlorobenzene to make the lift-off process easy.26'27 Au IDA patterns were made by vacuum evaporation of Au and the lift-off method, where the membrane was dipped into a remover (1165, Shipley). In the lift-off process, unwanted Au parts were removed by dissolving the photoresist; simultaneously, the membrane could also be easily removed from the substrate. The electrodes thus- prepared consisted of two sets of arrays, each of which had 7 arm-like electrode elements. Each element was 100 jim in width (WG) and 3.5 mm in length, and separated by a gap of 100|im in width (Wg) from the adjacent element. The area of each electrode was about 2.6 mm2.
Binding to a wafer with photoresist
Spin-coating of photoresist (3)
Exposure to UV and development
Vacuum evapolation]
of Au
Membrane
/
\
Wafer Photo resist
WM////////////A
Apparatus
The membrane on which the IDA electrodes were formed was washed in 0.1 M HNO3, rinsed with deionized water before use, and then constructed into a sensor-housing together with a Pt black counter (Pt black was deposited before use on a Pt electrode, BAS) and an Ag/AgCl reference (RE-IB, BAS) electrodes. These counter and reference electrodes were fixed with o-rings (specification in dimension was P5) made of Viton® in order to prevent the inner solution from contacting with air. These electrodes were joined to a dual-potentiostat that was designed and constructed in this laboratory.
Although with a usual potentiostat, the working electrode is connected to a ground-line, the counter electrode of this system was led to the ground-line, because two kinds of potentials must be set for working electrodes. The sensor-housing, made of PVC, was of the flow-through-
Lift-off and removement from the wafer
Fig. 2 Preparation method of IDA electrodes on a gas- permeable membrane. © The membrane was put on a 3- inch silicon wafer with photoresist as a binder, and baked to assure the bonding of the two in a thermo-controlled box at 80° C for 20 min. © The photoresist was spin-coated on the membrane at 1000 rpm, and baked at 80° C for 20 min.
® The photoresist was exposed to UV light through the photomask and developed after soaking in chlorobenzene.
© The Au film was formed by a vacuum evaporation.
© Needless Au parts were removed by the lift-off process, and the membrane was removed from the substrate in the
remover.
o
-0.2- -0.2-
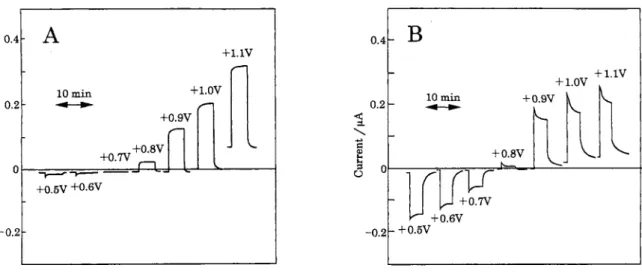
Fig. 3 Effect of the electrode potential on the current response to 200 ppm of NO (A) and 100 ppm of NO2 (B) at the single-mode.
0.4
0.2
-0.2
C01.+0.5V
+0.7V +0.8V
lOmin
Fig. 4 Effect of the collector potential on the current response to 200 ppm of NO (A) and 100 ppm of NO2 (B) in the dual-mode. The generator potential was held at +1.0 V vs. Ag/AgCl constant.
type, and an inner solution (0.05 M H2SO4) was sepa rated by the membrane from a sample gas stream.
Procedure
Air containing variable known concentrations of NO*
gases was introduced into the flow-line at a rate of lOOmJmin"1. The sample gases were prepared by dilution of the standard gases (1000 ppm NO or 1% NO2, N2 balance, Nippon Sanso Co.) with air by the help of mass-flow controllers (SEC-4400s, STEC Inc.).
Furthermore, the sample gas was required to pass through two steps of dilution when the sensor was evaluated at low concentrations. The voltages of the individual sets were applied to the two working elec trodes, and the current of each electrode was measured and recorded.
Results and Discussion
Optimum potentials ofeach electrode
Figure 3 shows the relation between the electrode potential and the responses to NO* at a single-mode. In the single-mode, a potential was applied only to the generator, while the collector remained open. Below +0.7 V vs. Ag/AgCl, the current of the sensor hardly increased upon the mixing of the NO gas into the sample stream. In the case of NO2 detection, the negative response increase depended on the decrease in the potential, which was caused by a reduction of the gas.12 Above +0.8 V, the response increased steeply depending on the increase in the potential. At over +1.0 V, not only was the response not much larger, but also the baseline level rose. Hence, +1.0 V was found to be the
-0.2
Fig. 5 Difference in the sensor responses between the single- and dual-modes, when 200 ppm of NO gas was introduced into the cell. (A) and (B) are the responses obtained when potentials were applied solely to the collector and generator, respectively, and (C) is the response in the dual-mode. The potentials of the generator and collector were +0.6 V and +1.0 V vs. Ag/AgCl, respectively.
optimum potential for NO* gas oxidation.
Subsequently, a dual-mode was examined. The results are shown in Fig. 4. The potential of the generator was controlled at +1.0 V constantly, and only the collector potential was changed from +0.8 to +0.5 V by 0.1 V step.
According to the decrease in the collector potential, the negative response of the collector increased greatly.
The response of the generator also increased according to the decrease in the collector potential. At +0.5 V, the noise of the baseline increased, and the optimum potential of the collector was determined to be +0.6 V.
At these potentials, the difference in the response between the single- and dual-modes was examined; the results are given in Fig. 5. When a voltage (+0.6 V) was applied to only the collector and the generator was open
current in the presence of NO gas was 25-times as much as in the NO-free condition. A curve (C) was obtained when the voltages were supplied to both of the electrodes.
In this mode, the current of the collector also changed, and the response of the generator current was larger than in the single-mode. These facts indicate that the redox species produced on the generator reacted on the col lector surface, and was re-oxidized on the generator surface.
Calibration curves
Figure 6 indicates calibration curves of NO (A) and NO2 (B) obtained in the single- and dual-modes. The current responses at both the generator and collector increased almost in proportion to the gas concentrations.
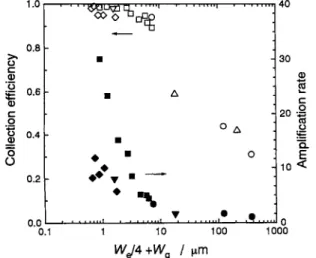
We can see that the sensitivity of the sensor to NO2 was larger than it was to NO. The reason could be as follows: NO gas did not dissolve much into the electrolyte; for example, the solubility of NO in water is 61.7 ppm (w/w) at 20° C and 1 atm.28 Further, the NO2-permeability of the PTFE membrane is larger than the NO-peameability.16 The collection efficiency and amplification rate were obtained from the curves. By definition, the collection efficiency can be calculated from the current ratio of the generator to collector, and the amplification rate from the ratio of the oxidation current at the dual-mode to the current at the single- mode. In the NO sensing system, the collection efficiency and the amplification rate were 43% and 1.77, respectively. In the case of NO2, the amplification rate was 1.49. These factors could be improved the finer IDA electrodes are fabricated on the membrane. It was expected to gain an improvement from Fig. 7, which shows the relationships between the factors and dimensions of the IDA electrodes obtained from the use of Fe(CN)64~/3~ redox reactions. The abscissa indicates
10
NO concentration / ppm
0 2 4 6 8 10
NO2 concentration / ppm
Fig. 6 Calibration curves of NO (A) and NO2 (B). The symbols O# and □■ indicate the current changes at the generator and collector, and the open and solid symbols show that obtained in the single- and dual- mode, respectively.
1.0
oO
Fig. 7 Scale effect of the IDA electrodes on their collection efficiency and amplification rate. The abscissa indicates the average diffusion length defined as We/4+Wg. O#, our experimental; □■, from reference (17); A A, from (18); VV, from (21); <>♦, from (23). These data were obtained in the redox reaction concerned with Fe(CN)64~/3~. The open and solid symbols indicate the collection efficiency and ampli fication rate, respectively.
the average diffusion length, defined as We/4+JVg.17 Data taken from the literature were also plotted together with our experimental values. At 125 urn in Wc/4+ Wg, which was at the same dimension as the sensor used for the NOx detection, the plotted data in Fe(CN)64-/3"
system were nearly equal to the factors obtained in the NO sensing system. If the electrodes were prepared with a few microns of gap, the sensitivities might increase by more than ten times. Unfortunately, fabricating the pattern on the membrane was more difficult than that on a hard and flat substrate. The dimensions used in fabricating the electrodes were the limit that electrodes could be prepared reproducibly at the time of the experiments in this laboratory.
Mechanism of redox cycle reactions
Some investigations on redox reactions of nitrogen oxides, nitrite and nitrate have been reported.29"31 There are many reactions concerning the system, which are complicated30 because the standard potentials of these reactions are similar to one another, as shown in
HNO2+H+-f-e-^=^NO(g)+H2O E°: +0.99 V (1) NO2(g)+2H++2e-^=±NO(g)+H2O E°: +1.03 V (2) NO3-+4H++3e-^±NO(g)+2H2O E°:+0.96V (3) NO3"+3H++2e-;^HNO2+H2O £°:+0.94V (4) NO2(g)+H++e-^=±HNO2 E°: +1.07 V (5)
I
0.2 0 -0.2
-0.4
-0.6
-0.8
i n -
-
-
(
-
20min
Fig. 8 Response of the electrode in the single-mode to 200 ppm of NO gas when 50 mM nitrate was added to the inner solution. The potential of the electrode was +0.6 V vs. Ag/AgCl, the same as that of the collector in the dual- mode.
NO3+2H++e;=*NO2(g)+H2O E°: +0.81 V (6) NO3-+H2O+2e-^=±NO2-+2OH- E°: +0.01 V (7)
The reactions of Eqs. (l)-(6) (from right to left) occurred on the generator, and the reverse on the collector. The generated nitrite by the oxidation of NO or the reduction of nitrate might also be oxidized as in Eq. (7), where the standard redox potential is sufficiently low. However, it was considered that this reaction hardly comes about, because the proton-free-nitrite and hydroxide ions are at a very low concentration in the electrolyte.
In addition, as mentioned above, the amplification rate of the NO sensing system was found to be larger than that of the NO2 system. From the results, the existence of a reaction peculiar to NO was expected. To confirm this, another experiment was carried out, the results of which are given in Fig. 8. In this experiment, 50 mM of nitrate was added beforehand to the inner solution instead of the product of the generator, and NO gas was put into the flow cell. The experiment was carried out in the single- mode and the potential was set at +0.6 V vs. Ag/AgCl.
Compared with Fig. 5A, the reducing current in the presence of NO clearly increased as a result of the added nitrate. It was considered that the NO reacted with nitrate according to the following equation:
NO +NO3"+e- <=± 2NO2" E°: +0.49 V (8)
When the regular electrolyte, i.e. nitrate-free H2SO4 solution was used in the dual-mode, this reaction (Eq. (8)) probably occurred on the collector, as in this simulation, where nitrate was added to the inner solution.
Simultaneously, the reductions of nitrate with protons also occurred in the redox system. The thus-produced nitrate reacted on the generator, and contributed to the
electrodes17"25, the reactions on the collector were inverse to the generator reactions. However, in this redox system, the reactions were complicated, and it was considered that many reactions occurred.
It seems at a glance that the use of IDA electrodes in a gas sensor of the flow-through-type is not effective upon an increase in sensitivity, because analyte molecules are forcedly supplied to the electrodes one after another from the sample stream, in contrast with the diffusion- type. However, the value of using the IDA electrodes is explained as follows. In gas sensing, at first, the gas molecules diffuse through the membrane and reach the electrode to react on it. The gas reaction area is mainly the point of the electrode contacting with both of the air and the inner solution; the area is very small. However, the products on the electrodes are ions (not gases), and the produced redox species diffuse in the solution to be oxidized or reduced at any point of the electrodes. In this way, it is expected that the sensitivity is also increased in gas-sensing by use of the IDA electrodes.
This study was supported by Grant-in-Aid for science research from Ministry of Education, Science, Sports and Culture of Japan.
References
1. J. C. Fidler, W. R. Penrose and J. P. Bobis, IEEE Trans.
Inst. Meas., 41, 308 (1992).
2. S. Uchikoshi, T. Ishiji, S. Fukuda and K. Tachibana, Denki Kagaku, 61, 913 (1993).
3. T. Ishiji, K. Takahashi and A. Kira, Anal. Chem., 65,2736 (1993).
4. T. Ishiji and K. Takahashi, Sens. Actuators B, 13 -14, 583 (1993).
5. G. Schiavon, G. Zotti, R. Toniolo and G. Bontempelli, Anal. Chem., 67,318(1995).
6. T. Osakai, T. Kakutani and M. Senda, Anal. Set, 3, 521 (1987).
7. K. Katakura, A. Noma, Z. Ogumi and Z. Takehara, Chem. Lett., 1990, 1291.
8. W. Preidel, J. R. Rao, K. Mund, O. Schunck and E.
David, Sens. Actuators B, 28, 71 (1995).
(1993).
11. J. M. Sedlak and K. F. Blurton, J. Electrochem. Soc, 123, 1476 (1976).
12. J. M. Sedlak and K. F. Blurton, Talanta, 23, 811 (1976).
13. J. M. Sedlak and K. F. Blurton, Talanta, 23, 445 (1976).
14. H. W. Bay, K. F. Blurton, J. M. Sedlak and A. M.
Valentine, Anal. Chem., 46, 1837 (1974).
15. D. Dutta and D. Lundolt, /. Electrochem. Soc, 119, 1320 (1972).
16. Y. Sakai, Seikatsu To Kankyo, 28, 55 (1983).
17. O. Niwa, M. Morita and H. Tabei, Anal. Chem., 62, 447 (1990).
18. A. Aoki, T. Matsue and I. Uchida, Anal. Chem., 62, 2206 (1990).
19. O. Niwa, Y. Xu, H. B. Halsall and W. R. Heineman, Anal Chem., 65, 1559 (1993).
20. O. Niwa and H. Tabei, Anal. Chem., 66, 285 (1994).
21. U. Wollenberger, M. Paeschke and R. Hintsche, Analyst [London], 119, 1245 (1994).
22. D. Bustin, S- Mesaros, P. Tomcik, M. Rievaj and V.
Tvarozek, Anal. Chim. Acta, 305, 121 (1995).
23. M. Paeschke, U. Wollenberger, C. Kohler, T. Lisec, U.
Schnakenberg and R. Hintsche, Anal. Chim. Acta, 305, 126(1995).
24. G. C. Fiaccabrino, X.-M. Tang, N. Skinner, N. F. de Rooij and M. Koudelka-Hep, Anal. Chim. Acta, 326, 155 (1996).
25. O. Niwa and M. Morita, Anal. Chem., 68, 355 (1996).
26. A. Fathimulla, J. Vac. Sci. Technol, B3, 25 (1985).
27. Y. Mimura, J. Vac. Sci. Technol, B4, 15 (1985).
28. Chemical Society of Japan (ed.), "Kagaku Binran, (Chemical Handbook, in Japanese)", 2nd ed., Maruzen, Tokyo, 1975.
29. D. L. Ehman and D. T. Sawyer, /. Electroanal. Chem.
Interfacial Electrochem., 16, 541 (1968).
30. S. Ye and H. Kita, J. Electroanal. Chem. Interfacial Electrochem., 346, 489 (1993).
31. M. Maskus, F. Pariente, Q. Wu, A. Toffanin, J. P.
Shapleigh and H. D. Abruiia, Anal. Chem., 68, 3128 (1996).
(Received June 13, 1997) (Accepted August 14, 1997)