This is the pre-peer reviewed version of the following article:
[https://onlinelibrary.wiley.com/doi/full/10.1111/ijd.13976], which has been published in final form at [doi: 10.1111/ijd.13976]. This article may be used for non-commercial purposes in accordance with Wiley Terms and Conditions for Use of Self-Archived Versions.
Title
Chronic idiopathic erythroderma of elderly men is an independent entity that has a distinct TARC/IgE profile from adult atopic dermatitis.
Authors
Yasunori Ohga, M.D., Bayaraa Bolortuya, M.D., and Shinichi Imafuku, M.D., Ph.D.
Department of Dermatology, Fukuoka University Faculty of Medicine
Conflicts of Interests: We declare no conflict of interest in this study.
Funding sources: No financial support.
Abstract
Background: Although there are several diseases that cause erythroderma, patients are often encountered with erythroderma of unknown cause which persists for a long time.
The aim of this study was to characterize this chronic idiopathic erythroderma (CIE).
Methods: Adult patients with CIE, atopic dermatitis (AD), psoriatic erythroderma (PsE), or generalized drug eruption (DE), who visited Fukuoka University Hospital Dermatology Department from 2010 to 2015, were enrolled. Their clinical and laboratory data were extracted from the patient database. CIE was defined as erythroderma without any apparent cause and lasting more than 3 months.
Results: Twenty-three CIE, 82 AD, 39 psoriatic erythroderma and 99 drug eruption cases were enrolled. The mean age of CIE patients was 74.7±8.8, and the male:female ratio was 21:2. Laboratory data for CIE and AD were similar, but serum levels of thymus and activation-regulated chemokine (TARC), a T helper (Th) 2 cytokine, in the CIE group were significantly more elevated than in the AD group. Conversely, serum immunoglobulin (Ig) E levels were significantly lower in CIE patients compared with the atopic dermatitis group, and the ROC curve of the TARC/IgE ratio (7.24) provided efficient differentiation of the CIE group from AD patients. About PsE and DE, significant elevation of c-reactive protein was observed. Aspartate aminotransferase and alanine aminotransferase were also elevated in DE.
Conclusions: CIE is an independent condition which is likely to occur in elderly men.
Immunity is shifted to the Th2 type in CIE, however, the mechanism may differ from that of atopic dermatitis.
Introduction
Erythroderma is characterized by diffuse erythema of the skin accompanied by a variable degree of scaling involving over 90% of the body surface.
Various diseases cause erythroderma, including eczema, atopic dermatitis, psoriasis,
rashes induced by drugs or viral infection, Sezary syndrome and cutaneous lymphomas
such as mycosis fungoides. However, dermatologists often encounter erythrodermic
cases of unknown etiology and, in approximately 30% of erythroderma patients, there is
no underlying cause
1. Papuloerythroderma of Ofuji is a representative erythroderma of
unknown cause often seen in elderly men
2-5. It exhibits the characteristic clinical finding
that papules and erythema fuse and expand to involve the whole body and become
erythrodermic, but the erythema avoids skin folds, the so-called “deck chair sign”.
However, patients with erythroderma of unknown cause do not necessarily conform to this clinical manifestation.
Typically, such idiopathic erythroderma is frequently seen in elderly men. However, we do not know whether this senile erythroderma represents an independent disease entity.
In previous studies
1,3, senile erythroderma patients were shown to have elevated levels of serum immunoglobulin (Ig) E and thymus and activation-regulated chemokine (TARC). Patients with atopic dermatitis (AD) are also well known to have elevated IgE and TARC
6. These common findings provoke the question of whether the pathophysiology of senile erythroderma is similar to AD.
To examine whether senile erythroderma is an independent entity, we compared clinical/biochemical characteristics of diseases that cause erythroderma, namely typical AD, psoriatic erythroderma (PsE), generalized drug eruption (DE).
Methods Patients
This was a retrospective cross-sectional study. Among patients who visited the Department of Dermatology, Fukuoka University Hospital between January 2010 and December 2015, clinical data for those diagnosed as having erythroderma were extracted from the patient database. Medical records of patients were manually checked and those whose erythroderma continued for more than 3 months without any known cause were designated as suffering from chronic idiopathic erythroderma (CIE). Patients with obvious evidence of cutaneous lymphoma (adult T-cell lymphoma, mycosis fungoides, Sezary’s syndrome or anaplastic large cell lymphoma) were excluded.
Patients with a medical history of AD, or with obvious eczema lesions were also excluded from the CIE group.
To outline the characteristics of CIE, patients with adult AD, PsE and DE were included
as controls. For each disease, clinical data of patients older than 18 years were extracted
in a similar manner from the database, and the diagnosis was confirmed manually by
referring to the medical record. Patients with AD were enrolled only with a clinically
typical manifestation that fulfills the criteria of Hanifin and Rajka, and with blood test
results. Patients with PsE were diagnosed by clinical manifestation and
histopathological examination. For DE, patients with toxic epidermolytic necrolysis and Stevens–Johnson syndrome were excluded, and we enrolled only patients with clinical manifestations of the disseminated papulo-erythematous type of DE, confirmed by histopathological examination.
Blood tests
Data describing hematologic and biochemical tests undertaken at the patients’ first visit were used.
Statistical analysis
Statistical analysis was carried out using SPSS. For comparisons between two groups, Student's t test was used for continuous changes and the Mann–Whitney U test was applied for non-parametric variables. The significance level was set at p<0.05.
Correlations between variables were analyzed by Spearman's rank correlation analysis.
A correlation coefficient, r, of less than 0.2 was considered as no correlation, 0.2–0.4 as a weak correlation, 0.4–0.6 as moderate, 0.6–0.8 as strong, and 0.8 or greater as an extremely strong correlation. This research was approved by the ethical committee of Fukuoka University School of Medicine.
Results
Profiles of patients (Table 1)
There were 23 patients (21 men, two women, male/female ratio=10.5) in the CIE group.
The mean age of CIE patients was 74.7 years old. Complications of malignant tumors
were found in seven of 23 CIE patients (30.4%), all of which were men. There was one
case with a history of gastric cancer that was completely resected without recurrence,
two cases of completely resected colorectal cancer without recurrence, one case with
colorectal cancer whose erythroderma was improved after surgical removal of the
cancer, one case with a history of both gastric and esophageal cancers that were
successfully treated, one case with a renal pelvis carcinoma and a past history of both
gastric and esophageal cancer, and one case with a well-differentiated liposarcoma and a
history of colon cancer. With respect to clinical manifestation, erythema that avoided
skin folds of the abdomen, axilla and popliteal fossa was observed in eight of the 23
patients (34.8%), which is a characteristic manifestation of papuloerythroderma known
as the deck chair sign.
Among the controls, there were 82 subjects (53 men, 29 women) in the AD group, 39 (29 men, 10 women) in the PsE group, and 99 in the DE group (51 men, 48 women).
The male/female ratio was clearly higher in the CIE group than in the AD and DE groups (p=0.018, p<0.001 respectively, using Fisher's exact test), but there was no significant difference between the CIE and PsE groups (p=0.182, Fisher's exact test).
The mean age of subjects in the CIE group was significantly higher than in the AD, PsE and DE groups combined (p<0.001). Thus, CIE developed more frequently in elderly men.
Blood test results (Table 2)
Next, we compared the hematological and biochemical findings between the groups.
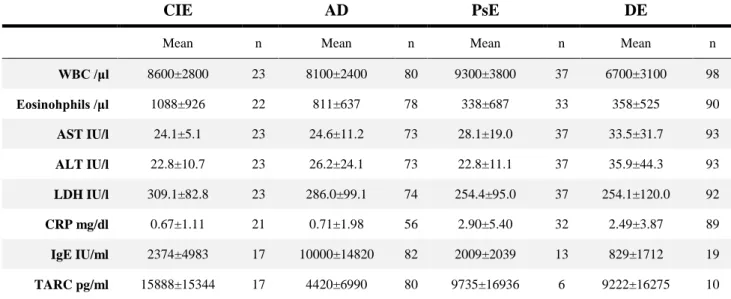
There was no significant difference in the mean white blood cell count of the CIE group compared with the AD and PsE groups (p=0.367 and p=0.428, respectively), but the count was higher compared with the DE group (p=0.008). The eosinophil count was highest in CIE (1088±926), and was significantly higher than that in PsE and DE groups (p=0.002 for both comparisons), but was not significantly different from that in AD patients (p=0.108).
Aspartate aminotransferase and alanine aminotransferase levels were highest in the DE group (33.5±31.7 IU/L and 35.9±44.3 IU/L, respectively), and were significantly higher than those of the CIE group (p=0.007 and p=0.012, respectively). Lactate dehydrogenase (LDH) was highest in CIE patients (309.1±82.8 IU/L), and was significantly higher than in the PsE and DE groups (p=0.027 and p=0.04, respectively), but not significantly different from AD patients (p=0.314).
The mean C-reactive protein (CRP) level was higher in the PsE (2.90±5.40 mg/dL) and
DE groups (2.49±3.87 mg/dL), but was only slightly increased in the CIE (0.67±1.11
mg/dL) and AD groups (0.71±1.98 mg/dL). The mean CRP value was significantly
lower in the CIE group compared with the PsE (p=0.03) and DE groups (p<0.001), and
there was no significant difference compared with AD patients (p=0.932).
Serum IgE levels were highest in the AD group (10,000±14,820 IU/mL). The IgE values of the CIE group were significantly lower than those of the AD group (p<0.001), and there was no significant difference compared with the PsE and DE groups (p=0.806, 0.239 respectively).
The mean TARC level was highest in the CIE group (15888±15344 pg/ml) and was significantly higher than in the AD group (p=0.008), but there was no significant difference compared with the PsE and DE groups (p=0.42 and p=0.296, respectively) due to the limited number of samples.
From the results shown in Table 2, only IgE and TARC levels were significantly different between AD and CIE patients. A moderate correlation between IgE and TARC was observed in the AD group (r=0.592, p<0.001). Conversely, there was no significant correlation between IgE and TARC in the CIE group (r=0.415, p=0.124). When the IgE–TARC relationships in the CIE and AD groups were plotted on a graph, the CIE patients clustered in a low IgE–high TARC area compared with the AD patients (Fig. 1).
Because the TARC/IgE (T/E) ratio of AD and CIE was different, we used this ratio as a distinction marker for CIE. The ROC curve of the T/E ratio (Fig. 2) showed an area under the curve of 0.918 (standard error=0.042, 95% confidential interval 0.834–1.000).
We determined the cut-off value as the point closest to 1-specificity of 0 and sensitivity of 1 on the ROC curve. The T/E ratio could successfully distinguish CIE from AD with a sensitivity of 80% and specificity of 95% when the T/E ratio was >7.24.
Discussion
Adult AD is considered to be an important disease for the differential diagnosis of CIE.
AD is a chronic dermatitis which is frequent in children, accompanied by deterioration
of epidermal barrier function, and characteristically associated with increases in serum
IgE and TARC levels
6. The pathogenesis of AD is thought to involve a patient's
immunity shifting to the Th2 type, and patients with AD often have allergic diseases
such as asthma and allergic rhinitis
7. It is considered that AD is most common in
children and prevalence decreases in adults, with many cases of natural remission. We
selected typical adult AD patients with a history from childhood as one of the
comparator disease groups for CIE.
TARC (also known as chemokine (C-C motif) ligand 17) is a cytokine produced by cells such as keratinocytes, dendritic cells, vascular endothelial cells and platelets
6. In particular, TARC is produced by dermal dendritic cells following stimulation by thymic stromal lymphopoietin, and causes Th2 cells to migrate to the skin
8. Serum levels of TARC closely reflect the severity of AD, and rise when AD is exacerbated
6.
3On the other hand, IgE is an immunoglobulin involved in type 1 allergic reactions.
Antigen-specific IgE binds to mast cells and basophils, inducing them to release mediators such as histamine in response to antigen stimulation. In a report of 169 AD patients followed for 4 years
9, a lower frequency of improved subjects (14.3%) was seen in a group with high IgE (>10,000 IU/mL), whereas a higher frequency (79.7%) was seen in a low IgE group (<1,000 IU / mL).
We observed that IgE and TARC were elevated in patients of both CIE and AD groups, as previously reported
1. However, the relationship between IgE and TARC was different in the two diseases, and the T/E ratio (>7.24) efficiently differentiated CIE from AD.
This observation has not been previously reported, and may prove that the two conditions are indeed independent of one another. One possibility remains that the T/E ratio is dependent on age. Because CIE occurs almost exclusively to the elderly men as one of the important feature of the disease, we could not compare data in the same age groups. When we analyzed the correlation between age and IgE, TARC, and T/E ratio in patients with AD, we found no correlation between age and IgE (r = - 0.15, p = 0.179), age and TARC (r = 0.092, p = 0.416), however, T/E ratio showed minimal correlation with age (r
= 0.236, p = 0.035). Therefore, age could be one of the factors that cause a difference. However, the T/E ratio of AD and CIE differed greatly, so we assume that characteristics of the disease cause the difference rather than age.
The mechanism leading to the observed difference between CIE and AD T/E ratio is not
yet understood. One clue is that many AD patients have barrier abnormalities in the
skin
10, which eventually leads to IgE production against exogenous environmental
antigens
11. Inherent barrier abnormalities are unlikely in CIE, so erythroderma may be occurring endogenously. In the elderly, the number of induced regulatory T cells decreases with age, which may lead to low-grade and chronic inflammation
12.
Another reason for endogenous erythroderma may be the tumor-bearing condition of the patients. Several patients with erythroderma complicated by a malignant tumor have been reported
4, and erythroderma has become recognized as a dermadrome that is associated with tumors. In our CIE group, seven of 23 patients (30.4%) had cancer complications. However, the average age of patients in the CIE group was 75 years old, therefore, it was undetermined whether this rate of cancer was particularly high. There are many cases in which there is no longitudinal correlation between the time of cancer diagnosis and the time of onset of erythroderma, so it cannot be asserted that a malignant tumor is the cause of the erythroderma.
In the CIE patients, LDH was correlated with TARC (r=0.539, p=0.026). Therefore, in CIE, similar to AD, we infer that LDH is released from keratinocytes in response to chronic dermatitis. Also, the CRP levels of patients with CIE were not elevated, while those of PsE and DE patients were increased. Patients with psoriasis commonly have chronically elevated CRP
13,14, and in psoriatic arthritis, CRP becomes higher
13. With DE, the effects of the original disease for which the drugs were administered, or drug-induced hepatitis may be responsible for the elevated CRP levels.
In summary, we found that 1) Patients in the CIE group were mostly elderly men of significantly greater age than patients in the other groups; 2) The biochemical data indicates that IgE and TARC were elevated in both the CIE and AD groups.
Furthermore, these two groups both had lower CRP and higher LDH compared with the PsE and DE patient groups; 3) In the CIE group, serum IgE was not elevated to the same extent as in AD patients, but conversely, TARC was higher. IgE and TARC correlated well in the AD group; however, this correlation was not seen in the CIE group. The ROC curve of the T/E ratio suggests that CIE can be distinguished from AD with a sensitivity of 80% and specificity of 95% when the T/E ratio is >7.24.
Limitations of this study are the relatively small sample size and that it was undertaken
in a single facility. Blood biochemical examinations were not performed in all cases. In some patients, treatment had already been started in other medical institutions. Ages of patient groups were different, which may have affected the biochemical results.
We conclude that CIE is a condition likely to occur in elderly men, and shows a high T/E ratio profile distinct from AD patients. In the future, further research is necessary that incorporates larger sample sizes and evaluation of a wider panel of cytokines in addition to TARC.
Acknowledgments
We thank Professor Hisatomi Arima for statistical suggestions.
Conflict of Interest None
References
1 Nakano-Tahara M, Terao M, Nishioka M et al. T helper 2 polarization in senile erythroderma with elevated levels of TARC and IgE.
Dermatology 2015; 230: 62-9.
2 Ofuji S, Furukawa F, Miyachi Y et al. Papuloerythroderma.
Dermatologica 1984; 169: 125-30.
3 Yamamura R, Murao K, Kubo Y. High serum thymus and activation regulated chemokine levels in papuloerythroderma of Ofuji. J Dermatol 2016.
4 Nomura T, Kodama K, Moriuchi R et al. Papuloerythroderma of Ofuji associated with early gastric cancer. Int J Dermatol 2008; 47: 590-1.
5 Salgüero I, Moreno C, Aguayo-Leiva I et al. Papuloerythroderma of Ofuji associated with chronic lymphatic leukaemia. Eur J Dermatol 2009; 19: 396-7.
6 Kakinuma T, Nakamura K, Wakugawa M et al. Thymus and
activation-regulated chemokine in atopic dermatitis: Serum thymus
and activation-regulated chemokine level is closely related with
disease activity. J. Allergy Clin. Immunol. 2001; 107: 535-41.
7 Pulendran B, Tang H, Manicassamy S. Programming dendritic cells to induce T(H)2 and tolerogenic responses. Nat Immunol 2010; 11:
647-55.
8 Soumelis V, Reche PA, Kanzler H et al. Human epithelial cells trigger dendritic cell mediated allergic inflammation by producing TSLP. Nat Immunol 2002; 3: 673-80.
9 Kiiski V, Karlsson O, Remitz A et al. High serum total IgE predicts poor long-term outcome in atopic dermatitis. Acta Derm Venereol 2015; 95: 943-7.
10 Palmer CN, Irvine AD, Terron-Kwiatkowski A et al. Common loss-of-function variants of the epidermal barrier protein filaggrin are a major predisposing factor for atopic dermatitis. Nat Genet 2006; 38:
441-6.
11 Boos AC, Hagl B, Schlesinger A et al. Atopic dermatitis, STAT3- and DOCK8-hyper-IgE syndromes differ in IgE-based sensitization pattern. Allergy 2014; 69: 943-53.
12 Jagger A, Shimojima Y, Goronzy JJ et al. Regulatory T cells and the immune aging process: a mini-review. Gerontology 2014; 60: 130-7.
13 Asahina A, Umezawa Y, Yanaba K et al. Serum C-reactive protein levels in Japanese patients with psoriasis and psoriatic arthritis:
Long-term differential effects of biologics. J. Dermatol. 2016; 43:
779-84.
14 Takahashi H, Iinuma S, Honma M et al. Increased serum C-reactive
protein level in Japanese patients of psoriasis with cardio- and
cerebrovascular disease. J Dermatol 2014; 41: 981-5.
Figure legends
Fig. 1. Correlation between IgE and TARC in CIE and AD. IgE, immunoglobulin E;
TARC, thymus and activation-regulated chemokine; CIE, chronic idiopathic erythroderma; AD, atopic dermatitis.
Fig. 2. ROC curve of TARC/IgE ratio which distinguishes CIE from AD. Cut-off value of 7.24 provides sensitivity of 80% and specificity of 95%. IgE, immunoglobulin E;
TARC, thymus and activation-regulated chemokine; CIE, chronic idiopathic
erythroderma; AD, atopic dermatitis.
Table 1. Patients’ backgrounds.
CIE, chronic idiopathic erythroderma; AD, atopic dermatitis; PsE, psoriatic erythroderma; DE, drug eruption; SD, standard deviation.
Table 2. Results of blood tests.
CIE AD PsE DE
Mean n Mean n Mean n Mean n
WBC /μl 8600±2800 23 8100±2400 80 9300±3800 37 6700±3100 98
Eosinohphils /μl 1088±926 22 811±637 78 338±687 33 358±525 90
AST IU/l 24.1±5.1 23 24.6±11.2 73 28.1±19.0 37 33.5±31.7 93
ALT IU/l 22.8±10.7 23 26.2±24.1 73 22.8±11.1 37 35.9±44.3 93 LDH IU/l 309.1±82.8 23 286.0±99.1 74 254.4±95.0 37 254.1±120.0 92 CRP mg/dl 0.67±1.11 21 0.71±1.98 56 2.90±5.40 32 2.49±3.87 89 IgE IU/ml 2374±4983 17 10000±14820 82 2009±2039 13 829±1712 19 TARC pg/ml 15888±15344 17 4420±6990 80 9735±16936 6 9222±16275 10