Aging of Large Cities and Medical and Nursing Care Issues:
Estimate of Future Numbers of Doctors and Hospital Beds and Future Facility Capacity Based on Trend Data
Tai Takahashi
Dean, Department of Social Services and Healthcare Management, International University of Health and Welfare
Teppei Watanabe
Chief, R&D Group, Strategy Planning Division, Wellness Co., Ltd.
Ryohei Kato
Representative director, Care Review Inc.
Abstract
The purpose of this study is to grasp the current status of nursing care, particularly in
large cities, by identifying changes in the numbers of doctors and general hospital beds and
the capacity of nursing care facilities in the past 10 years and to forecast future numbers. In
order to look at changes in the numbers of doctors and general hospital beds in each secondary
medical care area in the past 10 years amid the drastic change in the area demarcation
following the major consolidation of municipalities, we recalibrated the data for 2004 in line
with the demarcation of the secondary medical areas in 2014 and calculated the numbers of
doctors and general hospital beds in 2004 and 2014 in each area. In addition, we estimated
the supply of facilities for elderly people in 2025 based on changes in the facility capacity
between 2014 and 2016. At the same time, we estimated an excess or shortage of facilities for
elderly people by region in 2025 by multiplying the estimated number of people aged 75 or
older by the ratio of the capacity of such facilities to the number of people aged 75 or older in
2015 (0.081). As a result, it was found that in the whole of Japan, the number of doctors
increased 15% during the 10 years from 2004 to 2014, while the number of hospital beds
decreased 7%. In large cities, the number of doctors increased remarkably but the number of
hospital beds declined slightly. In the Tokyo metropolitan area and Fukuoka in particular, the
increase in the number of doctors was prominent and the number of doctors per bed also rose
steeply. Concerning facilities for elderly people, the capacity of facilities for elderly people
recorded an increase matching the growth in the number of people aged 75 or older only in
the Tokyo metropolitan area. On the other hand, in other large cities, the increase in the
capacity of facilities for elderly people did not keep pace with the growth in the number of
people aged 75 or older. If the current situation continues, it is highly likely that the capacity
of facilities for elderly people will fall far short of the necessary capacity, resulting in a steep
rise in the number of elderly people with nowhere to go in order to receive nursing care.
Keywords: number of doctors, number of general hospital beds, capacity of facilities for elderly people, time-sequential changes, secondary medical care area, large cities
JEL Classification: I11
I. Introduction
Community Health Care Visions are being formulated nationwide focusing toward 2025.
Community Health Care Visions are attempts to estimate demand for each medical function in a community (a secondary medical care area in principle) in 2025. For example, from determining the number of necessary hospital beds for an area to allocation and coordination of hospital bed functions. Responding to regulatory obligations for prefectures to formulate their Community Health Care Visions, groups of representatives of medical care providers, municipal governments, and academics in the respective areas have begun discussing how they will provide future medical care services based on knowledge about the current status and prospects of future demand obtained from data provided by the central government. This clearly represents significant progress from the time when local governments formulated their medical care plans with little data to compare situations with other areas or data on future estimates.
However, because of lack of “data to show time sequential changes in the quantity of medical care resources in the respective areas” provided by the central government for discussions of Community Health Care Visions, these visions give an impression that they lack a time sequential viewpoint to examine trends specific to their individual areas. For example, suppose that both areas A and B currently have hospital beds totaling 1,000 and are forecasted to require 800 beds in 2025. Area A had 1,200 beds in 2005 and the number decreased by 200 during the past 10 years to the current 1,000. On the other hand, area B had 800 beds in 2005 and the number increased by 200 in the same 10 years to the current 1,000.
In this case, while area A may adopt a policy to continue watching the situation, area B will be expected to take some significant actions to downsize bed numbers so that ruinous competition among medical care institutions can be avoided within the area. However, equipped only with present data along with the estimated future population and without past trend data, which is the case with the current scheme of Community Health Care Visions, it is highly probable that both areas A and B will adopt, more or less, the same kind of policy.
To eliminate such a probability and design local medical care systems for 2025 that are more suited to actual future situations, it is indispensable to identify changes over time in the numbers of doctors and hospital beds in the respective areas.
The issue of the medical and nursing care refugee crisis in Tokyo and the three neighboring
prefectures cautioned by the Metropolitan Area Committee of Japan Policy Council in 2015
also presupposes that without any time sequential data on the number of doctors and the
capacity of medical facilities in the metropolitan region, the supply of medical and nursing
care facilities in the region surrounding the Tokyo metropolitan region will not keep pace with the expected rapid growth in the number of people aged 75 or older. However, if the deployment of doctors in areas surrounding Tokyo, which is faced with a significant shortage in the number of doctors, proceeds at a faster pace than the increase in the number of people aged 75 or older, along with development of medical and nursing care facilities in the Tokyo metropolitan region, then such a crisis will not arise. As seen in this example, it is essential to know whether the numbers of doctors and hospital beds in the area concerned show an upward or downward trend when considering the future supply of medical and nursing care services in the area.
The uneven distribution of doctors and hospital beds in large cities and depopulated areas has long been a major issue for medical care services in Japan and has a history of being discussed in many studies. Kobayashi et al. examined changes in the number of doctors between 1980 and 1990 at the municipal level and showed that the rapid increase in the number of doctors in the whole of Japan had not resolved the prevailing disparities between areas. Toyabe reported that the uneven distribution of doctors had instead been deteriorating since 2004, using data between 1996 and 2006. Sekimoto et al. focused on the 224 secondary medical care areas that did not experience major reconstruction between 1996 and 2010 and classified them into four groups according to quartiles of the total number of doctors per population. The results indicated that disparities among the groups had not been resolved despite an increase over time in the number of doctors per population in all four groups.
Maeda (2015) indicated yearly changes in the number of hospital beds by prefecture, which showed a 7% decrease in the whole of Japan from 2003 to 2013, with most prefectures seeing a decrease in the number of general hospital beds. On the other hand, research focusing on time sequential changes of the increase or decrease in medical and nursing care resources by region is rare, with no materials disclosed so far that show transitions of the numbers in doctors and hospital beds in each secondary medical care area in the country, even though such data is considered essential to discuss Community Health Care Visions. Additionally, no studies have been reported to date that focus on transitions in the capacity of facilities for elderly people at the regional level.
The purposes of this study are (1) to identify changes in the numbers of doctors and
general hospital beds during the past 10 years in each secondary medical care area and (2) to
identify changes in the numbers of doctors and general hospital beds in the past 10 years in
large cities, provincial cities, and depopulated areas, respectively, by sorting changes in the
numbers of doctors and hospital beds from 2004 to 2014 in each secondary medical care area
and retotaling the numbers by types of regions, such as large cities, provincial cities, and
depopulated areas. In addition, the study emphasizes analysis of situations in large cities and
sets another major goal (3) to grasp the current capacity of medical and nursing care services
in large cities by region, and forecast their future situations.
II. Methods
To identify changes in the numbers of doctors and general hospital beds by region, particularly in large cities, we (1) classified medical care areas throughout the country into large city type, provincial city type, and depopulated area type, (2) calculated the numbers of doctors and general hospital beds in each secondary medical care area for 2004 and 2014, and (3) calculated the increase or decrease in the numbers in each area. Based on the results, we calculated the increase or decrease in the numbers of doctors and hospital beds. In addition, to identify changes in the capacities of facilities for elderly people in large cities, we (4) calculated the capacities in large cities in 2015, as well as the rates of the increase or decrease in the capacities from 2014 to 2016. Based on an assumption that the capacities of facilities for elderly people continue changing at the same rates, we calculated estimated capacities of facilities for elderly people in 2025 and analyzed the obtained data.
II-1. Method to classify secondary medical care areas into large city type, provincial city type, and depopulated area type
In accordance with the following definitions based on population and population density, we classified the 344 secondary medical care areas that existed in 2015 into three types: 1) large city type, 2) provincial city type, and 3) depopulated area type.
(Definitions of the types of secondary medical care areas)
Large city type: An area with a “population of 1 million or over” or a “population density of 2,000/km
2or over”
Provincial city type: An area with a “population of 0.2 million or over” or a “population of 0.1-0.2 million and a population density of 200/km
2or over”
Depopulated area type: An area that does not fall into the above two types
Types of the respective medical care areas are indicated in the type columns of Tables 8-1 to 8-13 in the Appendix.
II-2. Method of preparing data on time sequential changes in the numbers of doctors and general hospital beds in each medical care area
There were 369 medical care areas and 2,463 municipalities in 2005, which decreased to
344 and 1,742 by 2015, respectively, marking losses of 25 and 721, respectively, during the
10 years. Since this prevents direct comparison between the medical care areas today and
those 10 years before, we recalibrated the data for 2004 in line with the demarcation of the
secondary medical care areas (municipalities) in 2014, as shown in Figure 1, before comparing
the numbers of doctors and hospital beds in 2004 with the corresponding numbers today
(2014).
To follow the above-mentioned procedure, we did the following:
(1) identified present jurisdictions of the 721 municipalities that were lost in and after 2004 (2) prepared a program to re-sort the numbers of doctors and hospital beds at the municipal and level in 2004 according to the information obtained in step (1) to produce data available for comparison between 2004 and 2014 based on the same demarcations.
The sources of our data on the number of doctors by municipality in 2004 and 2014 are the Surveys of Physicians, Dentists, and Pharmacists (by municipality) conducted in 2004 and 2014, whereas the sources of data on the number of general hospital beds by municipality in 2004 and 2014 are the Surveys of Medical Institutions as of October 1, 2004 and 2014. As for the information on populations, data from the national census in 2005 and the Basic Resident Registration for 2015 were used. The data design and the procedure (1) were conducted by Takahashi while collection of data for 2004 and 2014, preparation of the program mentioned in (2), and preparation of the final data were conducted by Wellness Co.
Ltd.
Figure 1. A schematic illustration: recalibration of municipal demarcation in 2004 in line with that in 2014 for comparison
II3. Analysis of changes in the numbers of doctors and general hospital beds
Based on the abovementioned data, we first calculated changes in the numbers of doctors and general hospital beds in each secondary medical care area and illustrated part of the results with diagrams.
Next, we totaled the numbers (1) at the national level and (2) at the levels of large cities, provincial cities, and depopulated areas, then identified changes in the numbers of doctors and hospital beds during the past 10 years at the national level. Furthermore, we classified secondary medical care areas in large cities into the following four groups based on “levels of the numbers of doctors and hospital beds per population in 2004” and “rates of changes from 2004 to 2014”: 1) areas originally with small numbers of doctors/beds that saw further decrease (areas in a critical situation), 2) areas originally with small numbers of doctors/beds that saw increases (areas with favorable increases), 3) areas originally with large numbers of doctors/beds that saw decreases (areas with favorable decreases), and 4) areas originally with large numbers of doctors/beds that saw further increases (areas expected to make efforts to decrease the numbers).
II4. Method to calculate the current and future capacity of facilities for elderly people
To grasp the current status and forecast future situations regarding the sufficiency of the capacity of facilities for elderly people in large cities, we calculated the capacity of facilities for elderly people in Sapporo, Sendai, Saitama Prefecture, Chiba Prefecture, the 23 Tokyo wards, the Tama region, Aichi Prefecture, Osaka Prefecture, Hiroshima City, and Fukuoka City for 2014, 2015, and 2016, respectively. Although information on individual facilities, which total 190,000 nationwide, is
���������
���������
���������
��������
㻌
㻌
��������㻌 㻌
��������
㻌 㻌
�������������� �������������
㻌
��������
㻌
��������
㻌 㻌
��������
㻌 㻌
��������
㻌 㻌
��������
㻌 㻌
��������
㻌 㻌
Recalibrated��������������� Recalibrated��������������
㻌
��������
㻌
��������
㻌 㻌
�
㻌
��������
㻌 㻌
��������
㻌 㻌
��������
㻌 㻌
�������������
㻌
�������������㻌
������������������ �
����������
㻌
�������was merged into����������������� ����������
㻌
������������������������������������������������������������������������������������������������������
����� �� ���������� ��� ����� ��� ����� ��� ����� �� ���� ����� ��� ��� ������ ����� �� ���� ������� ����� ����� �;� ����
����������������������������������������������������������������
��������������������������������������������������������������������������������������������������������������
���������������������������������������������������������������������������������������������������“the
���������������������n 2004”, and compared this with that of “the area Y in 2014”.�
II-3. Analysis of changes in the numbers of doctors and general hospital beds Based on the above-mentioned data, we first calculated changes in the numbers of doctors and general hospital beds in each secondary medical care area and illustrated part of the results with diagrams.
Next, we totaled the numbers (1) at the national level and (2) at the levels of large cities, provincial cities, and depopulated areas, then identified changes in the numbers of doctors and hospital beds during the past 10 years at the national level. Furthermore, we classified secondary medical care areas in large cities into the following four groups based on “levels of the numbers of doctors and hospital beds per population in 2004” and “rates of changes from 2004 to 2014”: 1) areas originally with small numbers of doctors/beds that saw further decrease (areas in a critical situation), 2) areas originally with small numbers of doctors/beds that saw increases (areas with favorable increases), 3) areas originally with large numbers of doctors/beds that saw decreases (areas with favorable decreases), and 4) areas originally with large numbers of doctors/beds that saw further increases (areas expected to make efforts to decrease the numbers).
II-4. Method to calculate the current and future capacity of facilities for elderly people
To grasp the current status and forecast future situations regarding the sufficiency of the capacity of facilities for elderly people in large cities, we calculated the capacity of facilities for elderly people in Sapporo, Sendai, Saitama Prefecture, Chiba Prefecture, the 23 Tokyo wards, the Tama region, Aichi Prefecture, Osaka Prefecture, Hiroshima City, and Fukuoka City for 2014, 2015, and 2016, respectively. Although information on individual facilities, which total 190,000 nationwide, is provided by respective prefectures in accordance with the Care Services Information Disclosure System, their total capacities by prefecture are not disclosed. In this situation, Care Review Inc. has created an original database by reading and re-sorting the information about all the 190,000 facilities disclosed by prefectures. By courtesy of Care Review Inc., we utilized their data on the capacity of facilities for elderly people in the above-mentioned regions for the years 2014, 2015, and 2016 to create data for analysis. The capacities of facilities for elderly people in this study refer to the total capacities of nursing care insurance facilities and specific facilities.
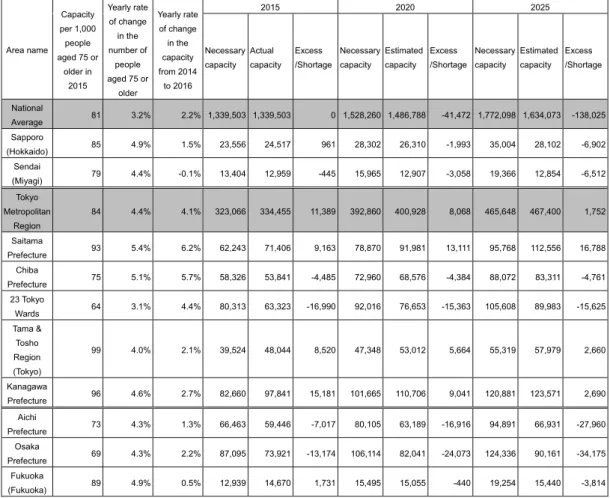
As of 2015, there are 81 nursing care beds per 1,000 people aged 75 or older according to the national average. The term “necessary capacity” in this study refers to the capacity required for each area to provide its people aged 75 or older with facilities for elderly people that equals the national average, which is calculated by multiplying the number of people aged 75 or older in each area in 2015, 2020, and 2025 by 0.081.
The “estimated capacity” in 2020 or 2025 refers to the forecasted capacity of facilities for
elderly people in 2020 or 2025, which is calculated by multiplying the “yearly rate of change”
obtained from the changes in capacity in each area between 2014 and 2016 by 5 (or 10) and adding the obtained value to “the capacity of facilities for elderly people in 2015 in each area.”
The formula for the calculation of the estimated capacity for 2020 is as follows:
(Estimated capacity in 2020)=(Capacity in 2015)+5×((Capacity in 2016-Capacity in 2014)/2).
III. Results
III-1. Changes in the number of doctors
First, we show changes in the total number of doctors (the numbers of hospital doctors + clinic doctors; hereafter referred as the number of doctors) in each area from 2004 to 2014.
III-1-1. Changes in the number of doctors in each secondary medical care area Tables 8-1 to 8-13 in the Appendix show changes in the numbers of doctors and general hospital beds in each of the 344 secondary medical care areas in Japan.
The secondary medical care areas are classified into three types, which are indicated in the column of area names with black for “LC or the large city type,” white for “PC or the provincial city type,” or gray for “DA or the depopulated area type.” In the column showing the rates of changes in the number of doctors, areas that saw an “increase of 30% or over” are marked with black and those that saw a “decrease” are marked with gray. In the same manner, in the column showing the rates of changes in the number of general hospital beds, areas that saw an “increase (0% or more)” are marked with black and those that saw a “decrease of 20%
or over” are marked with gray.
An overview of the tables shows that large city names marked with black often have another black square to indicate an “increase of 30% or over” in the number of doctors while depopulated area names marked with gray often have another gray square to indicate a
“decrease” in the number of doctors. The tables also show that areas with an increasing
number of general hospital beds are more often found in large cities.
III-1-2. Changes in the number of doctors at the national level
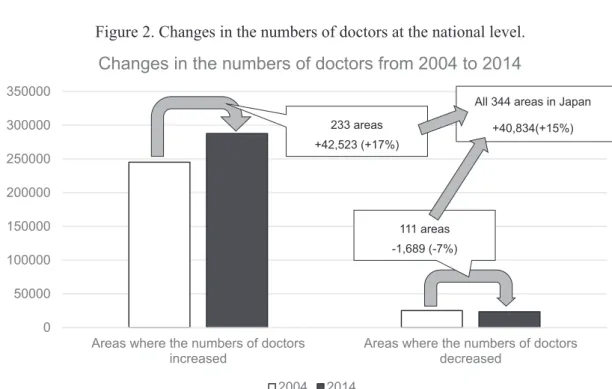
Figure 2 illustrates the outline of changes in the number of doctors from 2004 to 2014 at the national level. Among the 344 secondary medical care areas in Japan, 233 areas saw an increase in the number of doctors. In these areas, doctors increased by 17% or 42,523 in total during the same 10 years. On the other hand, 111 areas saw a decrease in the number of doctors. In these areas, doctors decreased by 7% or 1,689 in total during the same 10 years.
In the whole of Japan, the number of doctors increased by 15% or 40,834 in the same 10 years.
III-1-3. Changes in the number of doctors in large cities, provincial cities, and depopulated areas
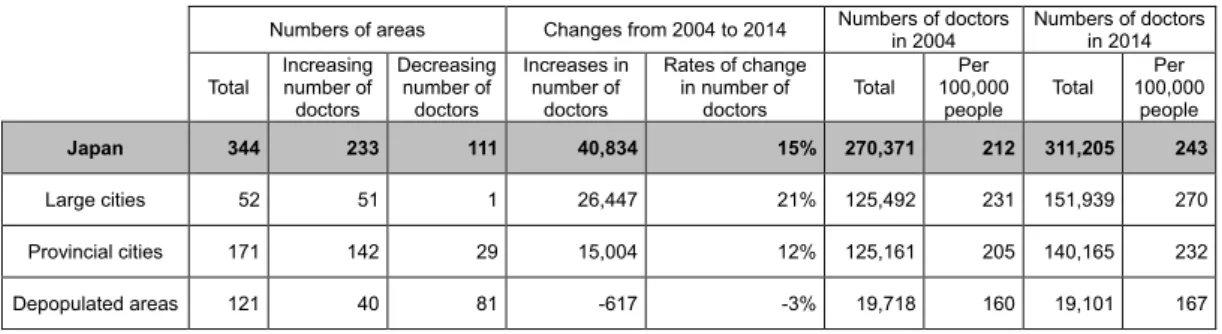
Table 1 shows changes in the number of doctors in large cities, provincial cities, and depopulated areas. In large cities, 51 out of 52 medical care areas saw increases in the number of doctors. Overall, areas in large cities saw a total increase of 21% or 26,447 in the number of doctors from 2004 to 2014. In provincial cities, 142 out of 171 medical care areas saw an increase in the number of doctors. Overall, the areas in provincial cities saw a total increase of 12% or 15,004 in the number of doctors from 2004 to 2014. On the other hand, in depopulated areas, 40 out of 121 medical care areas saw increases in the number of doctors while 81 medical care areas saw a decrease in the number of doctors, which totaled 617 or a 3% decrease overall.
Figure 2. Changes in the numbers of doctors at the national level.
Figure 1
Changes in the numbers of doctors at the national level.
III13. Changes in the number of doctors in large cities, provincial cities, and depopulated areas Table 1 shows changes in the number of doctors in large cities, provincial cities, and depopulated areas. In large cities, 51 out of 52 medical care areas saw increases in the number of doctors. Overall, areas in large cities saw a total increase of 21% or 26,447 in the number of doctors from 2004 to 2014.
In provincial cities, 142 out of 171 medical care areas saw an increase in the number of doctors. Overall, the areas in provincial cities saw a total increase of 12% or 15,004 in the number of doctors from 2004 to 2014. On the other hand, in depopulated areas, 40 out of 121 medical care areas saw increases in the number of doctors while 81 medical care areas saw a decrease in the number of doctors, which totaled 617 or a 3% decrease overall.
As a result, the numbers of doctors per 100,000 people increased in both large cities and provincial cities, the former from 231 in 2004 to 270 in 2014, and the latter from 205 in 2014 to 232 in 2014. On the contrary, in depopulated areas, the number of doctors per 100,000 people decreased from 160 in 2004 to 167 in 2014, indicating an expansion of disparities in medical care services between cities and depopulated areas in the past 10 years.
�
�����
������
������
������
������
������
������
����������������������������������
��������� ����������������������������������
���������
����������������������������������������������������
���� ����
����������
�������������
����������
���������������
�����������������������
��������������
As a result, the numbers of doctors per 100,000 people increased in both large cities and provincial cities, the former from 231 in 2004 to 270 in 2014, and the latter from 205 in 2014 to 232 in 2014. On the contrary, in depopulated areas, the number of doctors per 100,000 people decreased from 160 in 2004 to 167 in 2014, indicating an expansion of disparities in medical care services between cities and depopulated areas in the past 10 years.
III-1-4. Ratios of increase in the number of doctors among regions that saw an increase
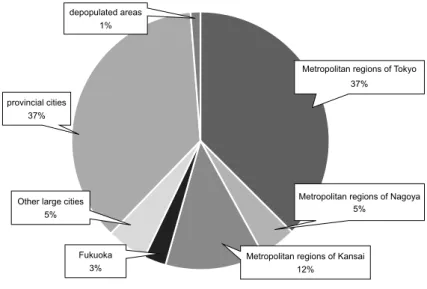
Table 2 and Figure 3 show the increase in numbers of doctors by region and the ratios of such increases among regions where an increase occurred. It is noted that increases in the number of doctors concentrate in the three major metropolitan regions of Tokyo, Nagoya, and Kansai, which together represent 54% of the overall increase in Japan. This concentration swells to 62% when the increases in Fukuoka and other large cities (Sapporo, Sendai, Hiroshima, and Kitakyushu) are also included.
Meanwhile, provincial cities and depopulated areas represent only 37% and 1% of the overall increase in the number of doctors, presenting yet more evidence to show that increases in the number of doctors were concentrated in large cities from 2004 to 2014.
Table 1. Changes in the number of doctors in large cities, provincial cities, and depopulated areas.
� ����������������� �������������������������� �������������������
�������� �������������������
��������
������ �����������
����������
��������
�����������
����������
��������
�������������
����������
��������
����������������
�������������
�������� ������ ����
��������
������� ������ ����
��������
�������
Japan 344 233 111 40,834 15% 270,371 212 311,205 243
������������� ��� ��� �� ������� ���� �������� ���� �������� ����
������������������ ���� ���� ��� ������� ���� �������� ���� �������� ����
������������������ ���� ��� ��� ����� ���� ������� ���� ������� ����
Table 1
Changes in the number of doctors in large cities, provincial cities, and depopulated areas.
III14. Ratios of increase in the number of doctors among regions that saw an increase
Table 2 and Figure 3 show the increase in numbers of doctors by region and the ratios of such increases among regions where an increase occurred. It is noted that increases in the number of doctors concentrate in the three major metropolitan regions of Tokyo, Nagoya, and Kansai, which together represent 54% of the overall increase in Japan. This concentration swells to 62% when the increases in Fukuoka and other large cities (Sapporo, Sendai, Hiroshima, and Kitakyushu) are also included.
Meanwhile, provincial cities and depopulated areas represent only 37% and 1% of the overall increase in the number of doctors, presenting yet more evidence to show that increases in the number of doctors were concentrated in large cities from 2004 to 2014.
������������������������
��������������������������
�����������������������������
������������������������������
������������������
������������������������������ ������� ����
������������������������
�������
������ ���
������������������������������� ������ ����
�������� ������ ���
������������������� ������ ���
������������������ ������� ����
������������������ ���� ���
�
���������������������������
����������������������������� ������� �����
Table 2
The numbers of doctors increased from 2004 to 2014 among the areas that underwent an increase.
Figure 3. The numbers of doctors increased from 2004 to 2014 among the areas that underwent an increase.
Figure 2
The numbers of doctors increased from 2004 to 2014 among the areas that underwent an increase.
III15. Levels of the number of doctors in 2004 × levels of changes in the number in large cities Table 3 is a crosstabulation of levels of the number of doctors in 2004 and levels of changes in the numbers from 2004 to 2014 in large cities.
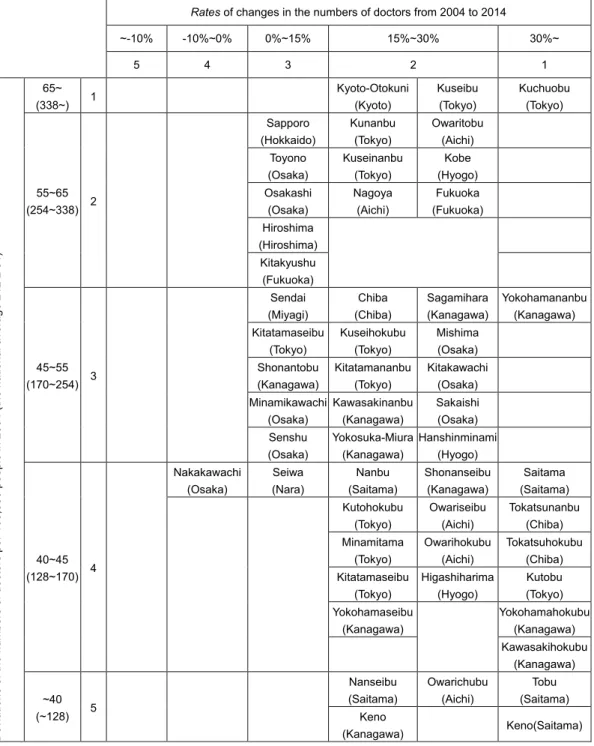
The vertical axis of the table represents levels of deviation of the number of doctors per 100,000 people in 2004 (the national average 212 ± 84). For example, deviation values of 65 and over (338 or more doctors per 100,000 people) are classified as Level 1. The horizontal axis of the table represents levels of changes in the number of doctors from 2004 to 2014. For example, an increase of 30% or over is classified as Level 1 whereas a decrease of 10% or over is classified as Level 5. The medical care areas placed in the upper right sections of the table represent those with higher levels of numbers of doctors in 2004 coupled with higher levels of increases in the number of doctors from 2004 to 2014.
The medical care areas placed in the lower right sections of the table represent those with lower levels of numbers of doctors in 2004 and higher levels of increases from 2004 to 2014, indicating favorable increases in the number of doctors.
Medical care areas in Kuchuobu (Tokyo), Kuseibu (Tokyo), Kunanbu (Tokyo), Kuseinanbu (Tokyo), Nagoya (Aichi), Owaritobu (Aichi), KyotoOtokuni (Kyoto), Kobe (Hyogo), and Fukuoka (Fukuoka) saw increases of 15% or over in the number of doctors despite already higher levels of numbers of doctors per 100,000 in 2004.
On the other hand, areas placed in the lower right part of the table, namely Kutobu (Tokyo),
������������������������������
��
������������������������������
���
�������
��
����� ������������
��
�����������������
���
�����������������
��
������������������������������
����
Table 2. The numbers of doctors increased from 2004 to 2014 among the areas that underwent an increase.
� ����������������� �������������������������� �������������������
�������� �������������������
��������
������ �����������
����������
��������
�����������
����������
��������
�������������
����������
��������
����������������
�������������
�������� ������ ����
��������
������� ������ ����
��������
�������
Japan 344 233 111 40,834 15% 270,371 212 311,205 243
������������� ��� ��� �� ������� ���� �������� ���� �������� ����
������������������ ���� ���� ��� ������� ���� �������� ���� �������� ����
������������������ ���� ��� ��� ����� ���� ������� ���� ������� ����
Table 1
Changes in the number of doctors in large cities, provincial cities, and depopulated areas.
III14. Ratios of increase in the number of doctors among regions that saw an increase
Table 2 and Figure 3 show the increase in numbers of doctors by region and the ratios of such increases among regions where an increase occurred. It is noted that increases in the number of doctors concentrate in the three major metropolitan regions of Tokyo, Nagoya, and Kansai, which together represent 54% of the overall increase in Japan. This concentration swells to 62% when the increases in Fukuoka and other large cities (Sapporo, Sendai, Hiroshima, and Kitakyushu) are also included.
Meanwhile, provincial cities and depopulated areas represent only 37% and 1% of the overall increase in the number of doctors, presenting yet more evidence to show that increases in the number of doctors were concentrated in large cities from 2004 to 2014.
������������������������
��������������������������
�����������������������������
������������������������������
������������������
������������������������������ ������� ����
������������������������
�������
������ ���
������������������������������� ������ ����
�������� ������ ���
������������������� ������ ���
������������������ ������� ����
������������������ ���� ���
�
���������������������������
����������������������������� ������� �����
Table 2
The numbers of doctors increased from 2004 to 2014 among the areas that underwent an increase.
186 T Takahashi, T Watanabe, R Kato / Public Policy Review
III-1-5. Levels of the number of doctors in 2004×levels of changes in the number in large cities
Table 3 is a cross-tabulation of levels of the number of doctors in 2004 and levels of changes in the numbers from 2004 to 2014 in large cities.
The vertical axis of the table represents levels of deviation of the number of doctors per 100,000 people in 2004 (the national average 212±84). For example, deviation values of 65 and over (338 or more doctors per 100,000 people) are classified as Level 1. The horizontal axis of the table represents levels of changes in the number of doctors from 2004 to 2014. For example, an increase of 30% or over is classified as Level 1 whereas a decrease of 10% or over is classified as Level 5. The medical care areas placed in the upper right sections of the table represent those with higher levels of numbers of doctors in 2004 coupled with higher levels of increases in the number of doctors from 2004 to 2014. The medical care areas placed in the lower right sections of the table represent those with lower levels of numbers of doctors in 2004 and higher levels of increases from 2004 to 2014, indicating favorable increases in the number of doctors.
Medical care areas in Kuchuobu (Tokyo), Kuseibu (Tokyo), Kunanbu (Tokyo), Kuseinanbu (Tokyo), Nagoya (Aichi), Owaritobu (Aichi), Kyoto-Otokuni (Kyoto), Kobe (Hyogo), and Fukuoka (Fukuoka) saw increases of 15% or over in the number of doctors despite already higher levels of numbers of doctors per 100,000 in 2004.
On the other hand, areas placed in the lower right part of the table, namely Kutobu (Tokyo), Tokatsunanbu (Chiba), and Tokatsuhokubu (Chiba), Tobu (Saitama), Saitama (Saitama), Keno (Saitama), as well as Kawasakihokubu (Kanagawa) and Yokohamahokubu (Kanagawa), saw rapid increases in the numbers of doctors between 2004 and 2014 from lower levels of numbers of doctors in 2004.
The only medical care area in large cities that saw decreases in the numbers of doctors
from 2004 to 2014 was Nakakawachi (Osaka); all the other 51 medical care areas saw an
increase in the number of doctors in the same period.
Table 3. A cross-tabulation of levels of doctor numbers (deviations) in 2004 and levels of changes in the numbers (rates of changes) from 2004 to 2014 in large cities.
� Rates��������������������������������������������������������
������ �������� ������� �������� �����
�� �� �� �� ��
Deviations��������������������������������������������������������������������������������������
����
������� �� � � � ��������������
��������
��������
��������
���������
��������
������
���������� �� � �
��������
�����������
��������
��������
����������
�������� �
�������
��������
�����������
��������
�����
�������� �
���������
��������
�������
��������
��������
���������� �
����������
������������
�
�
�����������
���������� �
������
���������� �� � �
�������
���������
������
��������
�����������
�����������
��������������
�����������
��������������
��������
������������
��������
��������
�������� �
�����������
�����������
��������������
��������
������������
�������� �
��������������
��������
��������������
�����������
���������
�������� �
�������
��������
���������������
�����������
��������������
�������� �
������
���������� �� �
������������
��������
������
�������
������
����������
������������
�����������
��������
����������
� �
�����������
��������
�����������
��������
�������������
��������
�����������
��������
������������
��������
��������������
��������
��������������
��������
��������������
��������
�������
��������
��������������
�����������
� ���������������
�����������
� ���������������
�����������
����
������� �� � � �
���������
����������
�����������
��������
�����
����������
�����
�����������
� ��������������
Table 3
A crosstabulation of levels of doctor numbers (deviations) in 2004 and levels of changes in the numbers (rates of changes) from 2004 to 2014 in large cities.
III2. Changes in the number of general hospital beds
Next, we will show changes in the number of general hospital beds in each area from 2004 to
2014.
III-2. Changes in the number of general hospital beds
Next, we will show changes in the number of general hospital beds in each area from 2004 to 2014.
III-2-1. Changes in the number of general hospital beds in each secondary medical care area
The right sides of Tables 8-1 to 8-13 in the Appendix show changes in the number of general hospital beds in each of the 344 secondary medical care areas throughout the country.
III-2-2. Changes in the number of general hospital beds at the national level
Figure 4 illustrates the outline of changes in the number of general hospital beds from 2004 to 2014 at the national level. Among the 344 secondary medical care areas in the country, 294 areas saw a decrease in the number of general hospital beds for a total of 83,032 or 9% during the 10 years. On the other hand, 50 areas saw an increase in the number of general hospital beds for a total of 9,381 or 5% during the 10 years.
In the whole of Japan, the number of general hospital beds decreased by 7% or 73,651 in the same 10 years.
Figure 4. Changes in the numbers of general hospital beds at the national level.
Figure 3
Changes in the numbers of general hospital beds at the national level.
III23. Changes in the number of general hospital beds in large cities, provincial cities, and depopulated areas
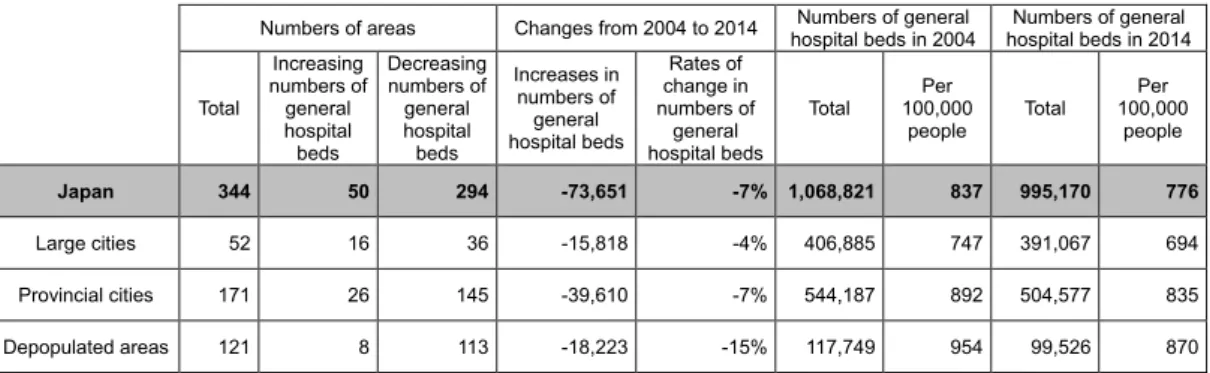
Table 4 shows changes in the number of general hospital beds in large cities, provincial cities, and depopulated areas. In large cities, 36 out of 52 medical care areas saw a decrease in the number of general hospital beds. Overall, the areas in large cities saw a total decrease of 4% or 15,818 in the number of general hospital beds from 2004 to 2014. In provincial cities, 145 out of 171 medical care areas saw a decrease in the number of general hospital beds. Overall, the areas in provincial cities saw a total decrease of 7% or 39,610 in the number of general hospital beds from 2004 to 2014. In depopulated areas, 113 out of 121 medical care areas saw a decrease in the number of general hospital beds, which totaled 18,223 or a 15% decrease overall.
As a result, the numbers of general hospital beds per 100,000 people decreased from 747 in 2004 to 694 in 2014 in large cities, from 892 in 2004 to 835 in 2014 in provincial cities, and 954 in 2004 to 870 in 2014 in depopulated areas. Among medical care areas of all the three types, depopulated areas saw the most rapid decrease.
�
������
������
������
������
������
������
������
������
������
�������
����������������������������������������
�������������� �������������������������������������������
��������������
������������������������������������������������
������������������
���� ����
���������
�������������
����������
��������������
�����������������������
�������������
III-2-3. Changes in the number of general hospital beds in large cities, provincial cities, and depopulated areas
Table 4 shows changes in the number of general hospital beds in large cities, provincial cities, and depopulated areas. In large cities, 36 out of 52 medical care areas saw a decrease in the number of general hospital beds. Overall, the areas in large cities saw a total decrease of 4% or 15,818 in the number of general hospital beds from 2004 to 2014. In provincial cities, 145 out of 171 medical care areas saw a decrease in the number of general hospital beds. Overall, the areas in provincial cities saw a total decrease of 7% or 39,610 in the number of general hospital beds from 2004 to 2014. In depopulated areas, 113 out of 121 medical care areas saw a decrease in the number of general hospital beds, which totaled 18,223 or a 15% decrease overall.
As a result, the numbers of general hospital beds per 100,000 people decreased from 747 in 2004 to 694 in 2014 in large cities, from 892 in 2004 to 835 in 2014 in provincial cities, and 954 in 2004 to 870 in 2014 in depopulated areas. Among medical care areas of all the three types, depopulated areas saw the most rapid decrease.
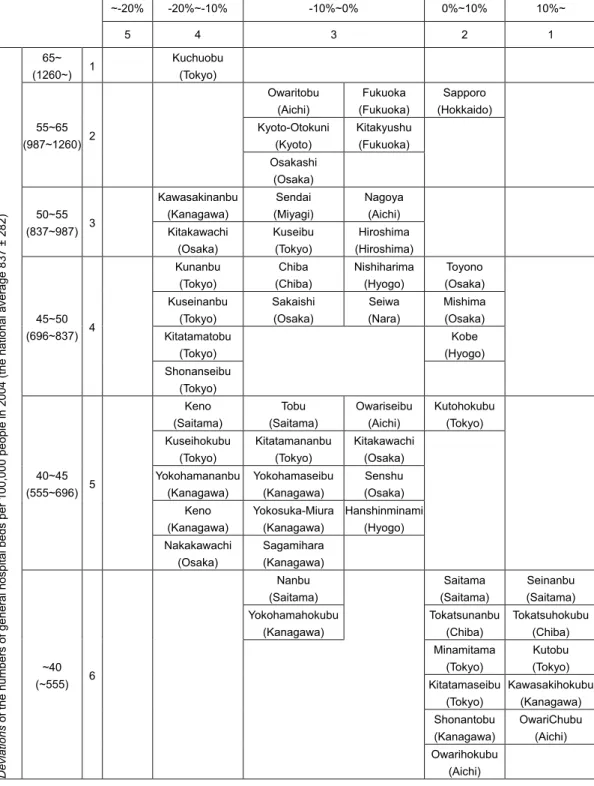
III-2-4. Levels of the number of general hospital beds in 2004 × levels of changes in the number in large cities
Table 5 is a cross-tabulation of levels of the number of general hospital beds in 2004 and levels of changes in the number of general hospital beds from 2004 to 2014 in large cities.
The Sapporo area saw an increase in the number of hospital beds despite its already higher level of bed numbers per 100,000 people in 2004.
On the other hand, areas placed in the lower right part of the table, namely areas that include Kutobu (Tokyo), Tokatsunanbu (Chiba), Tokatsuhokubu (Chiba), Saitama (Saitama) and Nanseibu (Saitama), as well as areas that include Kitatamaseibu (Tokyo), Minamitama (Tokyo), and Kawasakihokubu (Kanagawa), in addition to areas including Shonantobu
Table 4. Changes in the number of general hospital beds in large cities, provincial cities, and depopulated areas.
� ����������������� �������������������������� �������������������
���������������������� �������������������
����������������������
������
�����������
�����������
��������
���������
�����
�����������
�����������
��������
���������
�����
�������������
�����������
��������
��������������
���������
����������
�����������
��������
��������������
������ ����
��������
������� ������ ����
��������
�������
Japan 344 50 294 73,651 7% 1,068,821 837 995,170 776
������������� ��� ��� ��� �������� ���� �������� ���� �������� ����
������������������ ���� ��� ���� �������� ���� �������� ���� �������� ����
������������������ ���� �� ���� �������� ����� �������� ���� ������� ����
Table 4
Changes in the number of general hospital beds in large cities, provincial cities, and depopulated areas.
III24. Levels of the number of general hospital beds in 2004 × levels of changes in the number in large cities
Table 5 is a crosstabulation of levels of the number of general hospital beds in 2004 and levels of changes in the number of general hospital beds from 2004 to 2014 in large cities.
The Sapporo area saw an increase in the number of hospital beds despite its already higher level of bed numbers per 100,000 people in 2004.
On the other hand, areas placed in the lower right part of the table, namely areas that include Kutobu (Tokyo), Tokatsunanbu (Chiba), Tokatsuhokubu (Chiba), Saitama (Saitama) and Nanseibu (Saitama), as well as areas that include Kitatamaseibu (Tokyo), Minamitama (Tokyo), and Kawasakihokubu (Kanagawa), in addition to areas including Shonantobu (Kanagawa), Owarichubu (Aichi), and Owarihokubu (Aichi), saw an increase in the number of general hospital beds between 2004 and 2014 from lower levels of bed numbers in 2004.
Kuchuobu (Tokyo) placed in the upper left of the Table 5 saw an increase in population by 22%
from 2004 to 2014 while the number of beds totaling 14,619 (deviation value 96) in 2004 decreased 12% to 12,929 (deviation value 80) toward 2014. However, hospital bed numbers in the area remain very high. Other areas with high levels of hospital bed numbers in 2004, namely Owaritobu (Aichi), Kyotootokuni (Kyoto), Osakashi (Osaka) Kitakyushu (Fukuoka), and Fukuoka (Fukuoka), are also seeing a decrease in the number of general hospital beds.
On the other hand, medical care areas with general hospital bed numbers of Level 5, namely Keno (Saitama), Kuhokuseibu (Tokyo), Yokohamananbu (Kanagawa), Keno (Kanagawa), and Nakakawachi (Osaka), saw a decrease of bed numbers by 1020% from 2004 to 2014. Areas with general hospital bed numbers of Level 6, namely Nanbu (Saitama) and Yokohamahokubu (Kanagawa), are also seeing a decrease in the number of hospital beds.
Table 5. A cross-tabulation of levels of general hospital bed numbers (deviations) in 2004 and levels of changes in the numbers (rates of changes) from 2004 to 2014 in large cities.
� ���������������������������������������������������������������������������
������ ���������� �������� ������� �����
�� �� �� �� ��
Deviations�����������������������������������������������������������������������������������������������������
����
�������� �� � ���������
�������� � � �
������
������������� � �
����������
��������
��������
����������
��������
�����������
�
��������������
��������
�����������
����������
�
���������
��������
�
������
���������� �� �
��������������
�����������
�������
���������
�������
��������
� �
������������
��������
��������
��������
����������
������������
������
���������� �� �
��������
��������
������
��������
������������
��������
�������
��������
�
�����������
��������
���������
��������
������
�������
��������
��������
�������������
��������
�
�����
��������
������������
��������
�
������
���������� �� �
�����
����������
�����
����������
�����������
��������
�����������
��������
�
������������
��������
��������������
��������
������������
��������
�
��������������
�����������
��������������
�����������
�������
��������
�����
�����������
���������������
�����������
��������������
��������
������������
��������
�����������
�����������
�
����
������� �� � �
������
����������
� ��������
����������
���������
����������
���������������
�����������
�������������
��������
��������������
��������
�
�����������
��������
�������
��������
��������������
��������
���������������
�����������
�����������
�����������
�����������
��������
������������
��������
�