The Detection and Grading of the Fatty Liver Based on Histogram Analysis of Ultrasonographic Image and
Considering Body Measurements and Laboratory Data
Kouki M ASUO
1), Hitoshi F UNAGI
2)and Kunihiko K AWAI
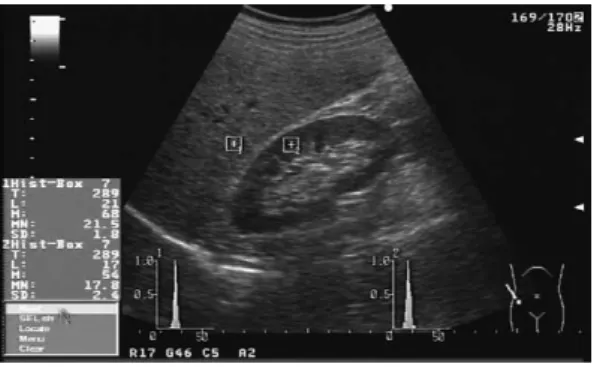
2)Abstract : This study aimed to establish quantitative diagnosis and grading of the fatty liver using histogram analysis of ultrasonographic image, body measurements (body mass index, body fat percentage) and laboratory data.
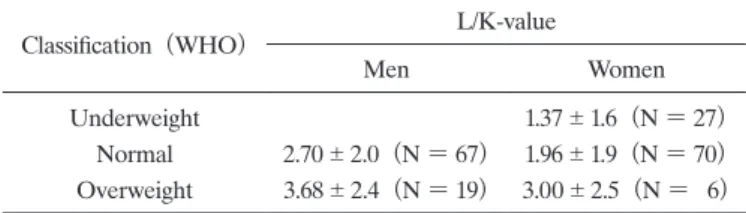
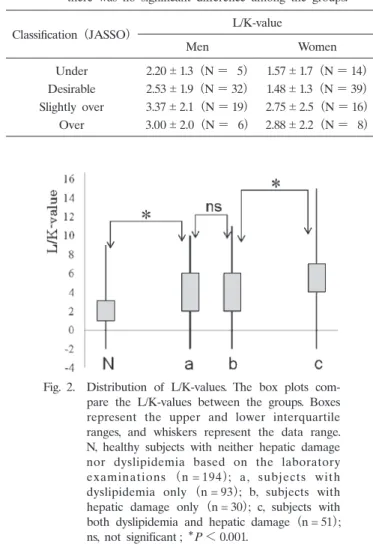
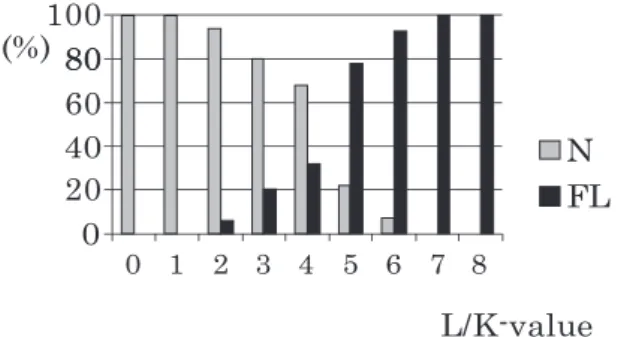
A total of 373 subjects (212 men ; age, 46.1 8.7 years and 161 women ; age, 45.6 7.5 years) who underwent a health check service were enrolled in this study. The relationship between body measurements, laboratory data and the L-value (the most frequent gradient resulting from the histogram analysis of the ultrasonographic image) was assessed. About 70% of subjects were healthy at L/K-value (the difference of the L-value between the liver and the right renal cortex)≤ 3 and about 50% at L/K-value = 4. Healthy subjects were dominant at L/K-values up to 4-5. Less than 30% of subjects were healthy at a L/K-value of 5. More than 50% of subjects with a L/K value of 7 suffered from both liver damage and dyslipidemia and less than 5% of subjects with L/K-value ≥ 8 were healthy. Body mass index and body fat percentage had little effect on these results unless the subjects were excessively obese or thin.
Based on the evaluation above, we propose the L/K value criteria for detect- ing and grading of the fatty liver as follows : Normal, ≤ 3 ; borderline, = 4 ; mild fatty liver, 5-6 ; moderate fatty liver, 7-8 ; severe fatty liver, ≥ 9 or when histogram analysis fails to evaluate the liver/kidney contrast due to strong attenuation of echogenicity, such as “bright liver”. There was good agreement between these criteria and the subjective opinion of the operator during actual ultrasound fatty liver diagnosis. The histogram index could provide operator- independent quantitative diagnosis and grading of the fatty liver, which may serve as an efficient tool for diagnosis and follow up of patients.
Key words : fatty liver, diagnosis and grading, ultrasonography, histogram analysis
1)
Department of Surgery, Showa University Toyosu Hospital, 4—1-18 Toyosu, Koto-ku, Tokyo 135—8577, Japan.
2)