Vol. 19, No. 2 (1968)
MICROMETEOROLOGICAL CONDITION O F THE
SHALL0 W-MARINE FACILITIES
FOR PISCICULTURE
I1
Energy Balance Approach to the Rising of Water
Temper at ure
inAdoike Fish Farm
Masaki UEHARA,
Matsuji MATSUDA
and Takayuki
KONO
Introduction
T h e maintenance of cultivating fishes has long been depended on water temperature in midsummer. Evidence has been accumulated shows that even in more favourd farm, the water temperature above 29°C causes serious limitation in the yields. T h e results of recent investigations show this to be true for Adoike fish farm('). So that, there is a clear need to aquire reliable information relative to the physical aspects of water temperature rising of the facility.
Energy may be supplied to the sea-water both by radiation and by the heat accompanied by sea-water exchange through the gates. These physical aspects are conveniently subdivided into (a) the vertical energy balance, (b) the horizontal energy balance and (c) their interactions. T h e latest is of special interest in this paper.
Methods
The site and apparatuses employed in this study were identical with those described previously('), and only a brief outline needs to be given here.
The measurements were made on Adoike facility facing Hiketa Bay on the eastern coast of Kagawa Prefecture during a spell of fairly fine weather in August 1965 Incoming and reflected short-wave radiations were measured with Noshi-Denshi solarimeters elevated to 1 0 0 cm above the water surface and net radiation was measured with the C.S.I.R.O. miniature net radiometer. T h e thermojunctions made of copper/constantan wire (0.2 mm in diameter) were employed to measure air and water temperature profiles and absolute humidity. All these apparatuses were mounted on a wooden float fixed to a distance of about 35 m from the stone bank and their outputs were fed to multi-point potentiometer giving continuous records. A mercury thermometer with the minimum measure of 0.1"C was employed to measure the temperature of sea-water running through the southern gate and the water level of the facility was measured with the fixed staff near the bank.
Results and Discussions
(1) Horizontal energy balance
The heat energy accompanied by sea-water exchange gives much influence to the fluctua. tions of water temperature of' the facility. Therefore, the water exchange is of fundamental
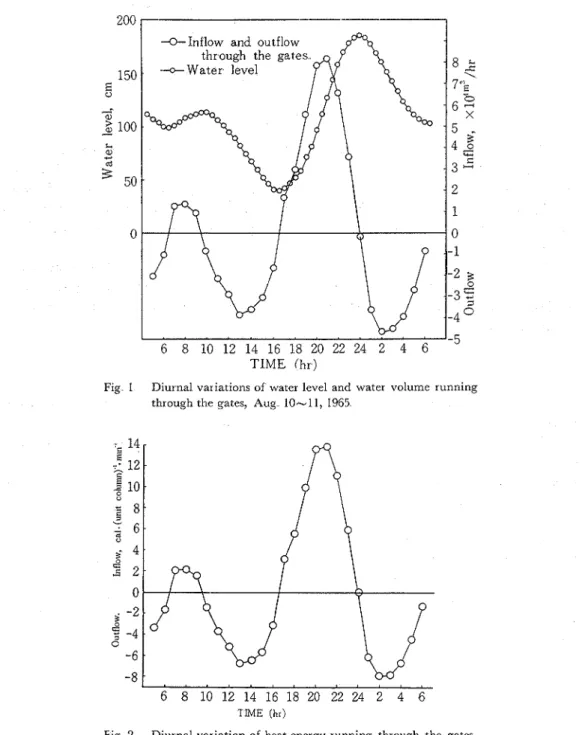
148 Tech Bull Fac Agr Kagawa Univ importance to the cultivation. T h e hourly water volume running through gates is shown in Fig. 1 together with the tidal curve. T h e maximum water volume flowing into and out of the facility reached 82
x
l o 3 m3 and 46x
l o 3 m3 per hour respectively and the corresponding heat flows were 2 1x
10'' and 1 2 X 10" cal per hour. T o examine the diurnal variation of this heat energy in more detail, the change of the heatB G ~
stored in the unit water columnTIME ( h r )
Fig 1 Diurnal variations of water level and water volume running through the gates, Aug 10-11, 1965
Fig 2 Diurnal variation of heat energy running through the gates, Aug 10-11, 1965.
Vol 19, Yo 2 (1968) 149 for unit time was calculated by the following equation
where cp is the thermal capacity of sea-water or cp=0.963, VG the water volume running through the gates for At-minutes,
TG
the mean temperature of sea-water running through the southern gate for At-minutes and A the sea-water area of the facility. It is to be easily seen from Fig. 2 that the water flow through the gates bore more heat energy to and away from the facility than the other factors including the absorption of solar radiation by sea-water (about 0.84 c a l . ~ m - ~ min-I for maximum absorption which will be given later in more detail). The feature of diurnal variation ofB G ~
is approximately equal to that of water volume as illustrated in Figs. 1 and 2, and its maximum value came up to 1 4 cal (unit water column)-' min-l. Indeed, the heat energy accompanied by sea-water exchange is very large but all the energy toward the facility does not necessarily exert much influence to the sea-water tern. perature of the facility. Because the difference of sea-water temperature between in- and o u t side of the facility does not exceed 6.0°C. From the standpoint of cultivating fishes, the water temperature itself is more important than the heat energy calculated by Eq. (1). Then, the heat flow which affects the water temperature of the facility may be given in the form expressing how many calories are to be required for that the incoming sea-water becomes6
8
10 12 14 16 18 20 22 24 2 4
6
TIME
(hr)
1 50 Tech Bull. Fac. Agr. Kagawa Univ. the temperature of' sea-water surface of' the facility..
where
BG2
is tentatively named "Absorption deficit", Ts the temperature of sea-water surface of the facility. If the heatBGZ
is greater than the heat Bw absorbed by sea-water, so thatBG2> B w , the sea.water temperature of the facility will not rise above T s by the water ex- change. If the reverse holds
(BG2>
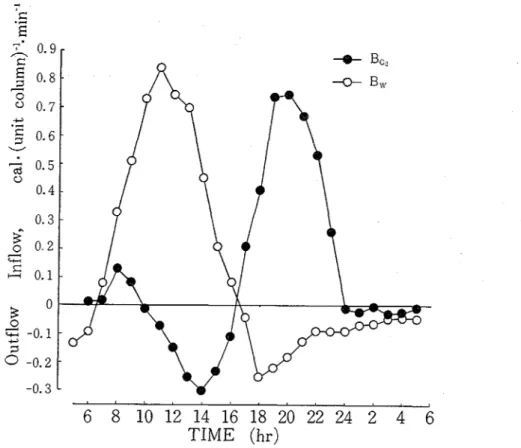
BW), the temperature rising will be maintained even the water flow is toward the facility. The result calculated by the equation (2) is shown graphi- cally in Fig. 3. The features of diurnal variation of BG2 andBw
were identical and the former was chiefly commanded by sea-water exchange. T h e maximum value of 0.75 cal* (unit c ~ l u m n ) - ~ . m i n - ~ for the absorption deficitB G ~
was similar to the value of Bw calculated by the vertical energy balance equation which will be given later in more detail. I t is, then, of interest to inquire whether Bw is to be well compensated byB G ~
or not. The interaction between them are presented in later section,(2) Vertzcal energy balance
1) Radiation balance
In many problems of surface-heat balance, an important meteorological variable is the solar radiation, which is the source of energy to the physical phenomena near the surface. Therefore, radiation balance must be examined for sea-water for the benefit of aquiring the reliable imformation relative to the physical aspects of water temperature rising. The radiation balance for sea-water may be put in the form
and
where
R,
is the net radiation for all wave-length, S the incoming short-wave radiation from sun and sky,a
the rcflection coefficient for short-wave radiation, L the net incoming long-wave radiation,Ld the downward long-wave radiation from the atmosphere,
L,
the upward long- wave radiation from the surface = E6T4+(l
- E )Ld and E the long-wave emissivity ofsurface. T h e unit of radiation is gr.cal.cm-2 per minite
T h e diurnal variation in radiation components on a cloudless day (Aug. 10, 1965) is shown in Fig. 4(a) where
R,,
S andas
are all measured quantities. T h e diurnal variation in the net long-wave termL
was calculated by difference from equation (3). T h e total short-wave radiation for the daytime was 564 c a l . ~ m - ~ . d a ~ - ' and the loss by short-wave reflection in the same period was 37 c a ~ - c m - ~ - d a ~ - l . Therefore, the reflection coefficient based on the total short-wave radiation was about 0.066 which is relatively smaller than that for vegetable covers including fully developed rice plant and wheat(3). Its diurnal variation was small and almost independent of solar elevation differing from that reported for vegetable cover and bare soil(4). Since the reflection coefficient indicates the optical characteristics of the surface, the above unexpected feature may be explained by the fact that the moderate west wind, not exceed 3 m/sec, was prevailed on the day and the surface of the faclity was ripplcdVol. 19, No Zi(1968)
4 6 8 10 12 14 16 18 20 22 24 2 4 6 TIME (hr)
(a) Cloudless day iAug. 10)
1 6 8 10 12 14 16 18 20 22 24 2 4 6 TIME ( h r )
b) Cloudy dav 1 4ug ! 1 j
t ig 4 Diurnal variation of radiation balance components over experimental site, 1965
throughout the daytime. On the other hand, the reflection coefficient on a cloudy d a y (Aug. 11, 1965) was 0.045 based on the total short-wave radiation. Figs. 4(a) and (b) serve to illustrate the discrepancy of reflection coefficients both on cloudless and cloudy days. This discrepancy may also result from the state of sea-water surface characterized by the wind.
T h e long-wave loss on clear day increased from 0.08 ~ a l . c r n - ~ * n i n - ~ beforc dawn to 0.23 cal-cm-2.min-1 a t noon when maximum solar radiation was 1.27 ~al.cm-~.rnin-l and then decreased to 0.03 cal.~m-~.min-' in the next morning. At mid-day, the heat loss by long-wave exchange was about 3.8 times of its nocturnal value and 3.7 times of the contem- porary loss by short-wave reflection.
On the cloudy day, the longwave variation was rather flat and its value for the mid-day hours was slightly smaller than that for the night. This may illustrate an important depend-
Tech Bull Fac Agr Kagawa Univ.
4 6 8 10 12 14 16 18 20 22 24 2 4 6
TIME
(hr )( a \ Cloudless day (Aug- 10)
L *
L 4 6 8 10 12 14 16 18 20 22 24 2 4 6
TIME ( h r ) (b) Cloudy day, (Aug. 11)
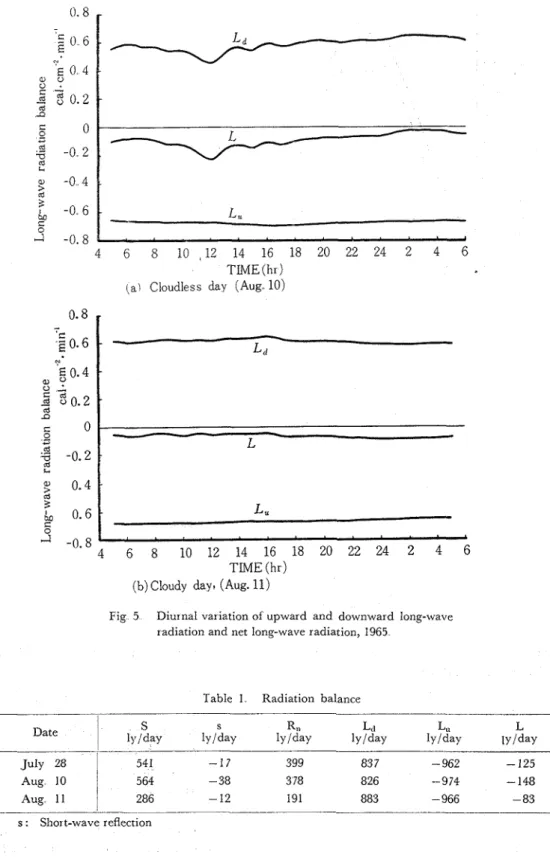
Fig 5 Diurnal variation of upward and downward long-wave radiation and net long-wave radiation, 1965
Table 1 Radiation balance
-
Date S s Rn 4 L u L
ly /day IY /day ly/day lylday IY /day
-
July 28 541 - 17 399 83 7 - 962 - 125
Aug 10
1
564 - 38 3 78 826 -974 - 148Aug 11
1
286 - 12 191 883 - 966 - 83Vol. 19, No. 2 (1968) 153
ence of long-wave exchange on surface temperature and cloud condition. T o exmine the diurnal variation in long-wave exchange in more detail, the hourly radiation balance was calculated for 2 days. Assuming the water surface to be black body, the outgoing radiation
L,
is expressed in the fromwhere 6 is the STEFAN-BOLZMAN constant and
T s
the absolute temperature of' water surfice. Incoming long-wave radiationLd was then calculated by combining Eqs.
(4) and ( 5 ) to giveA somewhat surprising feature is readily seen fiom Fig. 5 i.e., the daily long-wave radiation to the surface was much greater than the short-wave radiation and this held true for the outgoing radiative components. The diurnal variation of incoming long-wave radiation was fairly fluctuated due to variability in the atmospheric condition and the outgoing long- wave radiation was relatively constant throughout the days owing to the high specific heat of' water.
The final result of daily radiation balance is shown in Table 1.
The relationship between solar and net radiation is known to be given by the following regression formula(5).
where k and 6 are constant. These values in our case are as follows: k 0.991-0.89 and
E
-
0.096--
0.056.2) Energy balance
The vertical energy balance at the surface of the sea water, neglecting minor quantities, may be put in the form
expressing the fact that the net radiative flux R, is divided into three componets, namely, heat flux to the water
Bw,
sensible heat flux per unit area to the air in the turbulent stateF
and heat flux1E
arising from evaporation or condensation of' water at the surface. Assuming the continuity of the sensible and the latent heat fluxes,F
andZE
in the equation ( 8 ) may be expressed in the formsF=
h(0, - 0,)lE=
k(e(8,)- e,)where
h
is the sensible heat transf'er coefficient,k
the latent heat transf'er coefficient, 0 , the water temperature, 0 , the air temperature, e(0,) the satur.ation vapour pressure corresponding to water temperature and e , the vapour pressure in air layer.154 Tech.. Bull. Fac. 4gr.. Kagawa Univ.
TIME ( h r ) (a) cloudless day
(Aug. 10)
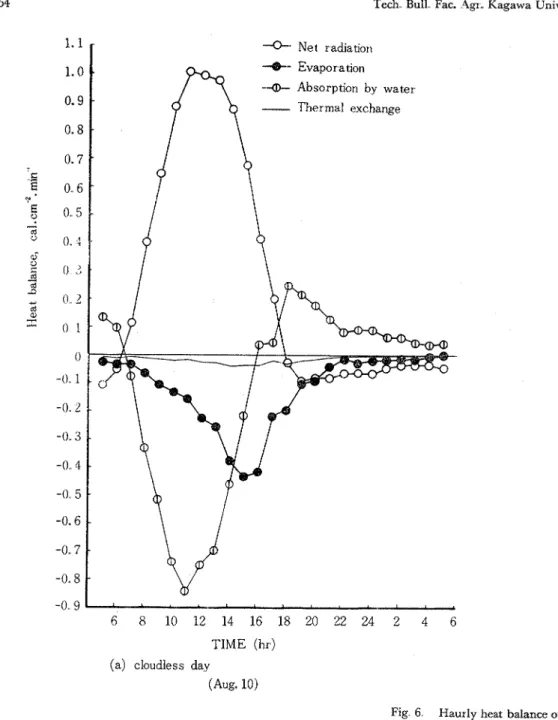
Fig 6 Haurly heat balance of
pressure corresponding to 8, is approximated by following equation :
de where e(0,) is the saturation vapour pressure at the air temperature O,, and
Vol 19, No 2 (1968)
ing the relations expressed by Eqs. (9) and (10) into Eq. (8), it follows that
and the third term on the left represents
ZE which was measured directly with the evaporat-
ing pan giving continuous record developed by UEHARA@). Then the latent heat transfercoefficient is obtained from the following relation:
and the sensible heat transfer coefficient is given by the following well-known simple relation
'r 0.. 6
+
Net radiation f -0- Evaporation " 0..55
-0- Absorption by water. 7 0 . 4g
0..3 1 cd 0.2 A 2 48
0.1 3C 0 - 0 . 1 -0.. 2 -0.. 3 -. 0.. 4 6 8 10 12 14 16 18 20 22 24 2 4 6 TIME (hr) ( b ) Cloudy day iAug 11)Adoike fish farm, 1965
assuming that the air layer is in turbulent state. The conductivity in this layer is large in comparison with the molecular heat coductivity of' air and the eddy diffusivity of' water vapour is equal to that of' the heat
156 Tech Bull Fac Agr Kagawa Univ calculated, and the heat energy absorbed by sea-water
Bw was determined as the remainder.
A typical energy balance of the facility on a fine day is illustrated by Fig. 6(a) Both sensible and latent heat fluxes were away from the surface all the day and these may be explained by the fact that the water temperature wes always higher than that of the air. T h e evaporation started to increase rather slowly at sunrise and reached a maximum rate (0.431 gr.cal.cm-2.min-1) in the late afternoon and then decreased promptly, continuing until after sunset to the next morning.T h e area between absissa and evaporation curve in Fig. 6(a) gives the total amount of energy that has gone into evaporation which in this case was 3.07 mm for the 24-hour period. During the same periods, a evaporation pan installed in Takamatsu Local Meteorological Observatory lost 5.20 mm. It will be seen that the surface of the sea-water lost an amount of water at least as great as a half of the evaporation from a free water surface of the pan and this is to be converted into the equivalent heat of 4 7 percent of the net radiation, i.e.,
On the contrary, the diurnal variation of sensible heat flux was flat through the day and it's total amount for 24-hour period was only a small fraction of net radiation, constituting about 7 percent of the net radiation:
The heat flux to the sea.water began to rise abruptly to a distinct peak a t 11 : 0 0 then rapidly fell off in the evening and the direction of the flux was turned to inverse during the night. The daytime flux was unexpectedly high and it's maximum rate was 0.84 cal-cm-'. min-I which is equivalent to the 83 percent of the net radiation (1.01 ~al.cm-~.min-') just at the same time The total energy available for warming sea-water for the 24-hour period may constitute about 46 percent of the total net radiation, i e.,
Restricting to the daytime when the R, is high, the heat flux to the water came up to 280 cal per unit water column, Provided the 70 percent of this energy is absorbed by the upper water layer of 100 cm depth, it follows that the temperaure of this layer is to be risen as far as 2°C.
(3) Interactzon between horzzontal and vertzcal energy balance
The facility has often experienced too high water temperature for cultivation in mid. summer. This phenomenon has long been considered to arise from poor exchange of sea- water, since the farm belongs to the facility of tidal range typec7) in which the water volume supplied or drained through the gates depends only on a tidal range with the consequence that the exchange rate of the sea-water is very small. But considering from the diurnal variation of both BG2 and Bw shown in Fig 3, the former has the ability to compensate well enough the latter if the peaks of these two curves are strictly overlapped. These two peaks, how- ever, are not always overlapped everyday, because the periods of these two variables differ from one another. For instance, the cursory inspection of Fig. 3 demonstrates that Bw-curve
Vol. 19, No. 2 (1968) 157
rose abruptly to a distinct peak at 11: 00, then fell off and the peak of BGZ-curve appeared at 20: 00. Nine hours for the time lag between both peaks resulted from the inequality of their periods. Thus, the abnormal high water temperature is to be expected in the midsum- mer when the diurnal marches of both Bw and
B G z
are not strictly overlapped-the ebb began to start at about 9: 00 and continued until about 1 5 : 00-, since the compensable capacity for Bw is deficient inBGZ.
In conclusion, it is easy to predict the occurrence of too high water temperature. Therefore it is possible to avoid this unfavorable phenomenon by the preliminary arrangements.Summary
1) The maximum inflow rate of the heat accompanied by the sea.water exchange was 1 4 cal.(unit c~lumn)-'.min-~.
2) The maximum absorption deficit was 0.75 cal.(unit column)-'.min-'.
3) Long-wave exchange for the facility was unexpectedly high in comparison with the short-wave exchange.
4) Energy balance for facility was clarified. 5) Following relations were hold in the daily basis:
6) Too high water temperature for cultivation is to be expected in the midsummer when the diurnal marches of
Bw
andBGz
are not strictly overlapped.Acknowledgements
The authors are grateful to Associate prof: Hiroo INOUE, Laboratory of Oceanographical and Fisheries Engineering, this University, for his suggestions and encouragement.
References
(1) INOUE, H , TANAKA, Y : Bull Jap Sac Scz Sac, 87, 163 (1961)
Fzrh
,
32(7), 561 (1966) (5) MONIERIH, J L , SZEICZ, G : Quart J R Met (2) UEHARA, M , MATSUDA, M , KONO, T : Tech Sac, 87, 164 (1961)Bull Fac Agr Kagawa Univ
,
19 (2), 138 (1968) (6) UEHARA, M : Jour Agr Met Jap,
14(1), 19 (3) RESEARCH GROUP or EVAPOIRANSPIRATION: (1958)Jour Agr Met Jap , 22 (3), 98 (1968) (7) FUKUDA, K
,
MAEKAWA, T,
KONO, Y : Tech (4) MONTEIIH, J L , SZEICZ, G : Quart J R Met Bull Fa6 Agr Kagawa Univ,
18 (I), 48 (1966)Tech Bull Fac Agr Kagawa Univ
& ~ D & ~ ~ I % & . E B ~ Y J , PdBFJCZZ.Zi B67kED%&&%asB 4731CZT629, 7 J ~ q l j r;iJ
2331%
h a % @ .Z 7 3 h G c, tl%,%Y
L7':,,
%3 Gh?:%%$~s#33-hif&DB9 -?& 6.(1) $ @ g h Z $Sl>T, &7kD&ACZ# 5 $$&BDYrl,7&&b&h@T 14 cal-(unit column)-l-min-l 6 .,
(2)
$ATl
> , j Absorption deficit D@f\f&C$, 0.75 cal.(unit column)-I-min-I@ E T &
6 .(3) &4$,q:'j ~xCZ;jb'lr'-C&irffEMCzdr6YrlABi$b~&Tk31~.
(4) klB+EH~Bf\li&& WR%1
t
%7kDBkk%A@731-~%,$hGf%% t.%&%C$$H%33 h , 7 J c E ~ k # i 3 $ %%U3h6.
(5)