MECHANISM OF CELL CYCLE DISRUPTION BY MULTIPLE P53 PULSES
KAZUNARI IWAMOTO1, 2 HIROYUKI HAMADA1 kazunari-i@brs.kyushu-u.ac.jp hamada@brs.kyushu-u.ac.jp
MASAHIRO OKAMOTO1 okahon@brs.kyushu-u.ac.jp
1
Laboratory for Bioinformatics, Graduate School of Systems Life Sciences, Kyushu University, 3-1-1 Maidashi, Higashi-ku, Fukuoka 812-8582, Japan
2
Japan Society for the Promotion of Science, 8 Ichibancho, Chiyoda-ku, Tokyo 102-8472, Japan
When the DNA damage is generated, the tumor suppressor gene p53 is activated and selects the cell fate such as the cell cycle arrest, the DNA repair and the induction of apoptosis. Recently, the p53 oscillation was observed in MCF7 cell line. However, the biological meaning of p53 oscillation was still unclear. Here, we constructed a novel mathematical model of cell cycle regulatory system with p53 signaling network to investigate the relationship between the p53 oscillation and the cell cycle progression. First, the simulated result without DNA damage agreed with the biological findings. Next, the simulations with DNA damage realized both the p53 oscillation and the cell cycle arrest, and indicated that the generation of multiple p53 pulses disrupted the cell cycle progression. Moreover, the simulated results showed that the cell cycle disruption was caused by the catastrophe of M phase in the cell cycle, which resulted from the decline in cyclin A/cyclin-dependent kinase 2. The results in this study suggested that the generation of multiple p53 pulses against DNA damage may be used as a marker of cell cycle disruption.
Keywords: Cell cycle regulatory system, p53 signaling network, p53 oscillation, Cell cycle disruption
1. Introduction
The cell cycle is divided into four phases (i.e., G1, S, G2 and M phases) and precisely driven by several cyclin/cyclin-dependent kinase (Cyc/CDK) complexes such as CycE/CDK2, CycA/CDK2 and CycB/CDK1. The CycE/CDK2 is required to S phase entry, and the CycA/CDK2 is then responsible for S phase progression and for M phase entry, and the CycB/CDK1 catalyzes M phase entry and progression. On the other hand, the cell cycle progression is regulated by several CDK inhibitors (CKI) such as p21 and p27. Both p21 and p27 bind to and inhibit the complexes CycE/CDK2, CycA/CDK2 and CycB/CDK1, which arrests the cell cycle progression. When DNA is damaged in cycling cells, the DNA damage activates the tumor suppressor gene p53, which causes the p53 signaling network [1]. The active p53 induces DNA repair, and synthesizes p21 to arrest the cell cycle progression, and causes a programmed cell death in response to severe DNA damage [2]. Thus, p53 plays an important role in cell fate decision. Recently, it was reported that the oscillation of active p53 was observed in isolated MCF7 cell and the number of p53 pulses increased with DNA damage level [3, 4].
However, since MCF7 cell has several deficiencies in some aspects of p53 regulation, it is still unclear how the p53 pulse affects the cell cycle progression. In this study, we constructed a novel mathematical model which integrated p53 signaling network with cell cycle regulatory system, and verified a relationship between the cell cycle progression and the number of p53 pulses with DNA damage. The results in this study may provide several clues to development of the cancer therapy.
2. Method
2.1. Cell Cycle Regulatory System
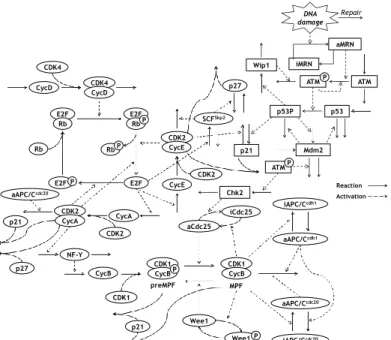
The Figure 1 shows the reaction scheme of the cell cycle regulatory system. On G1 phase, the E2F is inhibited by the binding of Rb, and both CycE/CDK2 and CycA/CDK2 are inhibited by p27 which is CDK inhibitor. When the cells are sufficiently stimulated by the growth factors, the G1 progression and the synthesis of CycD are initiated [5]. The CycD binds to CDK4 and forms the active complex (CycD/CDK4). The CycD/CDK4 phosphorylates Rb, which becomes the hypophosphorylated form (Rb-P). Furthermore, the Rb-P is phosphorylated by both CycE/CDK2 and CycA/CDK2 and becomes the hyperphosphorylated form (Rb-PP) [6]. The Rb-PP is dissociated from E2F, which leads to the activation of E2F. The active E2F promotes the synthesis of CycE, CycA, Skp2 and several proteins required for DNA replication [7, 8]. The CycE and CycA bind to CDK2 and form the active complexes (CycE/CDK2 and CycA/CDK2), which lead to the further activation of E2F by the phosphorylation of Rb-P. Therefore, the E2F, CycE/CDK2 and CycA/CDK2 play a central role in the DNA replication on S phase [9, 10]. On the other hand, the complex formed by Skp2 and Skp1-Cul1-F-box protein (SCFSkp2) ubiquitinates and decreases p27 [11]. A series of these reactions causes rapidly the activation of E2F, CycE/CDK2 and CycA/CDK2, resulting in the transition from G1 to S phases (G1/S boundary) in the cell cycle.
In S phase, the DNA is replicated by several proteins induced by E2F such as CycE/CDK2 and CycA/CDK2 [10, 12]. As the DNA replication sufficiently proceeds, the CycA/CDK2 phosphorylates and inactivates E2F, and the SCFSkp2 ubiquitinates CycE and inactivates CycE/CDK2 [13, 14]. The inactivation of both E2F and CycE/CDK2 means the completion of DNA replication and the exit of S phase (S/G2 boundary).
On the late S phase, the transcriptional factor NF-Y which is activated by CycA/CDK2 induces the synthesis of CycB [15, 16]. After the progression to G2 phase, the CycB binds to CDK1 and forms inactive complex, so called pre M phase promoting factor (preMPF). The preMPF is dephosphorylated by Cdc25 and becomes the active complex (MPF), whereas the MPF is conversely phosphorylated by Wee1 and becomes the preMPF [17, 18]. The Cdc25 and Wee1 are phosphorylated by MPF, and become the active and inactive forms, respectively [19]. Thus, the positive feedback loop between
MPF and Cdc25 is formed, which rapidly cases the activation of MPF as the G2 phase proceeds [17]. The cell cycle transits into M phase by the activation of MPF.
Since the MPF is involved in the process of cell division such as the nuclear envelope breakdown and the chromosome segregation, the M progression is mainly regulated by the variation of MPF level [10, 20]. In M phase, the MPF phosphorylated the anaphase promoting complex/cyclosome (APC/C) and promotes the binding between APC/C and Cdc20 (APC/CCdc20). The APC/CCdc20 ubiquitinates both CycB and CycA, and inactivates MPF and CycA/CDK2 [21, 22]. The inactivation of MPF promotes the active complex formed by Cdh1 and APC/C (APC/CCdh1). The APC/CCdh1 ubiquitinates both CycB and Cdc20, and inactivates MPF and APC/CCdc20 [21, 22]. The inactivation of these chemical species causes the M exit (M/G1 boundary), which implies the completion of cell cycle. In the case of promoting the synthesis of CycD by the growth factor, the cell cycle proceeds to the G1 phase again, otherwise the cell cycle progression is stopped on the G1 or G0 phases [23].
E2F Rb E2F Rb P E2F P CDK4 CycD CycD CDK4 Rb Rb P CycE CDK2 CDK2 CycA CDK2 E2F CDK1 CycB CDK1 CycBP aCdc25 iCdc25 Wee1 Wee1 iAPC/Ccdh1 iAPC/Ccdc20 P CDK1 CycB aAPC/Ccdc20 p27 SCFSkp2 p27 CDK2 aAPC/Ccdh1 aAPC/Ccdc20 NF-Y p53 ATM ATM DNA damage iMRN aMRN Repair ATM Wip1 p53P CycA p21 CycE p21 P P Reaction Activation preMPF MPF Mdm2 Chk2 p21
Figure 1 Reaction scheme of the cell cycle regulatory system and the p53 signaling network. The circle and square represented the cell cycle regulatory system and the p53 signaling network, respectively.
2.2. p53 Signaling Network
The reaction scheme of p53 signaling network is also shown in Figure 1. When the DNA damage is generated during the cell cycle, the Mre11-Rad50-Nbs1 (MRN) complex is localized at the site of DNA damage and repairs the DNA damage. Moreover, the MRN complex activates ATM (ATMP), which phosphorylates and activates both
p53 and Chk2 (p53P and Chk2P). The p53P induces the synthesis of Wip1, Mdm2 and p21. The Wip1 and the Mdm2 inactivates ATMP and p53, respectively. The p21, is the one of CKIs, binds to and inactivates CycE/CDK2, CycA/CDK2 and CycB/CDK1, resulting in the cell cycle arrest. On the other hand, the Chk2P inactivates Cdc20 and inhibits the activation of MPF, which leads to the cell cycle arrest on G2 phase. Moreover, there exists two negative feedback loops between p53 and Mdm2 and between ATM and p53, which generate the oscillation of p53, ATM, Mdm2 and Wip1 [25].
2.3. Proposed Model
Based on the above-mentioned biological findings, a novel integral model of the cell cycle regulatory system and the p53 signaling network (proposed model) is constructed (Figure 1). The proposed model is composed of 30 kinds of chemical species and 80 kinetic parameters (see Appendix). Both initial conditions and kinetic parameters in the proposed model were estimated in order to qualitatively realize observed data on all Cyc and Cyc/CDK complexes. The DNA damage was represented by the value of Damage level in the proposed model. In our simulations, DNA-damage is generated at 0 timestep and the initial value of Damage level was ranged from 0 to 4. We numerically analyze the dynamics of several chemical species to evaluate the effect of the p53 oscillation on the cell cycle progression.
3. Results and Discussion
3.1. Simulation without DNA Damage
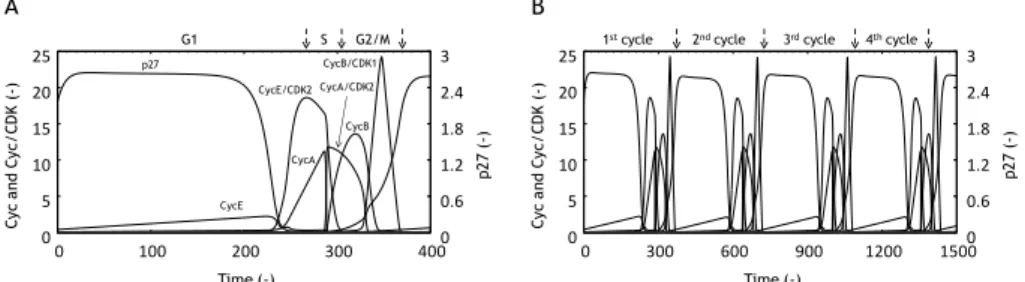
The simulation of proposed model was executed without the DNA damage (Damage level=0). Figure 2 showed the time courses of CycE, CycA, CycB, CycE/CDK2, CycA/CDK2, CycB/CDK1 and p27 levels. The p27 level maintained a high level between 0 and 200 timestep, and then the CycE level was gradually increased (Figure 2A). Thereafter, the p27 level was rapidly decreased, and both CycE/CDK2 and CycA levels were increased. The time courses of these chemical species were in good agreement with some biological findings on G1 phase [25, 26, 27]. Moreover, the peak time of CycE/CDK2 level was identified as the G1/S boundary (267 timestep in Figure 2A). After the G1/S boundary, the CycE/CDK2 level maintained a high level. The CycA/CDK2 level was increased with the decline in the CycE/CDK2 level. Since the CycE/CDK2 plays a crucial role in the DNA replication [10], the decline in CycE/CDK2 level was identified as the completion of DNA replication, which agreed with the S/G2 boundary (305 timestep in Figure 2A). After the progression to G2 phase, the CycA/CDK2 and CycB levels were decreased and increased, respectively. Thereafter, CycB/CDK1 level were increased and reached the peak level. The dynamics of these chemical species were also in good agreement with the biological findings seen in G2 and M phases [27, 28]. Since the CycB/CDK1 regulated the M progression, the decline in CycB/CDK1 level was identified as the M/G1 boundary (370 timestep in Figure 2A).
After the M/G1 boundary, the divided cells proceeded to next G1 phase. As shown in Figure 2B, the cell cycle progression was continued with the constant period interval. The simulated result of the proposed model was in good agreement with the aforementioned biological findings, which indicated the biological validation of the proposed model. 0 5 10 15 20 25 0 100 200 300 400 0 0.6 1.2 1.8 2.4 3 Time (-) C yc a nd C yc /C D K ( -) p2 7 (-) p27 CycE CycE/CDK2 CycB/CDK1 CycA CycB CycA/CDK2 G1 S G2/M 0 5 10 15 20 25 0 300 600 900 1200 1500 0 0.6 1.2 1.8 2.4 3 Time (-) C yc a nd C yc /C D K ( -) p2 7 (-)
1stcycle 2ndcycle 3rdcycle 4thcycle
A B
Figure 2 Time courses of CycE, CycA, CycB, CycE/CDK2, CycA/CDK2, CycB/CDK1 and p27 levels without DNA damage (Damage level=0) for one cycle (A) and four cycles (B). The cell cycle phases (A) and periods of cell cycle (B) were shown upon the graph. Dashed arrow represented the boundary of cell cycle phase.
3.2. Simulations with Different Level of DNA Damage
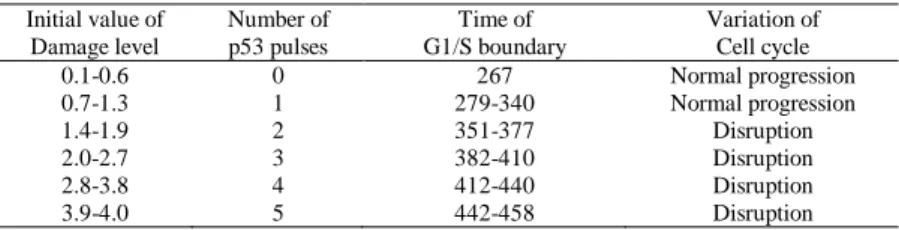
The simulations of the proposed model were executed with different level of DNA damage. In our simulations, the DNA damage was introduced at 0 timestep instantaneously and the initial value of Damage level was ranged from 0.1 to 4 per 0.1. The time courses of CycE/CDK2, CycA/CDK2, CycB/CDK1, p53, p21 and Damage level were calculated (Figure 3 and 4). Figure 3 shows the simulated result with Damage level=1.3. Then, single p53 pulse was generated and the G1/S boundary was identified in 340 timestep (Figure 3A). The delay time of the G1/S boundary with Damage level=1.3 was 73 timestep in comparison with the G1/S boundary without DNA damage shown in Figure 2 (normal G1/S boundary). Moreover, the cell cycle was normally continued after DNA repair (Figure 3B). On the other hand, Figure 4 showed the simulated result with Damage level=1.6. In this case, two p53 pulses were generated. The G1/S boundary was identified in 366 timestep, and the delay time of G1/S boundary was 99 timestep in comparison with the normal G1/S boundary (Figure 4A). In the cell cycle progression after DNA repair, the peak levels of all Cyc/CDK complexes were decreased with the cell cycle progression and the cell cycle was finally stopped (Figure 4B). Table 1 shows a relationship among the initial value of Damage level, the number of p53 pulses, the time of G1/S boundary and the variation of cell cycle. As the value of Damage level was increased, the number of p53 pulses was increased and the time of G1/S boundary lagged. Moreover, in the case of generating multiple p53 pulses, the cell cycle progression after DNA repair was stopped, which implied that the cell cycle regulatory system was disrupted (cell cycle disruption). Therefore, generation of multiple p53 pulses showed a key role in the cell fate decision.
0 5 10 15 20 25 0 100 200 300 400 500 600 0 0.5 1 1.5 2 2.5 0 5 10 15 20 25 0 500 1000 1500 2000 2500 3000 0 0.5 1 1.5 2 2.5 A B C yc /C D K (-) p5 3, p 21 a nd D am age le ve l ( -) Time (-) C yc /C D K (-) p5 3, p 21 a nd D am ag e le ve l ( -) Time (-) p53 p21 Damage level CycE/CDK2 CycB/CDK1 CycA/CDK2 G1/S boundary
Figure 3 Time courses of CycE/CDK2, CycA/CDK2, CycB/CDK1, p53, p21 and Damage level with DNA damage (Damage level=1.3) for one cycle (A) and multiple cycles (B). Dashed arrow represented the G1/S boundary without DNA damage.
0 5 10 15 20 25 0 100 200 300 400 500 600 0 0.5 1 1.5 2 2.5 0 5 10 15 20 25 0 500 1000 1500 2000 2500 3000 0 0.5 1 1.5 2 2.5 A B C yc /C D K (-) p5 3, p 21 a nd D am age le ve l ( -) Time (-) C yc /C D K (-) p5 3, p 21 a nd D am age le ve l ( -) Time (-) p53 p21 Damage level CycE/CDK2 CycB/CDK1 CycA/CDK2 G1/S boundary
Figure 4 Time courses of CycE/CDK2, CycA/CDK2, CycB/CDK1, p53, p21 and Damage level with DNA damage (Damage level=1.6) for one cycle (A) and multiple cycles (B). Dashed arrow represented the G1/S boundary without DNA damage.
Table 1 Relationship between the number of p53 pulses and the variation of cell cycle. Initial value of Damage level Number of p53 pulses Time of G1/S boundary Variation of Cell cycle 0.1-0.6 0 267 Normal progression 0.7-1.3 1 279-340 Normal progression 1.4-1.9 2 351-377 Disruption 2.0-2.7 3 382-410 Disruption 2.8-3.8 4 412-440 Disruption 3.9-4.0 5 442-458 Disruption
3.3. Mechanism of Cell Cycle Disruption by Multiple p53 Pulses
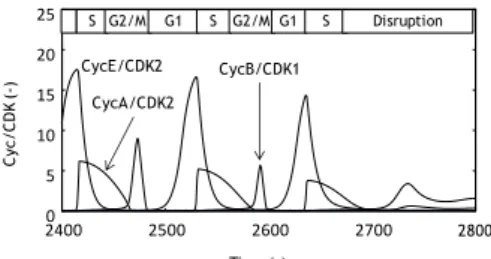
We analyzed the dynamics of several chemical species numerically to elucidate the mechanism of cell cycle disruption induced by the multiple p53 pulses. Figure 5 shows the time courses of CycE/CDK2, CycA/CDK2 and CycB/CDK1 in the case of the multiple p53 pulses. It was shown that the CycB/CDK1 was not synthesized just before the cell cycle disruption. Since the CycB/CDK1 regulates the M progression, the cell cycle could not proceed the M phase due to the inactivation of CycB/CDK1, which caused the cell cycle disruption.
0 5 10 15 20 25 2400 2500 2600 2700 28002800 S G2/M G1 S G2/M G1 S Disruption CycE/CDK2 CycA/CDK2 CycB/CDK1 Time (-) C yc /C D K (-)
Figure 5 Time courses of CycE/CDK2, CycA/CDK2 and CycB/CDK1 in case of multiple p53 pulses. The initial value of Damage level is 1.6. The cell cycle phases were shown at the top.
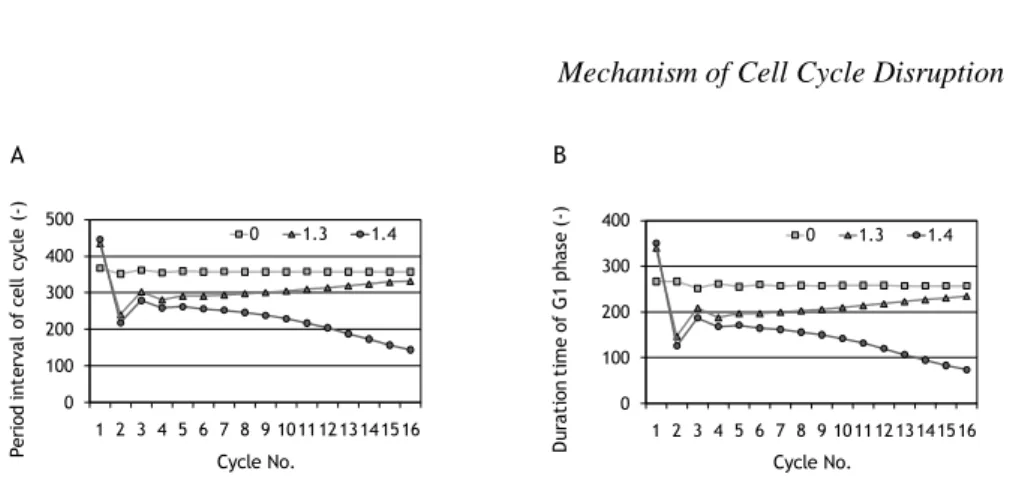
The cell cycle progression was normally continued with Damage level=1.3, however, as shown in Table 1, the cell cycle disruption was caused with Damage level=1.4. Hence, it was important to explore the significant biological event with both Damage level. Figure 6A shows the period interval per cell cycle with Damage level=0, 1.3 and 1.4. The period interval per cell cycle was hardly changed with Damage level=0 (square in Figure 6A). The period interval with Damage level=1.3 was disturbed by the generation of DNA damage and recovered to the period interval with Damage level=0 (triangle in Figure 6A). In contrast, the period interval with Damage level=1.4 was gradually shortened after DNA damage (circle in Figure 6A). Moreover, the shortness of the period interval with Damage level=1.4 particularly depended on the duration time of G1 phase (Figure 6B). In this study, the DNA damage was generated on 0 timestep (G1 phase).The G1 progression was regulated by CycE/CDK2, CycA/CDK2 and E2F in the proposed model (Figure 1). Figure 7 shows the peak levels of both CycE/CDK2 and CycA/CDK2, and E2F level on the M/G1 boundary per cell cycle with Damage level=1.3 and 1.4. The peak levels of CycE/CDK2 and CycA/CDK2 and E2F level on the M/G1 boundary with Damage level=1.3 were hardly changed (Figure 7A). In contrast, the peak level of CycA/CDK2 with Damage level=1.4 gradually decreased and the E2F level on the M/G1 boundary increased with the passage number of cell (Figure 7B). Figure 8 shows the phase plane diagrams of E2F and CycA/CDK2 with Damage level=0, 1.3 and 1.4. In Figure 8, START and Recovery represented the initial condition of simulation and the point where the DNA repair was completed, respectively. The trajectory of CycA/CDK2 and E2F levels with Damage level=0 (normal trajectory) showed the limit cycle (Figure 8A). With Damage level=1.3, the trajectory of CycA/CDK2 and E2F levels after decreasing the CycA/CDK2 level recovered to the normal trajectory (Figure 8B). On the other hand, with Damage level=1.4, the CycA/CDK2 level on the point of Recovery decreased than that with Damage level=1.3 (Figure 8C). Thereafter, the trajectory of CycA/CDK2 and E2F differed from the normal trajectory, and converged with the singular point, which implied the cell cycle disruption (Figure 8C and D). The CycA/CDK2 activates the NF-Y on S and G2 phases and the active NF-Y promotes the synthesis of CycB (Figure 1). Hence, the CycB/CDK1 level decreased with CycA/CDK2 level, which interrupted the progression to M phase and finally the cell cycle progression was stopped.
0 100 200 300 400 500 1 2 3 4 5 6 7 8 9 10111213141516 0 1.3 1.4 0 100 200 300 400 1 2 3 4 5 6 7 8 9 10111213141516 0 1.3 1.4
Cycle No. Cycle No.
Pe ri od in te rv al o f ce ll cy cl e (-) D ur at io n ti m e of G 1 p has e (-) A B
Figure 6 Period interval of cell cycle (A) and duration time of G1 phase (B) per cell cycle with Damage level=0 (square), 1.3 (triangle) and 1.4 (circle).
0 0.01 0.02 0.03 0.04 0.05 0 4 8 12 16 20 1 2 3 4 5 6 7 8 9 10111213141516 CycE/CDK2 CycA/CDK2 E2F 0 0.01 0.02 0.03 0.04 0.05 0 4 8 12 16 20 1 2 3 4 5 6 7 8 9 10111213141516 CycE/CDK2 CycA/CDK2 E2F
Pe ak le ve l of C yc E/ C D K 2 an d C yc A /C D K 2 (-) Le ve l o f E2 F in M /G 1 b ou nd ar y (-) Cycle No. Pe ak le ve l of C yc E/ C D K 2 an d C yc A /C D K 2 (-) Le ve l o f E2 F in M /G 1 b ou nd ar y (-) Cycle No. A B
Figure 7 Peak levels of CycE/CDK2 (square) and CycA/CDK2 (triangle), and E2F level (circle) on the M/G1 boundary. The initial values of Damage level were 1.3 (A) and 1.4 (B).
These simulated results suggested the hypothesis of cell cycle disruption by multiple p53 pulses as follows: (1) The DNA damage delayed the G1/S boundary, which decreased the CycA/CDK2 level. (2) Since the CycA/CDK2 inactivates the E2F, the decrease in CycA/CDK2 led to the accumulation of E2F. (3) The accumulation of E2F accelerated the G1 progression. (4) The acceleration of G1 phase led to the decline in the synthesis of CycA and the peak level of CycA/CDK2 was decreased. (5) The CycA/CDK2 level was decreased with increasing in passage number of cell, which decreased the synthesis of CycB. (6) The decline in CycB/CDK1 caused by the inhibition of CycB synthesis interrupted the M phase, and then the cell cycle regulatory system was disrupted. On this hypothesis, it was important that the CycA/CDK2 level decreased after DNA damage. Whether the cell cycle regulatory system was disrupted or not was dependent on the ratio of decrease in CycA/CDK2 level. It was reported that the deficiency in CycA in the cells induced the abnormal chromosome segregation on M phase and the catastrophe of M phase [29]. This report strongly supported our hypothesis of cell cycle disruption. The results in this study indicated that the generation of p53 pulses may be used as a marker of cell cycle disruption.
1e-045 1e-040 1e-035 1e-030 1e-025 1e-020 1e-015 1e-010 1e-005 1 100000 0.001 0.01 0.1 1 10 START E2F (-) C yc A /C D K 2( -) 1e-045 1e-040 1e-035 1e-030 1e-025 1e-020 1e-015 1e-010 1e-005 1 100000 0.001 0.01 0.1 1 10 START E2F (-) C yc A /C D K 2( -) Recovery A B 1e-045 1e-040 1e-035 1e-030 1e-025 1e-020 1e-015 1e-010 1e-005 1 100000 0.001 0.01 0.1 1 10 START E2F (-) C yc A /C D K 2( -) Recovery D 0.01 0.1 1 10 100 0.001 0.01 0.1 1 10 E2F (-) C yc A /C D K 2( -) C
Figure 8 Phase plane analysis of CycA/CDK2 and E2F with Damage level=0 (A), 1.3 (B) and 1.4 (C). (D) is the enlarged phase plane diagram of (C). START and Recovery represented the initial point of simulation and the point in which the DNA damage was repaired, respectively. Black arrow showed the direction of cell cycle progression.
4. Conclusion
A novel integral model of the cell cycle regulatory system and the p53 signaling network was mathematically constructed (proposed model) to investigate an effect of the p53 oscillation on the cell cycle progression. The simulated result without DNA damage was in good agreement with the biological findings, which indicated the biological validation of the proposed model. The proposed model with applying different values of Damage level realized the p53 oscillation and the cell cycle arrest on G1 phase. Moreover, the generation of multiple p53 pulses led to the cell cycle disruption and stopped the cell cycle progression after DNA repair. With comparing the simulated result of the cell cycle progression with that of the cell cycle disruption, it was indicated that the cell cycle disruption was caused by the catastrophe of M progression. This resulted from the decline in both CycB/CDK1 and CycA/CDK2. Since the synthesis of CycB is promoted by the CycA/CDK2, the CycA/CDK2 was simultaneously decreased. On the other hand, the CycA/CDK2 was hardly changed in the case of the recovery to normal cell cycle progression. Therefore, it was important to evaluate CycA/CDK2 level to elucidate the cell cycle disruption. It was reported that the deficiency in CycA caused the mitotic catastrophe, and the simulated results of the proposed model was in good agreement with this biological finding. The results in this study indicated that the generation of p53 pulses may be used as a marker of cell cycle disruption.
Acknowledgments
This work was done by the support of a Research Fellowship of the Japan Society for the Promotion of Science.
Appendix
The initial values, kinetic parameters and equations in the proposed model were shown in this section. The abbreviations in the proposed model were as follows: Y1:E2F/Rb,
Y2:E2F/RbP, Y3:E2F, Y4:E2FP, Y5:CycD, Y6:CycD/CDK4, Y7:CycE, Y8:CycE/CDK2,
Y9:CycA, Y10:CycA/CDK2, Y11:SCFSkp2, Y12:p27, Y13:NF-Y, Y14:CycB, Y15:pMPF,
Y16:MPF, Y17:APC/CCdc20, Y18:APC/CCdh1, Y19:Wee1, Y20:Cdc25, Y21:Damage level,
Y22:active MRN, Y23:ATM, Y24:ATM-P, Y25:p53, Y26:p53-P, Y27:Mdm2, Y28:Wip1,
Y29:Chk2, Y30:p21.
Kinetic parameters in the proposed model. Kinetic parameter Value Kinetic parameter Value Kinetic parameter Value Kinetic parameter Value k1 0.1 k21 0.46 J7 0.5 tot_MRN 1 k2 0.1 k22 1.5 J8 0.6 kmp 0.1 k3 1 k23 2.8 J9 0.2 s1p 0.5 k4 1 k24 0.5 J10 1 f1p 2 k5 0.05 k25 1.2 totcdc20 1 r1p 1.4 k6 0.1 k26 0.7 totcdh1 1 km1p 0.3 k7 0.1 k27 0.95 totwee1 1 d1p 0.1 k8 0.44 k28 1.7 totcdc25 1 s2p 0.5 k9 0.5 k29 1.5 b7m 0.011 f2p 1.5 k10 0.1 k30 2 s8 0.6 r2p 0.5 k11 0.05 k31 2 b8e 0.25 km2p 1.8 k12 2 k32 2 b8a 0.25 d2p 0.5 k13 2.1 k33 0.1 b8m 0.1 s3p 0.9 k14 0.5 k34 2 d8 1 s3dp 0.01 k15 0.1 J1 0.5 dd8 0.5 d3p 0.6 k16 0.39 J2 1 km8 0.1 d3dp 0.5 k17 0.1 J3 0.83 r6d 1 s4p 0.1 k18 1.6 J4 1 repair 0.01 d4p 0.13 k19 0.3 J5 2.5 f_MRN 1.5 s5p 0.1 k20 0.94 J6 0.75 r_MRN 1.2 d5p 0.1
Initial values in the proposed model Chemical
species Initial value
Chemical
species Initial value
Chemical
species Initial value
Y1 1.482 Y11 0.094 Y21 0
Y2 3.490 Y12 2.144 Y22 0
Y3 0.018 Y13 1.312e-16 Y23 0.1999
Y4 6.974e-35 Y14 4.964e-8 Y24 6.77e-13
Y5 0.999 Y15 0.05 Y25 2.727
Y6 0.999 Y16 0.003 Y26 7.343e-11
Y7 0.363 Y17 0.011 Y27 0.017
Y8 0.0005 Y18 0.998 Y28 5.648e-11
Y9 0.033 Y19 0.999 Y29 0
Y10 1.727e-34 Y20 0.031 Y30 0
Equations in the proposed model. dY1/dt= k4Y4/(J1+Y4) -k1Y1Y6/(J1+Y1)
dY2/dt= k1Y1Y6/(J1+Y1) -k2Y2(Y8+Y10)/(J1+Y2) dY3/dt= k2Y2(Y8+Y10)/(J1+Y2) -k3Y3Y10/(J1+Y3) dY4/dt= k3Y3Y10/(J1+Y3) -k4Y4/(J1+Y4) dY5/dt= k5 -k6Y5/(J2+Y5)
dY6/dt= k6Y5/(J2+Y5) -k7Y6/(J2+Y6) dY7/dt= k8Y3 -k9Y7Y8/(J3+Y7)
dY8/dt= k9Y7Y8/(J3+Y7) -k10Y8Y11/(J3+Y8) -k17Y12Y8 -b8eY8Y30 dY9/dt= k11Y3 -k12Y9Y10/(J4+Y9)
dY10/dt= k12Y9Y10/(J4+Y9) -k13Y10Y17/(J4+Y10) -k17Y12Y10 -b8aY10Y30 dY11/dt= k14Y3 -k15Y11
dY12/dt= k16 -k17Y12Y8 -k17Y12Y10 -k18Y12Y11-b7mY12Y15 -b7mY12Y16 dY13/dt= k19Y10 -k20Y13
dY14/dt= k21Y13 -k22Y14/(J5+Y14)
dY15/dt= k22Y14/(J5+Y14) -k23Y15Y20/(J6+Y15) +k24Y16Y19/(J6+Y16) -b7mY12Y15 -b8mY15Y30 dY16/dt= k23Y15Y20/(J6+Y15) -k24Y16Y19/(J6+Y16) -k25Y16(Y17+Y18)/(J6+Y16) -b7mY12Y16 -b8mY16Y30 dY17/dt= k26Y16(totcdc20-Y17)/(J7+totcdc20-Y17) -k27Y17Y18/(J7+Y17)
dY18/dt= k28(totcdh1-Y18)/(J8+totcdh1-Y18) -k29Y18Y16/(J8+Y18) dY19/dt= k30(totwee1-Y19)/(J9+totwee1-Y19) -k31Y19Y16/(J9+Y19)
dY20/dt= (k33 +k32Y16(totcdc25-Y20))/(J10+totcdc25-Y20) -(k34+r6dY29)Y20/(J10+Y20) dY21/dt= -repairY21
Equations in the proposed model (continued). dY23/dt= s1p-f1pY23Y24Y22/(km1p+Y23) -d1pY23
dY24/dt= f1pY23Y24Y22/(km1p+Y23) -r1pY24Y28/(km1p+Y24) dY25/dt= s2p-f2pY25Y24/(km2p+Y25)-r2pY25Y27-d2pY25 dY26/dt= f2pY25Y24/(km2p+Y25)-r2pY26Y27
dY27/dt= s3pY26+s3dp-d3pY27-d3dpY24Y27 dY28/dt= s4pY26-d4pY28
dY29/dt= s5pY24-d5pY29
dY30/dt= s8Y26-b8eY8Y30 -b8aY10Y30 -b8mY15Y30 -b8mY16Y30 -d8Y30Y27/(km8+Y27)
References
[1] Iliakis, G., Wang, Y., Guan, J. and Wang, H., DNA damage checkpoint control in cells exposed to ionizing radiation, Oncogene, 22:5834-5847, 2003. [2] Fridman, J., S. and Lowe, S., W., Control of apoptosis by p53, Oncogene,
22:9030-9040, 2003.
[3] Lahav, G., Nitzan, R., Sigal, A., Geva-Zatorsky, N., Arnold, J., L., Michael, B., E. and Alon, U., Dynamics of the p53- Mdm2 feedback loop in individual cells, Nat.
Genet., 36:147-150, 2004.
[4] Geva-Zatorsky, N., Rosenfeld, N., Itzkovitz, S., Milo, R., Sigal, A., Dekel, E., Yarnitzky, T., Polak, P., Liron, Y., Kam, Z., Lahav, G. and Alon, U., Oscillations and variability in the p53 system, Mol. Syst. Biol., 2, doi:10.1038/msb4100068, 2006.
[5] Parry, D., Bates, S., Mann, D., J. and Peters, G., Lack of cyclin D-Cdk complexes in Rb-negative cells correlates with high levels of p16INK4/MTS1 tumour suppressor gene product, EMBO J., 14(3):503-511, 1995.
[6] Giacinti, C. and Giordano, A., RB and cell cycle progression, Oncogene, 25:5220-5227, 2006.
[7] Bracken, A., P., Ciro, M., Cocito, A. and Helin, K., E2F target genes: unraveling the biology, Trends Biochem. Sci., 29(8):409-417, 2004.
[8] Zhang, L. and Wang, C., F-box protein Skp2: a novel transcriptional target of E2F, Oncogene, 25:2615-2627, 2006.
[9] Helin, K., Regulation of cell proliferation by the E2F transcription factors, Curr.
Opin. Genet., 8:28-35, 1998.
[10] Woo, R., A. and Poon, R., Y., Cyclin-dependent kinases and S phase control in mammalian cells, Cell Cycle 2(4):316-324, 2003.
[11] Carrano, A., C., Eytan, E., Hershko, A. and Pagano, M., SKP2 is required for ubiquitin-mediated degradation of the CDK inhibitor p27, Nat. Cell Biol., 1:193-199, 1999.
[12] Girard, F., Strausfeld, U., Fernandez, A. and Lamb, N., J., C., Cyclin A is required for the onset of DNA replication in mammalian fibroblasts. Cell 67(6), 1169-1179, 1991.
[13] Xu, M., Sheppard, K., A., Peng, C., Y., Yee, A., S. and Piwnica-Worms, H., Cyclin A/CDK2 binds directly to E2F-1 and inhibits the DNA-binding activity of E2F-1/DP-1 by phosphorylation, Mol. Cell Biol., 14:8420-8431, 1994.
[14] Yeh, K., H., Kondo, T., Zheng, J., Tsvetkov, L., M., Blair, J. and Zhang, H., The F-Box Protein SKP2 Binds to the Phosphorylated Threonine 380 in Cyclin E and Regulates Ubiquitin-Dependent Degradation of Cyclin E, Biochem. Biophys. Res.
Commun., 281(4):884-890, 2001.
[15] Chae, H., D., Yun, J., Bang, Y., J. and Shin, D., Y., Cdk2-dependent phosphorylation of the NF-Y transcription factor is essential for the expression of the cell cycle-regulatory genes and cell cycle G1/S and G2/M transitions,
Oncogene, 23:4084-4088, 2004.
[16] Fung, T., K. and Poon, R., Y., C., A roller coaster ride with the mitotic cyclins.
Seminars in Cell Dev. Biol., 16(3):335-342, 2005.
[17] McGowan, C., H. and Russell, P, Cell cycle regulation of human WEE1, EMBO
J., 14(10):2166-2175, 1995.
[18] Donzelli, M. and Draetta, G., F., Regulating mammalian checkpoints through Cdc25 inactivation, EMBO reports, 4(7):671-677, 2003.
[19] Perry, J., A. and Kornbluth, S., Cdc25 and Wee1: analogous opposites? Cell
Division, 2:12, doi:10.1186/1747-1028-2-12, 2007.
[20] Xu, N. and Chang, D., C., Different thresholds of MPF inactivation are responsible for controlling different mitotic events in mammalian Cell Division,
Cell Cycle, 6(13):1639-1645, 2007.
[21] Peters, J., M., The Anaphase-Promoting Complex: Proteolysis in Mitosis and Beyond, Mol. Cell, 9:931-943, 2002.
[22] Castro, A., Bernis, C., Vigneron, S., Labbe, J., C. and Lorca, T, The anaphase-promoting complex: a key factor in the regulation of cell cycle, Oncogene, 24:314-325, 2005.
[23] Yang, K., Hitomi, M. and Stacey, D., W., Variations in cyclin D1 levels through the cell cycle determine the proliferative fate of a cell, Cell Division, 1(32):doi:10.1186/ 1747-1028-1-32, 2006.
[24] Batchelor, E., Mock, C., S., Bhan, I., Loewer, A. and Lahav, G., Recurrent initiation: a mechanism for triggering p53 pulses in response to DNA damage.
Mol. Cell, 30:277-289, 2008.
[25] Ohtsubo, M., Theodoras, A., M., Schumacher, J., Roberts, J., M. and Pagano, M., Human cyclin E, a nuclear protein essential for the G1-to-S phase transition, Mol.
Cell Biol., 15(5):2612-2624, 1995.
[26] Bartek, J., Bartkova, J. and Lukas, J., The retinoblastoma protein pathway and the restriction point, Curr. Opin. Cell Biol., 8:805-814, 1996.
[27] Zhu, W., Giangrande, P., H. and Nevins, J., R., E2Fs link the control of G1/S and G2/M transcription, EMBO J., 23:4615-4626, 2004.
[28] Hochegger, H., Takeda, S. and Hunt, T., Cyclin-dependent kinases and cell-cycle transitions: does one fit all? Nat. Rev. Mol. Cell Biol., 9:910-916, 2008.
[29] Yam, C., H., Fung, T., K. and Poon, R., Y., Cyclin A in cell cycle control and cancer, Cell Mol. Life Sci., 59:1317-1326, 2002.