The Oceanographic Condition along 131°E from
30°N to 15°N in June, 1989
著者
HIGASHI Masataka
journal or
publication title
鹿児島大学水産学部紀要=Memoirs of Faculty of
Fisheries Kagoshima University
volume
38
number
1
page range
53-62
別言語のタイトル
1989年6月131°E線上30°Nから15°Nまでの海流
Mem. Fac. Fish. Kagoshima Univ.,
Vol. 38, No. 1, pp. 53-62 (1989)
The Oceanographic Condition along 131°E
from 30°N to 15°N in June, 1989
Masataka Higashi*
Keywords : Oceanic condition, CTD Observation, 131°E, Northwestern Pacific
Abstract
The CTD observations were carried out along 131°E from 30°N to 15°N in the Northwestern
Pacific from the 10th to 14th of June, 1989.
Vertical sections of water temperature, salinity and dynamic height along 131°E were described,
and some representative temperature-salinity relations were drawn from CTD records.
The
condition of temperature distribution section was related to the existence of the zonal currents.
These currents along section from the north to the south were the Kuroshio, the Kuroshio
Countercurrent, the Subtropical Countercurrent, the northern part of the North Equatorial Current
and the easterly current near 18°N.
Numerous small step-like and inversion features were existed
in the temperature-salinity relations above 15°C, which showed the existence of surface water
mixing.
The oceanic condition in the tropical and subtropical western boundary area of the North Pacific
Ocean seems very important for studying of the tuna and skipjack fishing grounds, the Subtropical
Ocean circulation system and world's climate changes.
For the progress of these studies, the
accumulation of oceanographic data is indispensable in the area under consideration.
The Keiten Maru (G.T. 860 tons), fishing training ship of the Kagoshima University has been
oceanographic works in her yearly training cruise since 1978.
Recently, Masumitsu1* described
some transequatorial CTD sections in the Western Pacific.
Yuwaki2) et al. also reported the
oceanographic conditions in the Western Tropical Pacific.
In 1989, we had the cruise for cadets
training from Kagoshima, Japan to Jakarta, Indonesia.
On the way to Jakarta, the oceanographic
observations and tuna long-line fishing were carried out from the 10th of June through the 15th of
July.
The present paper describes the oceanographic conditions along 131°E from 30°N to 15°N
observed by CTD casts.
Among many oceanographic studies in the Subtropical and Tropical Western Pacific Ocean
published in the past, "Beginning of the Kuroshio" by Nitani3) was typical of the general
oceanographic description, and "The 137°E oceanographic section" by Masuzawa and Nagasaka4)
was another outstanding oceanographic study in year to year variations.
*x Training Ship the Keiten Maru, Faculty of Fisheries, Kagoshima University, 50-20 Shimoarata 4,
Kagoshima 890, Japan
CTD Observations
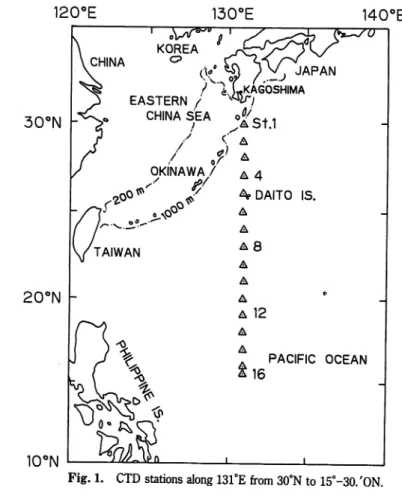
Fig. 1 shows the locations of oceanographic observations along 131°E in the Northwestern
Pacific.
The oceanographic observations were made at 16 stations on each whole degree of lat.
30°N-15°N along long. 131°E from the 10th (St. 1) to 14th (St. 16) of June.
The first and last
stations were the odd lat., 29°-54.'9N, 15°-30.'0N respectively. The distance between two
stations was 60 miles with a few exceptions.
120°E
l CHINA KOREA130°E
f "1 (-KAGOSHIMA
EASTERN /
v^/
140°E
30°N
CHINA SEA<
A
,<&*
TAIWAN20°N
10°N
/
OKINAWA 7
oN0Q
N^
•?•
A 4ApDAITO IS,
A A A 8 A A A A 12 A A PACIFIC OCEAN 16Fig. 1. CTD stations along 131°E from 30°N to 15°-30/ON.
The oceanographic observations were carried out by CTD system (Neil Brown System Inc.,
Model 1150).
The water temperature and conductivity for pressure were recorded on the
magnetic tape, and printed on the recording paper.
The CTD cast down to the maximum depth
of 1200 dbar.The values of temperature and salinity at the international oceanographic depth (pressure dbar)
Higashi : The Oceanographic Condition along 131°E
55Results and Discussion
Vertical section of temperature
Fig. 2 shows the distribution of water temperature in the vertical section drawn from the data in
Appendix.
The surface water temperatures were higher than 30.0°C at the area between Sts. 10 and 14,
and at St. 16.
The highest surface temperature was 30.83°C at St. 12(19°N) and 30.36°C at St.
16 (15°-30:0N).
The strong down slope of isotherms from the north to the south was found in the entire layer in
the area between 30°N and 27°N; this was associated with the Kuroshio.
The up slope of
isotherms from the north to the south around at 26°N showed the existence of the Kuroshio
countercurrent.The other remarkable structure of temperature distributionwas the isotherm spreading of 21°C
and 19°C, which indicated the existence of the Subtropical Mode Water.
From 22°N to 15°N,
isotherms in the layer from the surface to 600 m were almost flat, indicating no existence of
strong zonal currents.
Vertical section of salinity
Fig. 3 shows the distribution of salinity in the vertical section drawn from the data in Appendix.
The less salinities lower than 34.2%o were observed at the sea surface at Sts. 1, 4, 10-12, and
14-15.
Among the less saline surface water, the lowest value was 33.670%o at the sea surface of
St. 11200
STATION NUMBERS
5 8 10
30°N
25°N
20°N
15°N
1200
STATION NUMBERS
5 8 10 12 14 16
30°N
25°N
20°N
15°N
Fig. 3.
Distribution of salinity (%o) in the vertical section.
2.5 2.0 cc
\H 1.5
o1 1.0
-z. Q 0.5 -STATION NUMBERS3
5
8
10
12
14
16
1 I ~ -J 1 1 L. _j i i30°N
25°N
20°N
15°N
Higashi '. The Oceanographic Condition along 131°E
57Below the surface water, the subsurface saline water having a salinity higher than 34.8%o was
noted in the layer 100-300 m deep.
This subsurface saline water penetrated from the south with
the highest salinity of 35.0%o at 21°N and 15°N.
Below the subsurface saline water, the halocline
between 34.7%o and 34.4%o was found in the entire section.
In the Kuroshio and the Kuroshio
Countercurrent area, the strong slope of halocline appeared with the thermocline.
Below the halocline, the intermediate water characterized by the low saline water less than
34.3%o appeared in the layer 500-800 m deep.
The intermediate water deepened at 28°N-27°N,
and then it shallowed toward the south.Dynamic Height Section
Fig. 4 shows the dynamic height section referred to 1000 dbar, in order to describe the
distribution of zonal currents in the section.In this figure, Ei, E2, E3 and Wi, W2 indicate eastward and westward components of the
current perpendicular to the section.
The eastward currents, Ex and E2 indicate the Kuroshio and the Subtropical Countercurrent
respectively.
According to Uda and Hasunuma5), the Subtropical Countercurrent was found at
100-200 m near the Tropic of Cancer and marked the line of demarcation between the Subtropical
Mode Water on the north and the Tropical Water on the south.
E3 might be indicated to the
easterly current near 18°N with the warm core like a belt on the right-hand side of the North
Equatorial Current (NEC), as pointed out by Nitani3).
The westward currents, Wi and W2 indicated the Kuroshio Countercurrent and the northern
part of the NEC.
According to Nitani3), the NEC carried the North Tropical Water to the west,
which became one of the main water mass of the Kuroshio.
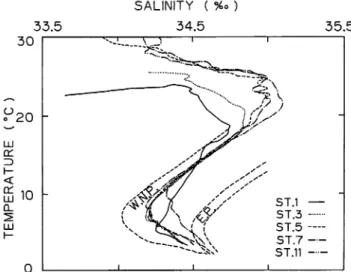
Temperature-Salinity relations
Fig. 5 shows the Temperature-Salinity (T-S) relations at stations 1, 3, 5, 7 and 11 based on the
CTD records. 33.5 30 o 20 Z>S 10
Q_ LU SALINITY ( %o ) 34.5 35.5Fig. 5.
Temperature-Salinity (T-S) diagrams at St. 1 (30°N), St. 3(28°N), St. 5(26°N), St. 7(24°N),
and St. 11(20°N).
Numerous small step-like and inversion features were existed in all T-S curves above 15°C;
this showed the existence of mixing of water in the surface layer, though such features could not
be seen in the temperature section.
The water having the salinity range of 34.728-35.004%o and the temperature range of
17.70-22.21°C was the Subtropical Subsurface Water, which existed 125-200m deep.
All curves in Fig. 5, converged to temperatures 13-14°C, and salinities 34.4-34.6%o.
This
uniform water might correspond to the Western North Pacific Central Water (Sverdrup et al.6)).
The water with the minimum salinity (34.2%o) corresponded to the North Pacific Intermediate
Water.Below the salinity minimum, T-S relations approached the deep water in the Pacific Ocean.
Summary
The following are based on shipboard preliminary processing of the data from CTD observations
from the 10th to 14th of June 1989 in the Northwestern Pacific Ocean.
Along 131°E, the structures ofwater temperature and salinity were described.
The Subtropi
cal Mode Water characterized by the isotherms spreading of 21-19°C was clearly found in the
region of the Kuroshio and the Kuroshio Countercurrent.
From 25°N to 15°N, the isotherms and
the isohalines were almost flat along the section, showing that no strong zonal currents
perpendicular to the section.
The currents along 131°E from the north to the south were the Kuroshio and the Kuroshio
Countercurrent, the Subtropical Countercurrent, the northern part of the North Equatorial
Current and the easterly current near 18°N.
The T-S relations by CTD records indicated numerous small step-like and inversion layers.
These structures might be attributed to the mixing condition in the surface layer.
The oceanographic structure of the surface waterwas important to studythe fishing ground and
the air-sea interaction in earth science.
The detailed structure in the surface water will be
analyzed in the further processing.
Acknowledgements
I wish to express my hearty thanks to Cap.
Y. Yuwaki and crew of the training ship Keiten
Maru for their assistance and support on board, and Dr. M. Chaen for his advice in preparing this
manuscript.
References
1)
S. Masumitsu (1985):
Transequatorial CTD sections in the Western Pacific.
Mem. Fac. Fish.,
Kagoshima Univ., 34, 7-19.
2) Y. Yuwaki, T. Nishi, S. Masumitsu, andM. Higashi (1988):
Oceanic Conditions in the Western Tropical
Pacific in the Summer of 1988. Mem. Fac. Fish., Kagoshima Univ., 37, 97-109.
3)
H. Nitani (1972):
Beginning of the Kuroshio.
Univ. Tokyo Press, pp. 129-163.
4) J. Masuzawa and K. Nagasaka (1975):
The 137°E oceanographic section. Jour. Mar. Res., 33 (Suppt),
109-116.Higashi '. The Oceanographic Condition along 131°E
59
5)
M. Uda and K. Hasunuma (1969):
The Eastward Subtropical Countercurrent in Western North Pacific
Ocean.
/. Oceanogr. Soc. Japan, 25. (4), 201-210.
6)
Sverdrup, H. U., M. W. Johnson and R. H. Fleming (1942):
The Oceans, their physics, chemistry and
general biology.
Prentice-Hall, New York, 605-761.
Appendix
Date
June 10, 1989
June 11, 1989
June 11, 1989
Stn. 1 2 3
Lat. 29°-54.'9N 29°-00.'0N 28°-00.'0N
Long.
131°-00.'0E 131°-00.'3E 131°-00.'2ETemp. (°C)
Sal. (%o)Temp. (°C)
Sal. (%o)
Temp. (°C)
Sal.
(%o)
0 23.17 33.670 32.98 34.426 25.98 34.585 10 23.49 32.133 24.97 34.425 25.78 34.578 20 23.40 31.702 24.65 34.448 23.91 34.614 30 22.75 33.807 23.94 34.448 22.43 34.701 50 22.75 34.507 23.82 34.519 21.70 34.788 75 20.83 34.602 22.89 34.653 20.66 34.840 100 19.47 34.682 21.96 34.768 20.56 34.845 150 17.00 34.704 20.59 34.833 20.25 34.850 200 14.90 34.562 19.38 34.820 19.75 34.850 250 13.40 34.527 17.59 34.712 19.31 34.847 300 12.05 34.470 15.02 34.517 18.09 34.828 400 8.72 34.344 10.70 34.414 15.90 34.707 500 6.11 34.289 8.79 34.359 13.41 34.520 600 4.66 34.289 7.11 34.338 10.47 34.323 700 4.21 34.350 5.73 34.334 8.21 34.250 800 3.84 34.406 4.19 34.383 6.05 34.180 900 3.40 34.438 3.58 34.424 4.93 34.248 1000 3.11 34.473 3.15 34.467 4.31 34.324 1200 2.64 34.520 3.37 34.442
Date
June 11, 1989
June 11, 1989
June 12, 1989
Stn. 4 5 6
Lat. 27°-oo:on 25°-59.'9N 25°-00.'0N
Long.
131°-OO.'OE 130°-59/9E 130°-59/9ETemp. (°C)
Sal. (%o)Temp. (°C)
Sal. (%0)
Temp. (°C)
Sal. (%0)
0 25.56 34.218 26.65 34.729 27.24 34.574 10 25.18 34.488 24.84 34.699 26.44 34.574 20 24.07 34.511 24.54 34.678 24.37 34.523 30 23.56 34.564 23.04 34.651 24.05 34.499 50 22.13 34.726 22.00 34.685 23.20 34.563 75 21.22 34.803 21.23 34.736 21.90 34.726 100 20.75 34.841 20.44 34.828 20.70 34.831 150 20.42 34.851 19.55 34.841 19.82 34.840 200 20.00 34.846 18.60 34.825 18.82 34.833 250 19.28 34.840 17.91 34.819 17.85 34.806 300 18.74 34.839 16.81 34.768 16.49 34.731 400 16.72 34.762 14.47 34.602 14.44 34.598 500 14.47 34.594 11.69 34.413 11.84 34.406 600 11.30 34.380 9.04 34.242 8.61 34.218 700 8.73 34.228 6.90 34.203 7.07 34.221 800 6.96 34.183 5.92 34.293 5.47 34.269 900 6.01 34.263 4.97 34.308 4.39 34.326 1000 4.71 34.329 4.19 34.376 3.62 34.424 1200 3.38 34.443 2.96 34.493 2.96 34.483
Higashi .' The Oceanographic Condition along 131°E
61Date June 12, 1989 June 12, 1989 June 12, 1989
Stn. 7 8 9
Lat. 24°-00.'0N 23°-oo:in 21°-59.'9N
Long.
131°-00.'1E 130°-59.'9E 131°-00.'1ETemp. (°C)
Sal. (%o)Temp. (°C)
Sal. (%o)Temp. (°C)
Sal. (%o)0 28.91 34.464 29.63 34.413 29.96 33.893 10 28.89 34.460 28.82 34.362 29.10 34.006 20 27.74 34.444 28.34 34.342 28.65 34.175 30 27.48 34.480 28.10 34.363 27.32 34.361 50 23.80 34.654 26.09 34.601 26.38 34.540 75 23.00 34.835 24.58 34.662 25.36 34.739 100 22.04 34.820 23.90 34.803 24.50 34.961 150 20.52 34.889 22.40 34.849 22.21 34.993 200 19.12 34.849 20.12 34.863 19.83 34.885 250 18.14 34.830 18.52 34.861 18.12 34.841 300 17.19 34.789 17.10 34.784 17.09 34.787 400 14.24 34.576 14.90 34.620 14.80 34.619 500 11.33 34.373 12.48 34.433 11.87 34.384 600 8.35 34.199 9.54 34.267 9.25 34.242 700 6.41 34.166 7.21 34.187 7.14 34.207 800 4.96 34.237 5.55 34.220 5.84 34.277 900 4.16 34.319 4.50 34.288 4.97 34.323 1000 3.71 34.369 3.88 34.355 3.94 34.382 1200 2.94 34.475 3.10 34.460 3.13 34.466
Date
June 13, 1989
June 13, 1989
June 13, 1989
Stn. 10 11 12
Lat. 20°-59.'9N 20°-00.'2N i9°-oo:in
Long.
131°-00.'0E 130°-59.'8E 130°-59.'9ETemp. (°C)
Sal.
(%o)
Temp. (°C)
Sal. (%o)Temp. (°C)
Sal. (%o)0 29.76 34.201 30.49 34.226 30.70 34.208 10 28.89 34.186 30.18 34.190 30.08 34.198 20 28.60 34.158 29.90 34.174 29.88 34.203 30 28.52 34.168 29.25 34.194 29.34 34.209 50 27.21 34.542 27.17 34.413 28.34 34.250 75 25.59 34.636 26.32 34.634 26.20 34.441 100 24.68 34.703 25.62 34.822 25.43 34.722 150 23.39 34.940 23.27 34.911 22.29 34.842 200 21.14 35.023 20.95 34.974 19.70 34.939 250 18.88 34.903 18.14 34.831 17.44 34.807 300 17.14 34.788 16.43 34.739 15.99 34.711 400 14.00 34.540 13.41 34.492 11.71 34.380 500 10.82 34.317 9.84 34.242 8.72 34.225 600 7.91 34.191 7.54 34.212 7.02 34.218 700 6.32 34.190 6.17 34.247 5.71 34.283 800 5.27 34.299 5.17 34.296 4.86 34.378 900 4.75 34.383 4.42 34.397 4.31 34.445 1000 4.05 34.417 3.95 34.464 3.65 34.483 1200 3.13 34.485 2.98 34.516 2.87 34.540
Date June 13, 1989 June 14, 1989 June 14, 1989
Stn. 13 14 15
Lat. 18°-00.'1N 16°-59.'1N 15°-59.'9N
Long.
131°-00.'0E 130°-00.'3E 130°-59.'9ETemp. (°C)
Sal. (%o)Temp. (°C)
Sal. (%o)Temp. (°C)
Sal. (%o)0 30.36 34.268 29.76 34.090 29.79 34.099 10 30.17 34.259 29.65 34.100 29.69 34.099 20 28.82 34.281 29.59 34.099 29.64 34.100 30 27.83 34.364 29.48 34.103 29.54 34.083 50 26.55 34.469 28.94 34.170 29.31 34.147 75 25.25 34.670 27.10 34.369 28.37 34.211 100 24.19 34.731 25.93 34.547 26.76 34.353 150 22.54 34.981 23.64 34.792 24.46 34.906 200 19.56 34.927 21.20 34.848 21.56 35.007 250 17.52 34.811 18.62 34.850 18.21 34.852 300 15.11 34.622 16.46 34.739 16.26 34.722 400 11.85 34.392 11.98 34.399 12.43 34.427 500 9.09 34.249 8.38 34.272 8.80 34.251 600 6.78 34.206 6.79 34.355 6.95 34.315 700 5.67 34.315 5.68 34.418 5.90 34.405 800 4.77 34.402 5.07 34.471 5.21 34.458 900 4.15 34.461 4.55 34.510 4.68 34.499 1000 3.62 34.521 4.09 34.537 4.20 34.532 1200 2.97 34.576 3.44 34.567 3.44 34.569 Date
June 14, 1989
Stn. 16 Lat. 15°-30:0NLong.
130°-59.'9ETemp. (°C)
Sal. (%o)0 30.36 34.241 10 29.88 34.240 20 29.85 34.274 30 29.76 34.268 50 29.43 34.285 75 27.88 34.179 100 26.86 34.413 150 24.87 34.929 200 21.62 35.090 250 18.85 34.949 300 16.68 34.762 400 12.47 34.426 500 9.16 34.353 600 7.15 34.400 700 6.06 34.427 800 5.12 34.468 900 4.58 34.507 1000 4.11 34.537 1200 3.40 34.568