Micro-meteorological Observations and Studies
over the Sea
著者
TAKAHASHI Tadao
journal or
publication title
鹿児島大学水産学部紀要=Memoirs of Faculty of
Fisheries Kagoshima University
volume
6
page range
1-46
別言語のタイトル
海上微細気象の観測及び研究
Micro-meteorological Observations
and Studies
over the Sea
by
Tadao TAKAHASHI
Abstract
Observed data — wind speed, temperature, and vapour pressure at 5 levels above the sea surface
up to the 400cm height, evaporation from the sea surface, and wind wave elements — obtained at
Kagoshima Bay during 1953-1956 are given in Part I.
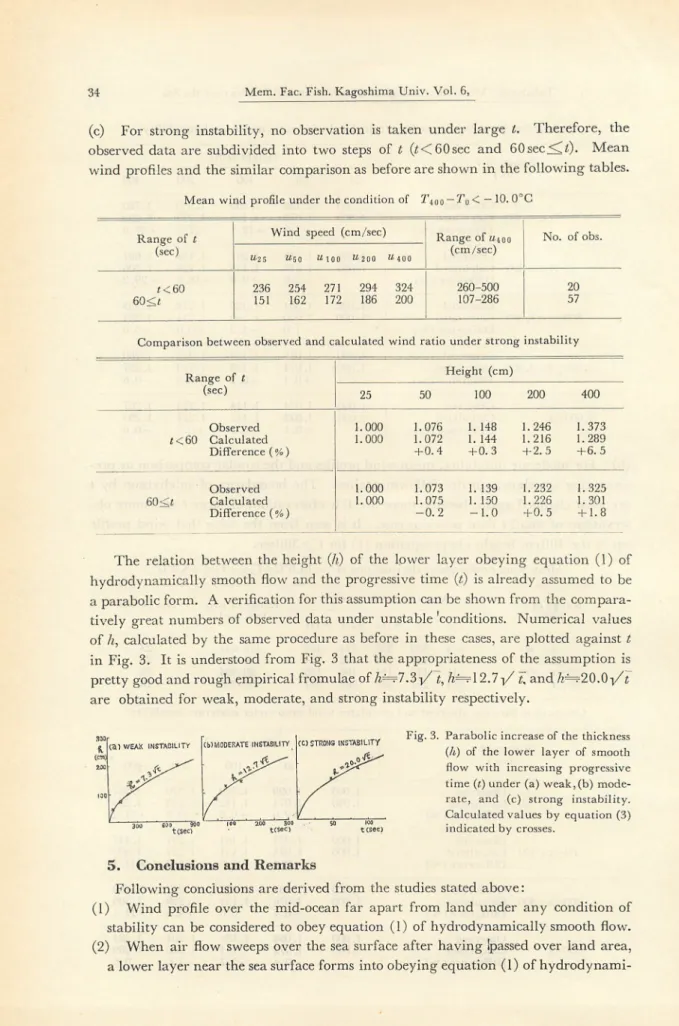
In Part II, it is concluded that the layer of hydrodynamically smooth flow, surmounted with
the hydrodynamically rough flow of land origin, exsists always near by the sea surface, and that
the thickness (/;,) of the lower layer of smooth flow can be expressed by a rough empirical formula
of h=a-\/T, where t is progressive time (ratio of fetch and wind speed at 400cm height) and a is a
constant depending upon stability condition, i.e. a = 3.1 (under stable condition)~20.0 (under
strong instability).
The critical values of friction velocity for the first formation of wind waves and the generation
of whitecaps are determined empirically as 3.7cm/sec and 17cm/sec respectivelyin Part III; and
humidity profiles and evaporation from the sea surface are discussed in Part IV.
Contents
Introduction.
Part
I. Micro-meteorological Observations at Kagoshima Bay during 1953-1956.
1. Method of observation.
2. Observed data.
Part
II. Wind Profiles over the Sea not far apart from Land.
1. Historical note.
2.
Wind profiles under neutral condition of stability.
3.
Wind profiles under stable condition.
4.
Wind profiles under unstable condition.
5. Conclusions and remarks.
Part III. Wind Profiles and Wind Waves.
1. Introduction.
2.
Critical friction velocity for the first formation of wind waves.
3.
Generation of whitecaps.
4.
Friction velocity and wave length and height.
5. Conclusion.
Part IV. Humidity Profiles over the Sea and Evaporation from its Surface.
1.
Humidity profiles over the sea.
2.
Evaporation from the sea surface.
3. Conclusion.
Acknowledgement.
References.
Introduction
It is noticed recently that the lowest layer of the atmosphere next to the sea sur
face up to several meters, as well as next to the ground surface, is a quite special
region where comparatively weak wind and less austausch prevail. Detailed studies
on phenomena occurring in this layer are desired as micro-meteorological problems.
2
Mem. Fac. Fish. Kagoshima Univ. Vol. 6,
Micro-meteorological studies over the sea have such an advantage that a physical treat
ment is comparatively easy owing to physically simple character of sea surface. On
the other hand, observed data over the sea are less numerous than over the ground,
due to increased difficulties in observations.
From this point of view, the author
have carried out micro-meteorological observations over the sea at Kagoshima Bay
and attempts to get new knowledge concerning the problems of wind profile and
evaporation and so on which give rise to discussion in this branch of meteorology.
Part I
Micro-meteorological Observations at Kagoshima Bay
during 1953-1956.
1.
Method of Observation.
Observing levels of 25, 50, 100, 200, and 400cm above the sea surface are con
veniently selected for measurements of wind speed, air temperature, and vapour pres
sure.
Surface water temperature, evaporation, wave length, wave height, and wave
period are also observed.
Thermocouple anemometers (S. Kawata and others1'), which are always free from
the effect of temperature of ambient air, are used for wind speed measurements, keep
ing their hotwire in plumb line to prevent them from the effect of the variation of
wind direction. Detailed type of them made and used by the author for the practical
purpose is somewhat different from Kawata's type, but it is quite same in principle.
Reading in millivoltmeter (5mV in full scale) is converted into wind speed (cm/sec)
by means of calibration curves, obtained from careful experiments in our laboratory.
In actual observations over the sea, thermocouple anemometers mounted at 5 levels
are connected with a switch board and a millivoltmeter. Average values for 30 seconds
for each anemometer are read in turn, and these measurements are repeated 4 times
successively.
Mean values of these four 30 second averages for each specified level
are calculated and are regarded as the wind speed at the specified levels. Since it takes
10 minutes during the observations stated above, mean wind speed during the iden
tical 10 minutes are measured simultaneously with cup anemometers (one contact for
ca 50m of air flow) at three levels mostly (100, 200, and 400cm excepting the early
observations).
One of cup anemometers is calibrated in the wind tunnel in Meteor
ological Agency of Japan and others are calibrated on the roof of Kagoshima Me
teorological Observatory and our laboratry comparing with standard ones.
For temperature and vapour pressure measurements, a set of dry and wet thermo
piles (12 couples of copper-constantan) is used at 25 and 50cm levels successively and
Assmann's aspiration psychrometers at 50, 100, 200, and 400cm levels.
One side junction of thermopile, shaped like a comb and eqipped with a radia
tion shield, is mounted at a observing level; while the other side, sealed with paraffin
wax into 12 small glass tubes, is floated at the sea surface, maintaining the glass tubes
vertical to the surface by a float (wooden frame supporting the glass tubes) and a
sinker.
The temperature difference between air and water is read directly in milli
Takahashi: Micro-meteorological Observations and Studies over the Sea
3-order of 0.1 C) by means of calibration curves.
Air temperature is obtained from
this temperature difference and from the surface water temperature, simultaneously
observed with a mercury thermometer graduated at every 1/1 O'C. Average values
for 30 seconds are read twice at two levels in turn. Mean values of these two averages
for each specified level are employed as temperature data at the specified levels.
As-smann's p?ychrometers are read after 3 minute aspiration.
When the two different
instruments give different values for the same level of 50cm, the values obtained with
thermopile are rejected.
For evaporation measurements, a pan is used.
This is a cylindrical vessel (20cm
in diameter and 25cm in depth) equipped with a small wooden float surrounding its
body.
Containing the neighbouring sea water of 13cm deep to be evaporated, it is
floated on the sea surface, after the float is adjusted to keep the inside water level as
nearly same as outside sea level.
To protect the pan from inundation due to waves,
it is moored to the inside of a floating square frame (2m in side) without floor and
with sinkers, locating at a nearly central point of the frame.
Six hours later, the
decrease of the contained water in the pan is measured with a common rain measur
ing glass.
Water temperature inside of the pan agreed always with that of the outside of
even the frame, but the exposure of the contained water to be evaporated is not under
the natural condition owing to the edge of the ^>an and the frame. The disturbances
of the inside water are of course much less than those of outside water.
Another cylindrical pan (20cm in diameter and 10cm in depth) containing the
neighbouring sea water of 2cm deep, in the interest of comparison, is exposed on the
deck of the observing boat and the decrease of the contained water for 6 hours is
measured with the rain measuring glass.
To measure the wave length, waves are photographed including two scales, crossed,
perpendicularly to each other and suspended horizontally at a short distance above
wave crests. It is obvious that the wave length (L) is given by the relation of
t
I
•
i
i m\
~N sm ^tan
"7"
when portions of the two scales covering N waves are I cm and m cm in length
respectively.
When wave length exceeds about 200cm, aditional measurements are
made by the well-known usual method estimating wave length on the basis of observ
ing ship's length.
To observe wave height and period, a floating scale of well-known Froude's type
is used.
The heights and numbers of successive individual waves passing through
the location of the scale during one minute are measured by naked eyes, and then
mean height and wave period are calculated.
For very short waves, average height
is estimated directly, because individual wave heights cannot be observed by this
primitive way.
2.
Observed Data
Mem. Fac. Fish. Kagoshima Univ. Vol. 6,
in the following table.
All instruments are calibrated carefully in our laboratory
before and after each series of observations.
When the calibration curves obtained
after a specified series of observations disagree with those before the observations, the
specified series of observed data are all rejected.
(These series are not included in
the table.)
130 30E
3WN
3!'30'N
-I3030'E
I30"40'E
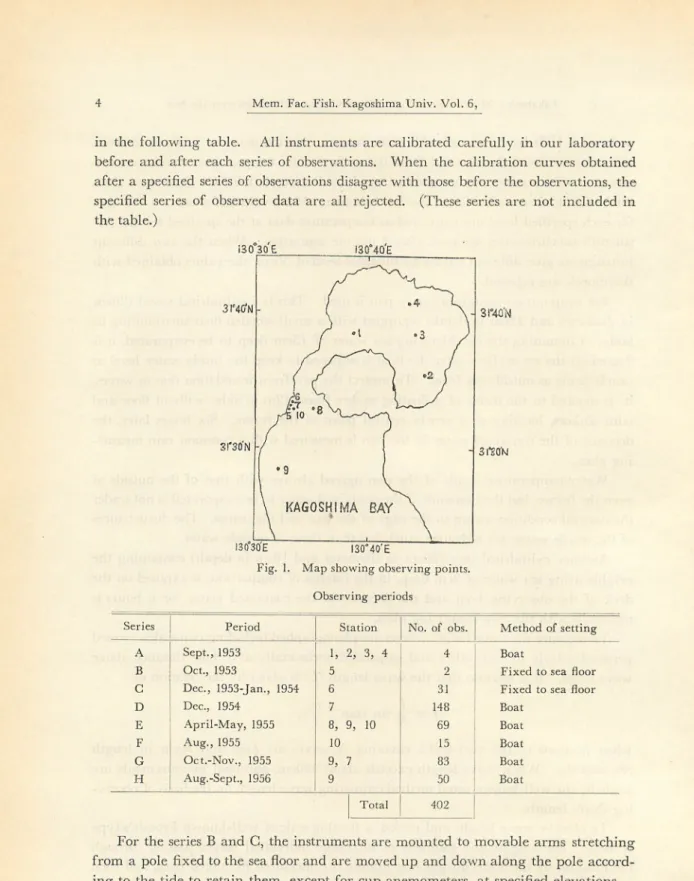
Fig. 1. Map showing observing points.
Observing periods
i30°40E
3l°40'rt
3 rso'N
Series Period Station No. of obs.
Method of setting
A
Sept., 1953
1, 2,
3,
4
4 BoatB
Oct., 1953
5 2 Fixed to sea floorC
Dec, 1953-Jan., 1954
6 31 Fixed to sea floorD
Dec, 1954
7 148 Boat EApril-May, 1955
8,
9,
10
69 Boat FAug., 1955
10 15 Boat GOct.-Nov., 1955
9,
7
83 Boat HAug.-Sept., 1956
9 50 Boat Total 402For the series B and C, the instruments are mounted to movable arms stretching
from a pole fixed to the sea floor and are moved up and down along the pole accord
ing to the tide to retain them, except for cup anemometers, at specified elevations.
For other series, observations are made on a small fishing boat (9m in length),
which is moored to three buoys (glass ball of ca 40cm in diameter) connected respecti
vely to dropped three anchors surrounding the boat.
The instruments are mounted
to arms stretching outerward from a pole set up specially for the present purpose at
a corner of its stern.
The stern has been kept formost to wind during observations,
Takahashi: Micro-meteorological Observations and Studies over the Sea
5
adjusting the lengths of rope from the boat to the buoys and also the locations on the
boat connecting the ends of the ropes.
It took only 1-5 minutes to complete this
procedure of keeping the stern windward at a shift of wind or tidal current. Fur
thermore, to get more reliable data, the boat is equipped specially with a sea-anchor
preventing it from undesirable tossing, though the weighty engine lying at the center
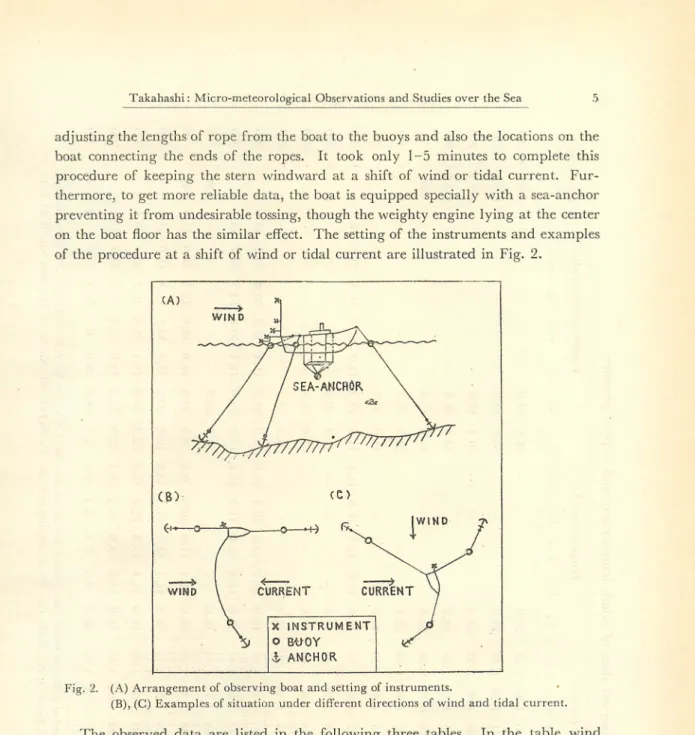
on the boat floor has the similar effect. The setting of the instruments and examples
of the procedure at a shift of wind or tidal current are illustrated in Fig. 2.
(A)
CB)
(+.
O
*.
WifJD CURRENT X INSTRUMENT O B-trOYi
ANCHOR
Fig. 2.
(A) Arrangement of observing boat and setting of instruments.
(B), (C) Examples of situation under different directions of wind and tidal current.
The observed data are listed in the following three tables.
In the table wind
speed, temperature, and vapour pressure are denoted by u (in m/sec), T (in C), and
e (in mb) respectively.
Subscripts indicate specified observing heights (cm) above
the sea surface, T0 is the surface water temperature, and eo is saturation vapour pres
sure at the sea surface and is obtained from the saturation value corresponding to the
surface water temperature multiplied by a constant of 0.98 for its lowering due to
salinity.
Values in bracket in wind speed column are obtained with cup anemo
Observed
data
of
wind,
temperature,
and
vapour
pressure
Time St.Wind
speed
(m/sec)
Temperature
(°C)
Vapc
ur
pressure
(mb)
Wind Fetch No. i Date "25 U Z-. 0 U 3 o 0 U 2 0 0 U 4 f) 0To
r25
T5
o
Ti
o
o
^200
1\an
e0 e»5 <?so Pino ^2 0 0 <?400 dir.(m)
1952 h m1
Sept.
8 11.00 13.00 1 2 1.00 1.32 1.05 1.10 1.16 1.20 1.38 1.44 1.58 2.30 28.9 — — — — 28. 5 39.0 N N E E SE10,
200
2 If 29.0 — — — — 30.0 39. 32,700
3 It // 13.30 3 1.63 1.75 1.86 1.88 2.02 29.0 — — — — 30. 1 39.3 E S E5,800
4 It // 14.30 4 0.94 1.00 1.05 1.12 1.22 28.8 — — — — 30.5 38. 8 E SE9,000
5 Oct. 30 16.30 5 0.21 0.23 0.26 0.30 0.38 22.8 — — — — 21.0 27.2 — — — — — calm — 6 It If 17.00 // 1.01 1.12 1.22 1.40 1.68 22.8 — — — — 20.2 27.2 N 180 7 Dec. 23 11.20 6 0.97 1.08 1.14 1.31 1.50((1.0))*
((1.4J
18.0 — — — — 11.0 20.2 — — — — — N 200 8 n // 12. 10 ii 1. 15 1.35 1.42 1.65 1.92((1.4))
((1.8))
18.0 12.0 11.9 11.8 11.7 11.6 20.2 12.0 11.7 11.4 10.4 10.2 N 200 9 a // 12.40 a 1.64 1.97 2.35 2.58 3.01((2.
3))
((2.
8))
18.0 — — 11.8 20.2 N 200 10 a 24 10.20 it 0.84((0.
8))
0.89 0.95 0.96 1.07((0.9))
((1.0))
17.9 — 7.8 20. 1 N 200 11 a // 10.40 a 1.22 1.30 1.44 1.50 1.60(1.3)
((1.4))
((1.6))
18.0 — ~ 8.0 20.2 N 200 12 n // 11.30 it 2.07 2.35 2.70 3.18 3.63 18.0 10.7 10.2 10.1 10.0 9.0 20.2 11. 1 10.8 10.8 10.8 10.6 N 200((2.
5))
((3.
0}
((3.
6))
13 n If 12.00 n 2.39((2.
5))
2.95 3.40 3.82 4.44((3.
7))
(4.
3)
17.8 11.8 12.0 11.3 10.6 11.0 20.0 11. 1 10.8 10.7 10.7 10. 7 N 200 14 ii 25 09.00 it 0.90((0.9))
0.95 0.98 1.13 1.34((1.0))
((1.3))
18.0 — " 9.2 20.2 NW 90 15 ii // 09.30 a 1.20((1.2))
1.30 1.38 1.55 1.76((1.4))
((1.7))
18.0 11. 1 11.0 10.3 9.6 9.5 20.2 12.9 12.6 12.1 11.5 11.4 NW 90 16 ii if 10.30 11.30 it 1.09((1.0)
0.70 1.13 1.20 1.36 1.51((1.2)
((1.5))
0.80 0.83 1.05 1.29 18.0 12. 1 12.2 11.5 10.8 10.8 20.2 20.2 12.4 13. 1 12. 1 11.7 11.0 11.0 10.6 N N 200 17 18.0 13.4 13.5 12.9 12.3 12.3 12.6 11.7 10.7 200 18 it if 12.10 it 0.80 0.85 0.88 1.02 1.15 18.0 13.8 13.9 13.5 13. 1 12.9 20.2 13.0 12.4 11.7 11.1 11. 1 N 200 19 1954 08.20 it 1.24 1.33 1.42 1.51 1.56 16.7 9.0 7.4 6.3 6.3 5.6 18.6 10.0 8.5 7.7 7.6 7.4 NNE 400Jan.
60.2))
(1.4)
((1.5))
•
Values
in
double
bracket
are
obtained
at
different
levels
(cm),
which
are
as
follows:
No.
7,60,270;
No.
8,
80,
290;
No.
9,90,300;
No.
10,40,
130,380;
No.
11,
140,390;
No.
12,70,
160,410;
No.
13,30,
150;
No.
14,40,
160,410;
No.
15,20,
140,390;
No.
16,20,
140,390;
No.
19,20,350;
< oObserved data of w
nd,
temperature,
and
vapour
pressure
(Continued)
Date Time St. Wind <peed
(m/sec)
Temperature
(°C)
Vapour
pressure
i
mb)
Wind Fetch No. dir. (ml "25 "50 "10 0 "200 " 400T0
T2i
r60
jTioo
7*200
T
400
eo 62 5 650 6100 62 0 0 6400 1954 h m 20Jan.
6 09.10 6 0.99 1.08((1-0))
1.11 1.29P-l))
1.30((1.3))
17.0 11.7 11.5 10.7 10. 1 9.8 19.0 10.7 9. 1 7.9 7.8 8.0 NNE 400 21 " '/ 10. 10 <! 1.00 1.09(1.1)
1.16 1.23((1.2))
1.330.3))
17.0 12.7 12.5 11.9 11.9 11.8 19.0 8.5 8.0 7.4 7. 1 7.0 NNE 400 22 '/ ii 10.50 it 1.40 1.48 1.67 1.72 1.87 17.3 12.8 12.7 12. 1 12. 1 11.8 19.3 8.8 8.0 7.0 7.0 7.0 NNE 400C1.5S
((1.6))
((1-8))
23 '/ 7 08. 10 ti 2.05 2.12((2.
0))
2. 30 2. 591(2.
3))
2.95((2.9)1
16.8 9.4 9.2 9. 1 9. 1 9.0 18.7 9.4 8.9 7.9 7.9 8.3 NNE 400 24 if // 09.00 it 2.45 2.62((2.
5)1
2.77 3.08((2.
9)1
3.471(3.
3)1
16.8 9.4 9.2 9.3 9.3 9.0 18.7 9.8 9.2 7.8 7.5 7.6 NNE 400 25 ii // 10.00 it 2. 20 2. 34(2.2)
2.47 2.8312.
6)1
3.20(3.2)
17.2 11.3 11. 1 11.3 11. 1 10.5 19.2 9.9 8. 1 7.2 6.4 6.8 NNE 400 26 'I n 10.40 ti 2. 86 3. 04(3.
1)
3. 24 3. 641(3.
6)1
3.941(4.
0)1
17.2 11.6 11.4 11.3 11.0 10.4 19.2 8.0 7.3 7. 1 6.4 6.2 NNE 400 27 it it 11.30 it 2.45 2.59('2.
2. 83 3. 237)1
('3.1)1
3.601(3.
6)1
17.2 11.8 11.5 11.2 11. 1 11.0 19.2 7.2 6.6 6. 1 6.0 6.0 NNE 400 28 it 8 09.00 a 5. 50 5. 85 6. 20 6. 58((6.
5)1
5. 44 5. 72 7.35 16.3 11. 1 10.7 10.9 10.9 10.8 18.2 10.3 10.2 10.0 9.9 10.0 NE22,
500
29 ii '/ 09.30 •I((5.
8,1
4.90 5.15 6. 13 16.4 11.9 11.2 11. 1 11.0 11.0 18.3 11.6 11.8 9.9 9.4 9.5 NE22,
500
30 n '/ 10.00 n1(4.
9,)
4.31 4.481(5.
8;)
4.80 5.12 5.36 16.4 12.6 12.2 11.3 11.4 11.3 18.3 10.7 9.9 9.8 9.6 9.3 NE22,
500
31 it n 10.50 n((4.
3?
4.68 5.07i'5.
n
5. 29 5. 70 6.01 16.2 12.7 12.5 12.2 11.8 11.8 18.0 10.7 9.2 9.7 9.3 9.3 NE22,
500
32 ti ii 11.40 ti(5.0)
3.83 4.07('4.
1)1
1(5.
8)1
4. 34 4. 561(4.
7)1
4.85 15.9 12.9 12.8 12.7 12.6 12.6 17.7 10.6 10.2 10.0 9.9 9.9 NE22,500
33 ti ii 12.00 it 2. 28 2.49 2. 59 2. 761(2.
8))
2.21 2.52 2.93 16.0 — — — — 12.8 17.8 NE22,
500
34 ll 14 13. 3C a((2.
5;)
1.49 1.85 2.84 17.4 15.6 15.2 14.8 15.0 14.8 19.5 13.9 12.8 11.7 11.7 11.2 NNW 1201(2.0))
1(2.
4)1
((2.
9)1
35 'I v 14. 1C n 1.77 2.01 2. 30 2. 75 3. 181(3.
2)1
1.98 17.4 15.0 14.8 14.7 14.6 14.6 19.5 13.3 12.5 11.9 11.6 11.5 NNW 120 36 a // 15.0C a((2.
1;)
0.91 1.20 1.55 1.69 17.3 15.4 15.2 15. 1 14.8 15.0 19.3 13.0 11.9 11.6 11.2 10.9 NNW 120 37 ii ti 15. 3C a1(1.2)1
2.23 2.74(2.9)
1(1-7)1
3.24 4.02((3.
9))
((1.9))
4.67((4.
8))
17.3 — — — — 14.7 : 19.3 NNW 120 38 Dec. 15 15.0C 7 2. 60 3. 30 3.65 4.11(3.6)
(4.1)
4.61(4.7)
18.9 11.2 11.2 11. 1 11.2 11.0 21.4 9.0 8.5 8.2 8.5 8.4 NNW 160 39 it it 16.01 n 2.51 2.70 2. 84 3. 29 3.62 18.9 9.7 9.6 9.5 9.4 9. 1 21.4 8.7 8.9 8.2 6.9 5.9 N 200(2.9)
(3.3)
(3.5)
•»0
40
120
370;
No
21,140,390;
No.
22,
70,
170,
420;
No.
23,
40,
140,
390;
No.
24,40,
140,
390;
No.
25,
150;
No.
26,
170,420;
No.
27,
70,
190,
440;
No.
28,
30,210;
No.
29,
30,
210;
No.
30,
30,
220;
No.
31,
240;
No.
32,
60,
250;
No.
33,
70,
250;
No.
34,
60,
160,410;
No.
35,
70,
420;
No.
36,
40,
180,430;
No.
37,
190,440;
o C a.Observed
data
of
wind,
temperature,
an
d
vapour
pressure
'Continued)
No. Time St.Wind
speed
(
m/sec)
Temperat
ure
(°C)
Vapoure
pressure
(mb)
Wind Fetch Data "25 "50 "too "200 "400To
Tn
r50
T]
0
0
J 200T
400
60 62 5 e5o 610 0 62 0 0 6400 dir.(m)
1954 h m 40 Dec. 15 18.00 7 1.07 1. 15 1.271.3)
1.35 1.48(1.3)
(1.4)
18.8 6. 1 6. 1 6.2 5.7 5.9 21.3 7. 1 7.0 6.4 7.2 6.3 NNW 160 41 it // 19.00 it 1.30 1.49 1.571.5)
1.67 1.78(1.7)
(1.8)
18.9 4.8 4.3 4.7 4.5 4.5 21.4 6.8 7. 1 7.4 7.4 6.7 NNW 160 42 ti n 20.00 ti 1.39 1.41 1.561.6)
1.70 1.76(1.7)
(1.8)
18.7 — 4.2 4. 1 4.0 4. 1 21. 1 7.8 7.3 7.8 6.0 NNW 160 43 it t/ 21.00 n 1.66 1.72 1.871.8)
1.95 2.09(1.9)
(2.0)
18.6 — 2.7 2.6 2.5 2.4 21.0 7.8 7. 1 6.5 6.7 NNW 160 44 it if 22.00 it 2.28 2.45 2.602.6)
2.77 3.15(2.8)
(3.1)
18.6 — 2.7 2.2 1.7 2.2 21.0 6.7 6.7 6.7 6.9 NNW 160 45 it it 23.00 it 2. 12 2.23 2.382.3)
2.66 2.97(2.6)
(2.9)
18.6 — 4. 1 3.2 2.3 2.7 21.0 7.3 6.8 6.4 6.6 NNW 160 46 ti 16 00.00 it 1.53 1.60 1.80 1.7) 1.75 1.87(1.8)
(1.8)
18.6 — 3.4 3. 1 3. I 2.8 21.0 -. 7.3 7.0 6.4 6.0 NNW 160 47 it // 01.00 n 1.59 1.63 1.861.9)
1.96 2.08(2.0)
(2.0)
18.5 — 4.3 4.0 4.3 3.8 20.9 7.2 7.0 6.8 6.6 NNW 160 48 it n 02.00 a 1.77 1.91 2.062.0)
2. 20 2. 35(2.2)
(2.3)
18.5 — 4.5 4.3 4. 1 4.0 20.9 8.3 7.3 6.3 6.5 NNW 160 49 " a 03.00 a 1.20 1.45 1.49'1.4)
1.47 1.64(1.5)
(1.6)
18.3 — 5.5 5.0 4.5 4.7 20.6 __ 8.2 7.5 6.7 6.7 N 200 50 a it 04.00 a 1.41 1.46 1.63'1.6)
1.65 1.69(1.6)
(1.7)
18.4 — 5.3 5.0 4.7 4.7 20.7 8.6 7.5 6.3 6.4 NNW 160 51 it " 06.00 it 1.37 1.42 1.50;i.4)
1.61 1.67(1.6)
(1.6)
18.6 — 4.4 4.3 4.2 4.2 21.0 8. 1 7.4 6.8 6.5 NW 150 52 it it 07.00 tt 1.35 1.65 1.611.7)
1.93 1.95(1.8)
(1.9)
18.7 — 3.4 3.4 3.4 3.3 21. 1 " 8.4 7.4 6.5 6.4 NNW 160 53 it if 08.00 it 1.37 1.44 1.61'1.6)
1.75 1.80(1.7)
(1.8)
18.6 — 4.3 3.9 3.5 3.3 21.0 7. 1 7.0 6.9 6.4 NW 150 54 it ti 09.00 a 1.16 1.20 1.33'1.3)
1.35 1.55(1.3)
(1.6)
18.8 — 11.5 10.6 9.7 9.5 21.3 ' 10.0 9. 1 8.2 7.6 NW 150 55 it' ii 10.00 it 0.50 0.48 0.51(0.3)
0. 54 0. 60(0.5)
(0.7)
19. 1 — 14.2 12.8 11.4 11.2 21.7 _ 14. 1 11.6 9. 1 8.3 NW 150 56 it ii 11.00 tt 1.08 1.25 1.22'1.2)
1.39 1.48(1.5)
(1.5)
19.0 — 16.0 14.0 12.0 11.8 21.5 ~~~ 10. 1 9.3 8.4 8.4 NW 150 57 it it 12.00 a 0.67 0.74 0.88'0.8)
0. 85 0. 90(0.8)
(0.9)
19.0 — 12.6 12.6 12.6 12.4 21.5 10.5 9.2 7.9 7.9 NE22,
700
58 it a 13.00 n 0.80 0.89 1.01'1.0)
0.99 1.07(1.0)
(1.1)
18.9 12.8 12.9 12.4 12.1 12.2 21.4 9.5 9.4 9.5 9.4 9.2 NE22,
700
59 it ii 14.00 a 1.39 1.46 1.631.6)
1.72 2.01(1.7)
(2.0)
18.8 13.5 13.3 13.5 13.1 13. 1 21.3 10.0 9.6 9.2 9.0 8.7 N 200 60 ti 17 09.00 it 3.38 4. 13 4.71'4.7)
5.39 6.15(5.5)
(6.
1)
18.7 11.0 10.6 10. 2 9.8 9.5 21. 1 9.9 9. 1 8.3 6.8 6.5 N 200g
<Observed data of w
nd,
temperature,
and
vapour
pressure
^Continued)
Date Time St.Wind
speed
(m/sec)
Temperature
(°C)
Vapour
pressure
(
mb)
Wind dir. Fetch No.(m)
"25 "50 "100 "200 "400To
r25
7*50
T\oo
T200
T
400
60 e2 5 cso eioo 6200 6400 61 1954 Dec. 17 h m 10.00 7 3.293.87
4.32
5.04
5.53
(4.3)
(5.0)
(5.5)
18.8 13.4 12.5 11.6 10.6 11.2 21.3 11.6 9.4 7.2 6.5 7.2 N 200 62 ii If 11.00 2.853.05
3.58
3.96
4.50
(3.5)
(4.0)
(4.5)
18.8 12. 1 11.6 11.7 11.6 11.4 21.3 8.2 8. 1 6.3 6.6 6.4 NW 150 63 it If 12.00 3. 16 3.35 3.78 4.24 4.66(3.7)
(4.2)
(4.7)
18.4 15.7 13.7 12.4 11.4 11.6 20.7 11.4 9.5 8.3 7.6 7.4 N 200 64 ii If 13.00 2.712.88
3.06
3.50
3.92
(3.0)
(3.5)
(3.9)
18.6 12.9 12.9 12.9 11.8 12.6 21.0 7.7 7.5 7.4 7.3 7.0 N N 1', 450 65 n If 14.00 2.35 2.52 2.78 2.90 3.07(2.7)
(2.9)
(3.0)
18.0 13.5 13.2 13.5 12.7 12.4 20.2 8.4 7.2 6.0 6. 1 5. 1 NE22,
700
66 ti If 15.00 2. 11 2.24 2.39 2.67 3.13(2.4)
(2.7)
(3.
1)
18.4 15.0 14.4 13.8 13.2 12.8 20.7 9.5 8.7 7.9 6.5 6.2 N 200 67 u * 16.00 1.421.59
1.65
1.91
2.16
(1.6)
(2.0)
(2.
1)
17.8 13.0 12.4 12.2 12.0 11.8 20.0 7.9 7.5 7.0 6.8 6.6 NNW 160 68 it ti 17.00 1.29 1.35 1.44 1.52 1.67(1.4)
(1.6)
(1.6)
18.4 11.0 10.8 10.6 10.4 10.2 20.7 8.3 7.9 7.4 6.2 6.2 NW 150 69 ii if 18.00 1.32 1.42 1.48 1.64 1.70 18.7 8.8 8.5 8.2 8. 1 8.4 21. 1 8. 1 7.8 7.5 7. 1 7.2 NNW 160 70 it if 19.00 1.45(1.4)
(1.6)
(1.6)
1.43 1.61 1.70 1.79(1.5)
(1.7)
(1.7)
18.4 7.9 7.4 -6.9 6.9 6.8 20.7 8.7 8. 1 7.6 7.4 7.6 NW 150 71 tt ir 20.00 1.62 1.66 1.90 2.09 2.12(2.0)
(2.0)
(2.1)
18.4 6. 1 5.6 5. 1 5. 1 5.4 20.7 8.9 8. 1 7.3 7. 1 7.3 NW 150 72 ii if 21.00 1.66 1.86 1.98 1.95 2.14 18.5 5.6 5.3 5.0 4.8 4.8 20.9 8.7 7.9 7. 1 7.2 7.0 WNW 150 73 it i/ 22.00 1.55(1.9)
(1.9)
(2.1)
1.69 1.71 1.84 2.01(1.8)
(1.8)
(2.0)
18.7 5.0 4.4 3.8 3.5 3.4 21. 1 8.7 7.9 7.0 6.9 6.6 NNW 1C0 74 n it 23.00 1.90 1.95 2.17 2.17 2.42(2.
1)
(2.
1)
(2.5)
18.7 5.0 4.6 4.2 4.5 5.0 21. 1 8.2 7.7 7.3 7.0 7.2 NW 150 75 •I 18 00.00 3.263.57
3.74
4.13
4.59
(3.8)
(4.1)
(4.5)
18.6 7.2 6.2 5.4 5.4 4.4 21.0 8.4 8.2 7.9 7.6 7.2 NW 150 76 n if 01.00 1.69 1.80 1.91 2.04 2.16(1.9)
(2.0)
(2.2)
18.3 5.3 5.2 5. 1 4.8 4.8 20.6 7.7 7.6 7.4 7.0 7.0 W 170 77 ii ti 02.00 2. 17 2.29 2.41 2.76 3.18(2.5)
(2.7)
(3.
1)
17.9 5.4 5.2 5.2 4.8 4.6 20. 1 7.6 7.3 7. 1 6.8 7.0 NW 150 78 n ii 03.00 1.97 1.90 2.11 2.27 2.45(2.
1)
(2.2)
(2.5)
17.01
3.8 3.5 3.8 3.3 3.6 19.0 7. 1 7.0 6.9 6.7 6.6 NW 150 79 a n 04.00 2. 19 2.23 2.54 2.64 2.77 17. 1 5.5 4.9 3.6 3.0 2.7 19. 1 7.7 7.3 6.8 6.4 6.3 NW 150 80 ti if 05.00 1.59(2.6)
(2.5)
(2.8)
1.56 1.77 2.01 1.99 17.2 4.0 3.8 3.6 3.3 3.3 19.2 8.2 7.5 6.8 6.8 6.7 NW 150 81 it if 06.00 tt 2.07(1.6)
(1.9)
(1.9)
2.31 2.38 2.38 2.51(2.2)
(2.3)
(2.4)
17.7 3.3 2.8 2.3 2.0 1.8 19.8 7.6 7. 1 6.6 6.4 6. 1 W 170 o c a.No. 82 83 84 85 86 87 88 89 90 91 92 93 94 95 96 97 98 99 100 101 102 Date 1954 Dec. 18 ii if II v a a n a 'i V ii it ti a ii it n it 'i ii •i if if Time h m 07.00 08.00 09.00 10.00 11.00 12.00 13.00 14.00 15.00 16.00 17.00 18.00 19.00 20.00 21.00 22.00 23.00 00.00 01.00 02.00
'/1
04.00
St.Observed
data
of
wind,
temperature,
and
vapour
pressure
(Continued)
Wind
speed
(m/sec)
2.45 1.55 3.33 1.92 2.04 1.86 1.45 2. 15 1.95 0.41 1.45 1.51 1.55 1.58 1.60 1.65 1.49 2. 13 1.58 1.53 1.61 "50 "100 "200 "400 2.50 2.71(2.7)
1.75(1.8)
3.82(3.9)
2.30(2.3)
2.35(2.3)
2. 18(2.1)
1.65(1.6)
2.44(2.3)
2.20(2.2)
0.40(0.3)
1.61(1.6)
1.70(1-7)
1.68(1.6)
1.85(1.8)
1.85(1.8)
1.80(1.8)
1.66(1.6)
2.40(2.4)
1.84(1.8)
1.62(1.6)
1.84(1.8)
1.64 3.51 2. 14 2. 18 2.03 1.54 2.25 2.02 0.38 1.60 1.47 1.52 1.77 1.65 1.69 1.69 2.32 1.77 1.60 1.70 2.86(2.9)
1.83(1.9)
4.35(4.4)
2.56(2.6)
2.58(2.5)
2.47(2.5)
1.78(1.8)
2.64(2.7)
2.35(2.3)
0.53(0.5)
1.69(1.6)
1.70(1.8)
1.80(1.9)
1.94(2.0)
1.87(1.9)
1.95(1.9)
1.85(1.8)
2.58(2.5)
2.07(2.0)
1.81(1.8)
1.97(1.9)
3.07(3.1)
2.01(2.0)
4.93(4.9)
2.93(2.9)
3.00(3.0)
2.78(2.7)
1.87(1.8)
3.05(3.0)
2.65(2.6)
0.57(0.5)
1.84(1.8)
1.86(1.8)
1.92(1.9)
2.08(2.0)
2.02(1.9)
2.09(2.0)
1.95(2.0)
2.73(2.7)
2. 14(2.1)
1.95(1.9)
2.08(2.1)
Temperature
(°C)
T0
T2
18.3 18.0 18.4 17.4 17.0 17.4 17.8 17.9 18. 1 17.6 18.0 18.2 18. 1 18.6 18.5 18.5 18.4 18.5 18.5 17.9 18.4 3. 1 6.3 13.8 13.8 13.5 12.8 15.0 15.9 16.2 16.0 13.4 12.5 10.8 9.7 8.0 7.3 8.4 8.0 8.5 8.5 9.4 50 3. 1 5.3 12.6 13.0 13.3 12.7 14.8 15.8 16.0 15.8 13.9 12.2 10.8 9.6 7.8 6.9 8.0 7.9 8.2 8.5 9.2 r. 2.2 4.3 11.4 12.2 13.5 12.6 14.6 15.9 15.8 16.0 13.4 11.9 10.8 9.5 7.6 6.6 7.6 7.3 8.0 8.2 1.8 3.7 11.3 11.9 12.5 11.9 13.9 15.0 15.7 16.2 13.7 11.6 10.2 8.8 7.2 6.5 6.8 6.7 7.0 7.5 8.2^4
0
1.6 3.0 11.2 12.0 12.3 11.7 13.9 14.9 15.6 15.8 13.3 11.4 10.0 8.5 7.0 6.7 6.6 6.2 7.2 7.3 7.9 eo 20.6 20.2 20.7 19.5 19.0 19.5 20.0 20. 1 20.3 19.7 20.2 20.5 20.3 21.0 20.9 20.9 20.7 20.9 20.9 20. 1 20.7Vapour
pressure
(mb)
62 5 650 6100 62 0 0 e40o 7.3 8.3 14.6 12.8 12.3 12.7 11. 1 13.4 11.8 12.2 12.4 11.8 11. 1 10.7 9.7 9.7 10.4 10.2 10.4 9.4 10.8 7.3 8.0 12.8 11.9 11.9 12. 1 10.9 12.4 11.5 11.8 12.3 11.4 10.8 10.5 9.5 9.0 10.0 10. 1 10.2 9.8 10.8 6.6 7.7 11.0 11. 1 11.4 11.6 11. 1 11.4 11.8 11.3 12. 1 11.0 10.5 10.3 9.2 8.8 9.6 9.4 9.6 9.9 10.2 6.5 7. 1 10.5 10.4 10.7 11.6 10. I 10.6 11.4 10.7 11. 1 10.3 10. 1 9.6 9. 1 8.8 9. 1 8.6 8.9 9.3 9.8 6.2 6.6 10.4 10.2 10.3 10.8 9.9 10.5 11.3 10.0 10.5 10.6 9.7 9.2 8.7 8.6 8.5 8.4 8.9 9. 1 9. 1Wind dir. W W NNW NW N NNE NE NNE NNE NNE WNW NW NNW W NW NW NNW NW NNW NW NNW
Fetch
(m)
170 170 160 150 200 450
22,
700
450 450 450 150 150 160 170 150 150 160 150 160 150 160Observed d
ita
of
wind,
temperature,
and
vapour
pressure
'Continued)
Date Time St. Wind>peed
(m/sec)
Temperature
(°C)
Vap
jur pressuremb)
Wind dir. Fetch(m)
No. "25 "5 0 "10 0 "200 "400To
T2
5
r5o
T\oo
^200
Tioo
60 e25 650 6100 6200 6400 103 1954 Dec. 19 h m 05.00 7 1.54 1.64 1.73 1.87(1.8)
(1.9)
1.98(1.9)
18.6 9.2 9.2 8.9 8.2 7.9 21.0 10.8 10.6 10.0 9.8 9. 1 NNW 160 104 ti // 06.00 a 1.71 1.90 1.98 2.13 2.26 18.5 9.4 9. 1 8.5 7.9 7.5 20.9 10.6 10.4 10. 1 9.7 9. 1 NNW 160 105 ti // 07.00 it 1.59 1.67(2.0)
(2.1)
1.80 1.88(2.2)
2.07 18.4 9.8 8.9 8.7 7.9 7.5 20.7 10.9 10.3 10. 1 9.3 9.0 WNW 150 3- P 5t 106 ti II 08.00 a 1.67 1.90(1.8)
(1.8)
2.03 2.16(2.0)
(2.1)
(2.0)
2.30(2.3)
18.4 10.4 9.5 9.5 8.6 8.3 20.7 10.7 10.3 10.3 9.5 9.4 NNW 160 0 107 a It 09.00 ti 0.84 0.91 0.96 1.02 1. 15 18.6 12.9 12.6 12.8 12.8 13.3 21.0 12.8 12.5 11.8 11.3 11. 1 SW 400 0 108 tt If 10.00 n 2.41 2.60(0.9)
(1.0)
2. 75 2.94(1.1)
3.12 18.8 15.3 15.7 14.7 15.0 14.2 21.3 14.4 13.8 13.2 13.0 12.5 NE22,
700
0 109 ti If 11.00 n 1.07 1. 12(2.7)
(2.9)
1.15 1.40(1.2)
(1.3)
(3.1)
1.48(1.4)
18.4 16.8 16.6 16.4 15.8 15.2 20.7 13.8 13.6 13.2 13.3 11.9 NE22,
700
n O 2- 0 110 n II 12.00 if 1.90 2. 15 2.47 2. 60(2.4)
(2.7)
2.96(2.9)
18.7 17.3 17.3 17.0 16.6 16.6 21. 1 10.6 9.7 9.7 9.2 8.4 WNW 150 n* 111 it If 13.00 it 2.05 2.42 2.78 3.12 3.62 19.0 17.6 17.4 17.4 17.3 16.7 21.5 11.9 11.4 11.2 11. 1 10.5 W 170 0 112 it If 14.00 it 2.98 3.33(2.7)
(3.4)
3.64 3.87(3.6)
4.26 18.5 17. 1 16.9 17.2 16.3 16.5 20.9 12.4 11.5 10.5 10.3 10.0 WNW 150 — 113 n If 15.00 it 2.47 2.88(3.6)
(4.0)
3. 48 4. 04(4.3)
4.50 18.9 15.9 16.2 16. 1 16.3 16.3 21.4 13.7 12.8 12.6 12.3 12.4 W 170 < 5' 114 ti If 16.00 n 1.68 1.77(3.5)
(4.0)
1.90 2.23(4.5)
2.50 18.9 16.2 16. 1 16.0 16.5 16.3 21.4 14.2 13.9 12.6 11.5 10.5 w 170 3 » 115 it If 17.00 ii 2.48 2.59(1.9)
(2.2)
2.83 3.19(2.8)
(3.2)
(2.5)
3.63(3.6)
18.7 14.6 14.7 15.3 14.9 14.6 21. 1 12.8 13.2 12.4 12.7 12.4 w 170 3 116 it If 18. 0C ii 1. 16 1.29 1.38 1.47 1.80 18.5 13.9 13.6 13.4 13.6 13.2 20.9 13.2 12.5 12.0 12.0 11.8 NW 150 a 117 it If 19. 0C ii 0.77 0.83(1.3)
(1.4)
0. 82 0. 75(1.7)
0.93 18.6 12.5 12. 2 12.4 12. 1 11.9 21.0 13.2 12.2 12.0 11.9 11.3 NW 150 0 < 118 ii if 20. 0C it 0.85 0.95(0.6)
(0.6)
0.98 1.07(0.8)
1. 14 18.6 12. 1 12.0 11.7 11.6 11.4 21.0 12.2 12.0 11.4 11.5 11.6 w 170 -1 119 n If 21.0C ii 0.91 1.02(1.0)
(1.1)
1.09 0.98(1.1)
1. 17 18.6 11.8 11.6 11.6 11.4 11.3 21.0 12.6 12. 1 12.3 11.9 11.7 NW 150 120 it If 22. 0C a 0.97 1.05(1.0)
(1.0)
1.04 1.16(1.1)
1.35 18.6 12.4 11.4 11.9 11.2 11.0 21.0 13.4 12.2 11.4 11.5 11.2 NW 150 JD 121 it If 23. 0C it 1.25 1.33(1.
1)
(1.
1)
1.39 1.45(1.3)
1.70 18.5 10.7 10.6 9.8 9.4 9.4 20.9 12.0 11.9 11.2 10.9 10.8 NW 150 122 it 2C 00. OC ii 1.48 1.62(1.4)
(1.5)
1.70 1.72(1.7)
1.75 18.6 9.5 9.3 9.2 9.0 8.8 21.0 10.9 11.0 10.8 10.5 10.2 NW 150 123 ii if 01. OC n 1.23 1.25(1.7)
(1.8)
1.30 1.49(1.3)
(1.4)
(1.8)
1.56(1.5)
18.4 11. 1 9.8 9.6 9.2 8.8 20.7 11.2 10.8 10.6 10.2 9.9 NW 150Observed
data
of
wind,
tempera
ure,
and
vapour
pressure
(Continued)
No. Date Time St.Wind
speed
(m/sec)
Temperature
(°C)
Vap
our pressure(mb)
Wind dir. Fetch(m)
to "25 "50 "100 "200 "400To
T2S
Ti0
^100
^2
0
0
^4
0
0
eo 62 5 eso 610 0 62 0 0 6400 1954 h m 124 Dec 2C 02.00 7 1.06 1.25 1.23 1.30 1.51 18.6 10.8 9.2 8.8 8.8 8.4 21.0 11.4 10.6 10.2 9.9 9.9 NNW 160(1.3)
(1.3)
(1.4)
125 '/ if 03.00 // 1.09 1.08 1.08 1.14 1.29(1.0)
(1.1)
(1.2)
18.7 10.8 9.2 8.6 8.5 8.4 21. 1 11.7 10.6 10.3 9.8 9.8 NNW 160 126 n if 04.00 ti 0.87 0.97 0.98 1.05 1.15(1.0)
(1.0)
(1.1)
18.9 10.6 9.6 9.6 9.4 8.6 21.4 12.0 11.4 11. 1 10.5 9.8 NNW 160 127 ii ii 05.00 0.90 1.05 1.14 1.21 1.38(1.1)
(1.2)
(1.3)
18.8 10.9 10.8 11.0 10. 1 9.8 21.3 12.9 11.7 11.5 10.7 11. 1 NW 150 128 ti n 06.00 2.22 2.32 2.55 2.70 3.03(2.5)
(2.7)
(3.0)
18.8 12.0 11.6 11.6 11.3 11.3 21.3 11. 1 10.0 9.6 10.2 9.6 NW 150 n 129 if ii 07.00 1.57 1.67 1.80 1.92 2.05 18.6 11.6 11. 1 11.4 11.0 11.0 21.0 9.6 8.4 8.7 8.4 8. 1 N 200 3(1.7)
(1.9)
(2.0)
TI 130 if if 08.00 ii 0.99 1.12 1.11 1.23 1.35(1.2)
(1.3)
(1.3)
18.7 11.4 11.3 11.3 11. 1 11.0 21. 1 9.3 8.6 8.6 8.6 8.4 N 200 P 131 ti ii 09.00 2.39 2.53 2.74 2.90 3.25(2.7)
(2.9)
(3.2)
18.6 12.5 12.3 12.4 12.0 11.7 21.0 9.3 9. 1 8.9 8.0 7.7 NW 1508*
132 ii n 10.00 2.28 2.44 2.62 3.06 3.50(2.7)
(3.1)
(3.4)
18.8 13.5 13.4 13.5 13.0 12.9 21.3 10.2 9.4 8.6 8.5 8. 1 NW 150 pcm 133 if n 11.00 3. 12 3.26 3.53 3.90 4.44(3.5)
(3.9)
(4.4)
18.7 13.7 13.5 13.7 12.4 13.3 21. 1 11.9 10.8 9.8 9.3 8.6 NNW 160 0 134 n a 12.00 3.55 3.88 4.68 5.30 6.22(4.8)
(5.2)
(6.2)
18.8 13.6 13.5 13.4 13.4 13. 1 21.3 8.2 8.2 8. 1 9.2 8.6 NW 150 3 p d 135 if n 13.00 3.87 4. 16 4. 82 5.50 6.47 18.8 14.3 14. 1 13.9 13.5 13. 1 12.7 11.3 9.9 10.2 10.2 WNW 150 B(4.9)
(5.6)
(6.4)
<• 136 i/ if 14.00 3.07 3.30 3.62 4.06 4.50(3.6)
(4.0)
(4.5)
18.9 13.8 13.8 13.8 13.4 13.0 21.4 9.7 9. 1 8.5 10.6 10.0 NNW 160 < 0 137 ti ii 15.00 2.46 2.65 2.90 3.44 3.98(2.9)
(3.4)
(3.9)
18.7 13.2 13.1 13.2 12.9 12.8 21. 1 10.4 10.0 9.7 9.9 8.9 NW 150 a> 138 if ii 16.00 3.30 3.60 3.83 4.30 4.72(3.8)
(4.3)
(4.6)
18.7 12.3 12.3 12.3 12.4 12.2 21.1 10.3 10. 1 10.0 10.4 9.8 NW 150 139 it if 17.00 1.52 1.60 1.71 1.83 2.01(1.7)
(1.9)
(2.0)
18.6 11.4 11.2 11.0 10.9 10.9 21.0 11.6 11.2 10.7 10.5 9.9 NW 150 140 if if 18.00 1.97 1.88 2.14 2.30 2.39(2.2)
(2.3)
(2.3)
18.6 10.8 10.5 10.2 10.0 9.9 21.0 9.5 9.5 9.4 9.0 9.0 N 200 141 n it 19.00 1. 19 1.30 1.40 1.46 1.58(1.4)
(1.5)
(1.5)
18.4 8.7 8.4 8. 1 8.2 8.2 20.7 9.6 9.3 9. 1 8.7 8.4 NNW 160 142 if ti 20.00 1.601.78
1.90
2.04
2.16
(1.9)
(2.0)
(2.1)
18.5 8. 1 8.0 7.9 7.9 8.0 20.9 9.3 8.5 7.8 7.8 7.5 NW 150 143 n ti2I.001
1.531.70
1.77
1.83
2.04
(1.7)
(1.8)
(1.9)
18.3 9.8 9.5 9.2 8.9 9.0 20.6 9.8 9.4 9. 1 8.6 7.9 NW 150 144 ti if 22.00 1.031.08
1.24
1.23
1.35
18.3 8.9 8.4 8.4 8.6 8.6 20.6 11.0 9.6 8.9 8. 1 8. 1 W 170(1.1)
(1.2)
(1.3)
1
Observed
data
of
wind,
temperature,
and
vapour
pressure
(Continued)
No. Date Time St. Wind s)eed
(m/sec,
Temperature
(°C)
Vap
Dur pressuremb)
Wind Fetch "2 5 "50 "10 0 "200 " 400To
r25
J^5
0
T
ioo
2*200
^4
0
0
eD e2 5 eso 610 0 e2 0 0 6400 dir.(m)
1954 h m 145 Dec. 20 23.00 7 0.89 1. 13 1.10 1.191.0)
(1.2)
1.32(1.3)
18.2 8.9 8.8 8.7 8.8 8.6 20.5 8.2 8.0 7.8 7.5 7.3 NNW 160 146 '/ 21 00.00 '/ 2.25 2.51 2. 54 2. 702.6)
(2.8)
2.95(2.9)
18.5 9.4 9.0 8.6 8.4 8.4 20.9 12. 1 10.1 8.0 7.2 6.4 W 170 147 '/ '/ 01.00 '/ 2.65 2.88 3. 09 3. 223.0)
(3.3)
3.40(3.3)
18.4 8.6 8.4 8.5 8.0 7.9 20.7 9.2 8.0 6.6 6.6 6.3 NW 150 148 '/ '/ 02.00 '/ 1.46 1.53 1.65 1.771.5)
(1.8)
1.85(1.7)
18.4 8.2 8.0 7.9 7.6 7.4 20.7 8.5 8.0 7.5 7.2 7.2 W 170 149 '/ H 03.00 '/ 1.60 1.79 1.90 1.951.9)
(2.0)
2. 11(2.1)
18.5 7.2 7. 1 7.2 6.8 6.8 20.9 8.4 7.8 7.2 6.7 7.0 W 170 150 ii ii 04.00 n 1.56 1.71 1.85 1.861.8)
(1.9)
2.06(2.0)
18.2 6.6 6.4 6.2 5.8 5.7 20.5 8.8 8.4 8.0 7.7 7.6 w 170 151 if '1 05.00 ii 1.76 1.83 2.07 2.172.0)
(2.2)
2.33(2.3)
18.2 6.9 6.8 6.6 6.2 6.0 20.5 9.0 8.0 7.6 7.7 7.5 w 170 152 'I I' 06.00 n 2.06 2.28 2. 00 2. 552.4)
(2.5)
2.67(2.6)
18.2 6.3 6.2 5.7 5.5 5.4 20.5 8.4 7.8 7.5 7.4 7.3 w 170 153 i; ri 07.00 it 1.66 1.85 1.95 2.011.9)
(2.1)
2.22(2.2)
18.3 7.3 7.0 6.7 6.5 6.2 20.6 7.6 7.4 7.2 6.9 6.5 w 170 154 7 II 08.00 it 1.76 1.88 1.95 2.132.0)
(2.
1)
2.20(2.2)
18.3 8.4 8.2 8.0 7.3 7.2 20.6 7.7 7.6 7.7 7.2 6.7 WNW 150 155 If II 09.00 i. 3.06 3.31 3.57 3.723.5)
(3.9)
4.28(4.2)
18.3 11.3 11.5 11.3 11.2 10.7 20.6 11.5 10.4 9.9 9.6 8.9 N 200 156 If I! 10.00 it 2.48 2.57 2. 75 3. 032.7)
(3.0)
3.38(3.3)
18.4 12.2 12. 1 12.4 12.0 11.6 20.7 10.5 9. 1 8.9 8.3 8.0 N 200 157 II II 11.00 ii 1.85 1.96 2.05 2. 222.
1)
(2.2)
2.37(2.3)
18.4 12.6 12.5 12.2 12.4 12.2 20.7 9.8 9. I 8.7 7. 1 7.3 NE22,
700
158 If II 12.00 tt 2.72 2.90 3. 14 3.333.
1)
(3.3)
3.54(3.5)
17.8 14. 1 14. 1 14. 1 13.4 13.4 20.0 10.3 9.8 9.4 7.6 6.8 NE22,
700
159 II 1/ 13.00 it 1.65 1.71 1.90 2.051.9)
(2.0)
2.08(2.0)
17.5 15.2 15. 1 15.2 14.8 14.8 19.6 10. 1 9.6 9.1 8.2 7.9 E5,200
160 'I II 14.00 it 0.57 0.66 0.71 0.700.6)
(0.7)
0.73(0.7)
17.5 15.0 15.0 14.9 15.3 15.2 19.6 9.0 8.6 8. 1 8. 1 7.6 S E24,000
161 II II 15. 00 a 1.65 1.77 1.88 2.18(1.8)
(2.1)
2.36(2.3)
17.8 15.5 15.2 15.5 15. 1 15.3 20.0 11.0 10.4 10. 1 9.4 8.6 S 500 162 II II 16.00 ii 0.70 0.79 0. 74 0. 70(0.4)
(0.4)
0.78(0.5)
17.8 16.4 15.6 15.2 15.8 15.6 20.0 10.4 10.3 10. 0 9.9 9.9 S 500 163 It It 17.00 ii 1.50 1.62 1.74 1.93(1.8)
(1.9)
2.05(2.0)
18.4 13.8 14.0 13.6 13.8 13.6 20.7 10.9 10.8 9.8 9.6 9.6 WNW 150 164 It It 18.00 a 1.29 1.40 1.50 1.63'1.5)
(1.6)
1.69(1.7)
18.5 10. 0 10.3 9.8 9.9 10. 1 20.9 10.7 10.3 9.8 9.3 9.5 N 200 165 II II 19.00 ii 2. 16 2.25 2. 47 2. 64'2.4)
(2.6)
2.96(2.9)
18.4 8.8 8.9 8.8 8.6 8. 1 20.7 10.3 9.6 9.2 9. 1 8.9 NW 150 3 a.No. Date Time St. 166 1954 Dec. 21 h m 20.00 7 167 '/ « 21.00 " 168 // it 22.00 tt 169 it it 23.00 tt 170 it 22 00.00 it 171 // n 01.00 it 172 ti ii 02.00 it 173 n it 03. 00 tt 174 a a 04.00 tt 175 it a 05. 00 tt 176 ti n 06.00 it 177 ii ii 07.00 it 178 it ti 08.00 II 179 n a 09.00 ii 180 n it 10.00 ft 181 a it 11.00 ll 182 it it 12.00 a 183 a it 13.00 it 184 it a 14.00 a 185 186 n it 1955
April26
15.00 09.00 n 8Observed
data
of
wind,
temperature,
and
vapour
pressure
(Continued)
Wind
speed
(m/sec)
"25 2.01 2. 18 1.54 3.80 1.93 2.23 2.78 2.61 2.06 2. 16 2.61 2.20 1.84 1.56 1.51 1.72 1.68 1.16 2.28 1.88 2.08 "50 "100 "200 "400 2. 11 2.41 1.72 3.97 2.20 2.50 3. 05 2.88 2.26 2. 18 3.02 2.33 1.98 1.67 1.83 1.94 1.87 1.35 2.60 2. 16 2. 18 2.30(2.3)
2.56(2.6)
1.88(1.8)
4.25(4.3)
2.34(2.3)
2.72(2.8)
3. 12(3.2)
3.09(3.1)
2.37(2.4)
2.39(2.3)
3.20(3.1)
2.47(2.5)
2. 10(2.1)
1.82(1.8)
1.95(1.9)
1.92(2.0)
1.98(1.9)
1.67(1.6)
3. 14(3.
2)
2.58(2.5)
2.30(2.3)
2.47 2.75(2.
5)
(2.7)
2.75 2.86(2.8)
(2.
8)
1.80 2.06(1.9)
(2.0) 4.63 5.00 (4.6)(5.0)
2.60 2.95(2.6)
(3.
0)
2.95 3.02(2.9)
(3.0)
3.25 3.57(3.4)
(3.
5)
3.35 3.78(3.4)
(3.8)
2.60 2.62(2.5)
(2.6)
2.50 2.65(2.5)
(2.7)
3.55 4.03(3.7)
(4.0)
2.71 3.25(2.8)
(3.2)
2.29 2.52(2.2)
(2.5)
2.04 2.33(2.1)
(2.3)
2. 17 2.41(2.2)
(2.4)
2. 14 2. 13 (2.1)(2.1)
2.20 2.26(2.1)
(2.3)
1.89 2. 13(1.9)
(2.1)
3.53 4.02(3.5)
(3.9)
2.95 3. 37(2.9)
(3.
3)
2.58 2.87(2.5)
(2.9)
Temperature
(°C)
7.5 6.6 5.4 8 5.5 7 4. 1 0 4.9 8 3.9 9 3.8 0 4.5 0 4.3 2 4.4 8 10.6 2 9.9 1 10.3 2 14.5 7 15.2 8 15. 1 0 18.0 8 17.9 8 16.5 1 17.3^5
0
7*10
0
T2
0
0
-'4
00
7.4 6.3 5.6 5.4 4.2 4.6 3.6 3.6 3.9 3.8 4.3 9.6 9.8 9.9 14.3 15.0 15.2 17.8 18.0 16.3 17.2 7.4 6. 1 5.5 5.2 4. 1 4.5 3.2 3.3 3.7 3.5 3.9 8.6 9.7 9.5 14.0 14.5 14.9 18.0 17.9 16. 1 17.0 7. 1 6.0 5.2 5.4 3.8 4.2 3.3 3.3 3.5 3.2 3.5 8.2 9.7 9.4 13.4 14.7 15. 1 17.2 17.4 15.7 17. 1 6.6 5.8 5.2 4.9 3.8 3.9 2.9 3.3 3.3 3. 1 '3. 1 8. 1 9.6 9.2 13. 1 15.0 14.8 17.5 17.4 15.7 16.5 e0 20.5 20.6 20.3 20.0 19.8 20.2 20.0 20. 1 20.2 20.2 20.5 20.0 20.5 20.3 20.5 21. 1 21.3 21.5 21.3 21.3 20.3Vapour
pressure
(mb)
e2 5 650 610 0 6200 6400 Wind dir. Fetch(m)
9.4 8.7 7.7 8.4 7.7 8.0 7.2 6.9 7.9 7.9 8.0 11.7 11.8 10.6 13.0 14.3 15. 1 12.0 12.7 13.6 11.9 8.9 8.4 8. 1 8.2 7.5 7.5 7. 1 6.9 7.5 7.5 7.8 11.2 11.7 10. 1 12.6 14.0 14.5 11.4 12.4 13.4 11.8 8.8 8.4 8. 1 7.6 7.2 7.3 7.2 6.7 7.2 7.4 7.3 10.7 11.6 10. 1 12.7 13.0 13.2 10.8 12.7 13.4 11.6 8.6 8.0 7.8 7.6 6.9 7.0 6.9 6.9 7.0 7.2 7.2 10.3 11. 1 10. 1 11.8 12.8 12.2 9.7 12.2 13.0 11.2 8.4 WNW 7.9 N 7.8 :N 7.3 6.8 NNW NNW 6.8 NNW 6.6 NNW 6.9 NNW 6.5 NNW 7.0 NW 7.0 NNW 10. 1 WNW 10.8 NW 10. 1 NW 11.7 NNW 13.8 E 12.8 E 9.8 NNW 11.8 W 11.8 WNW 11.8 W 150 200 200 160 160 160 160 160 160 150 160 150 150 150 1605,200
5,200
160 170 1503,
100
a 3 •n 3- BObserved
data
of
wind,
tcmpcrat
ure,
and
vapour
pressure
(Continued)
No. Date Time St. Windspeed
(
m/sec)
Temperature
(°C)
Vapour
pressure
(mb)
Wind Fetch "25 "50 "100 "200 " 400To
7*2
5
7*5
0
7*100
7*200
7^400
e0 e2 5 65 0 e100 62 0 0 6400 dir.Cm)
1955 [ b m 187April
26|
10.00
8 2.45 2.55 2.81 3. 17 3.54 18.3 18.2 18.3 18.0 17.9 17.8 20.6 11.9 11.7 11.9 11.3 11.4 W3,
100
(2.9)
(3.1)
(3.5)
188 // ti 11.00 ti 3.58 3.91 4.20(4.2)
4.74(4.6)
5.35(5.4)
18.2 18.2 18.5 18.2 17.7 18.2 20.5 14.7 14.5 13.8 13. 1 11.6 W3,
100
189 if if 12.00 n 1.65 1.82 1.97(2.0)
2. 10(2.0)
2.38(2.3)
18.2 18.8 19.5 18.8 18.6 18.9 20.5 12.2 11.6 12.0 11.5 11.6 W3,
100
190 if 'I 13.00 if 2.40 2.55 2.72(2.8)
3. 13(3.1)
3.42(3.4)
18. 1 19.5 19.5 19.8 19.7 19.5 20.3 13.3 12.3 12.2 10.8 11.7 W3,
100
191 if a 14.00 ii 2. 10 2.38 2.44 2.60 2.90 18.2 19.4 19.5 20.2 19.4 19.4 20.5 13.9 14.4 13.5 13.2 12.7 SW10,500
(2.4)
(2.5)
(2.9)
192 v tt 15.00 it 1.46 1.57 1.69(1.6)
1.78(1.7)
1.89(1.9)
18.0 19.8 20.0 20.2 19.9 19.9 20.2 14.0 14.4 13. 1 12.5 12.3 S W10,
500
193 it ti 16.00 a 2.27 2.33 2.58(2.5)
2.97(2.9)
3.29(3.2)
18. 1 20.3 20.4 20.4 20.0 20.2 20.3 16.6 16. 1 15.9 14.9 14. 1 W3,
100
194it
tt\
17.00
ft 2.80 2.96 3. 10(3.1)
3.38(3.3)
3.67(3.6)
18. 1 19.0 19.0 19.0 19.6 20.0 20.3 17.4 17.3 17.4 17.6 17.3 SW10,500
195'/
n\
18.00
tt 2.40 2.53 2.78(2.7)
2.97(2.9)
3. 11(3.1)
17.7 18.0 18.2 18.0 19.3 19.3 19.8 17.6 17.2 16.6 16.7 16.3 S SW17,000
196 ii a 19.00 tt 3.00 3. 15 3.43(3.3)
3.54(3.5)
3.75(3.8)
17.8 18.3 18.5 18.7 18.7 18.8 20.0 16.4 16.3 16.2 16.0 16. 1 S SW17,000
197n
n\
20.00
it 2.78 2.89 3.04 3.20 3.40 17.9 — 18. 1 18. 1 18. 1 18. 1 20. 1 — 17.3 16.0 14.8 14.8 NNW5,000
(3.0)
(3.2)
(3.4)
198 '/ '/ 21.00 it 0.98 0.91 1. 12(1.0)
1. 17(1.1)
1.38(1.4)
17.8 18.0 18.0 18.0 18. 1 18.2 20.0 16.4 16. 1 15.7 15.7 14.9 N 2, 100 199 ii if 22.00 it 2.96 3. 15 3.39(3.3)
3.83(3.8)
4.24(4.3)
17.3 ~ 17.2 17.4 17.4 17.4 19.3 — 18.9 18.2 17.0 14.7 E2,700
200a
n
\
23.00
ti 2.20 2.28 2.55(2.5)
2.63(2.6)
2.93(2.9)
17.6 17. 1 17.0 16.9 16.9 16.9 19.7 15.6 15.5 15.4 15.2 15.4 NE2,000
201 ii 271 00.00 ii 2.28 2.57 2.57 2.75 3. 11 17.2 17.0 16.9 16.9 16.8 16.8 19.2 14.7 14.7 14.7 15. 1 14.6 NE2,000
(2.7)
(2.8)
(3.0)
202 ii a 01.00 it 1.96 2. 15 2. 14(2.2)
2.37(2.3)
2.68(2.7)
17.9 17.2 17.2 17.0 17.0 16.7 20. 1 15.9 15.9 15.3 15.0 15.2 NE2,000
203 if tt 02.00 it 3.00 3.21 3.34(3.4)
3.78(3.7)
4.23(4.1)
17.8 17.0 16.8 16.6 16.6 16.7 20.0 15.7 15.5 15.3 15.3 15.0 NE2,000
204 ti ii 03.00 it 2.75 2.93 3.06(3.0)
3.36(3.4)
3.67(3.6)
17.9 16.9 16.8 16.7 16.7 16.6 20. 1 14.2 14. 1 14.2 14.5 14.4 NNE1,700
205 if a 04.00 a 1.87 1.95 2. 11(2.1)
2.26(2.2)
2.64(2.5)
17.8 16.6 16.5 16.4 16.3 20.0 — 15.2 15.2 15.2 14,8 NE2,000
206 ii a 05.00 n 1.95 2. 17 2.29(2.2)
2.45(2.4)
2.63(2.5)
17.8 16.7 16.6 16.5 16.3 16.3 20.0 17.0 16. 1 15.3 15.5 15.8 N2,
100
207 it a 06.00 tt 2.88 3.03 3.25(3.2)
3.40(3.4)
3.81(3.8)
17.9 16.8 16.7 16.6 16.5 16.3 20. 1 16.5 15.9 15.3 15.2 15.3 N2,
100
p o p 3 a. on c a.Observed d
ata
of
wind,
temperature,
an
d
vapour
pressure
(Continued)
No. Date Time St. Windspeed
(
m/sec'Temperature
(°C)
Vapour
pressure
1mb)
Wind ' Fetch dir. (mloi
"25 "50 " 100 "200 "4007*„
7*2
5
7*5
0
7*ioo
T
200
7*4
00
60 625 eso eioo e2oo 6400 208 1955April
27
h m 07.00 8 3.22 3. 45 3. 56 3.82 4.35 18.0 17.2 17.2 17.2 16.8 16.8 20.2 16.5 16.5 16.5 16.4 15. 1 N2,
100
209 „ a 08.00 ti 3. 10 3.31(3.6)
3.53(3.8)
3.92(4.2)
4.33 18. 1 17.9 17.8 17.9 17.5 17.4 20.3 15.8 15.7 15.8 15.3 15. 1 N2,
100
210 If if 09.00 ii 2.82 3.00(3.4)
3.25(3.8)
3.77(4.3)
4.39 18.3 18.2 18.4 18.6 18.6 18.6 20.6 16.3 16.2 16. 1 16.2 16.8 NE2,000
211 '/ 28 21.00 9 2.35 2.51(3.
2)
2.67(3.7)
2.88(4.3)
3.24 19.0 19.8 19.9 19.9 19.8 19.8 21.5 19.6 19.8 19.2 19.6 19.0 S10,600
212 If // 22.00 n 1.19 1.28(2.7)
1.40(2.8)
1.49(3.2)
1.66 19.2 19.6 19.6 19.6 19.5 19.5 21.8 19.0 19.0 19.2 19.4 19.0 S SW5,300
£
213 If if 23.00 if 1.75 1.93(1.4)
1.93(1.4)
2. 10(1.6)
2.36 19.2 19. 1 19.3 19.2 19.2 19.2 21.8 20. 1 19.4 19.0J9.0
18.9 NNW4,300
CD 3 214 If 29 00.00 it 0. 55 0.51(2.0)
0.60(2.1)
0.66(2.4)
0.72 18.9 18.6 18.6 18.8 18.8 18.8 21.4 19.6 19.6 19. 1 19. 1 19. 1 NW3,000
p0 215 If if 01.00 n 1.68 1.80(0.4)
1.92(0.6)
2.06(0.6)
2.24 19.3 18.9 18.9 18.7 18.6 18.6 21.9 19.4 19.4 19.2 19. 1 19. 1 NW3,000
!?.
216 II ti 02.00 a 1.58 1.76(2.0)
1.97(2.1)
1.98(2.2)
2.09 19.4 18. 1 17.7 17.6 17.8 17.8 22. 1 19.0 18.5 18.6 18.5 18.6 SW3,500
K p 217 II u 03.00 it 1.33 1.43(1.9)
1.62(1.5)
1.85(1.9)
1.65(1.6)
1.94(2.1)
1.78(1.9)
2.09 19.3 17.9 17.8 17.6 17.8 17.8 21.9 19.0 18.6 19.0 18.6 18.3 SW3,500
Ow cr3'
218 II ti 04.00 a 1.80 1.85 19.8 18.3 18.0 17.9 17.8 17.8 22.6 19. 1 18.9 18.6 18.6 18.5 NNW4,300
219 II it 05.00 a 1. 18 1.31(1.9)
1.34(1.9)
1.65(2.1)
1.64 19.8 18.2 18.2 18.2 18. 1 18.0 22.6 19.3 18.9 18.9 18.8 18.5 WNW2,800
5.
<" 220 If n 06.00 it 0.80 0.86(1.4)
0.93(1.5)
0.97(1.6)
1.05 19.0 18.0 18. 1 18.0 17.9 17.9 21.5 19. 1 18.6 18.5 18.4 18.4 N6,000
< 0 221 If if 07.00 it 1. 16 1.28(0.9)
1.33(1.0)
1.37(1.0)
1.50 19. 1 18.2 18.2 18. 1 18.0 18. 1 21.7 19.1 18.9 19.0 18.7 18.6 N6,000
CTl 222 If if 08.00 it 1.02 1. 13(1.3)
1. 16(1.4)
1.30(1.5)
1.33 19.2 19.0 18.8 18.6 18. 1 18.2 21.8 20.0 19.9 19.6 19.0 19. 1 NW3,000
223 '! n 09.00 a 0.68 0.73(1.2)
0.80(1.3)
0.77(1.3)
0.85 18.8 18.2 18.0 17.9 17.8 18.2 21.3 20. 1 19.9 19.3 19.6 19. 1 N6,000
224 If n 10.00 it 1.68 1.86(0.7)
1.97(0.8)
2.06(0.8)
2.22 18.9 18.5 18.5 18.3 18. 1 18. 1 21.4 19.9 19.7 19.3 19.4 19.6 NE11,000
225 If n 11.00 it 0.67 0.73(2.0)
0.80(2.1)
0.76(2.2)
0.88 18.9 18.6 18.6 18.8 18.4 18.3 21.4 20.0 20.0 19.7 19.2 19.3 NE11,000
226 ll n 21.00 a 1.95 2. 14(0.7)
2.27(0.7)
2.36(0.9)
2.58 18.9 18.5 18.6 18.3 18.3 18.2 21.4 20.7 20.4 19.8 19.5 19.5 N6,000
227 If n 22.00 tt 1.18 1.26(2.
3)
1.37(2.4)
1.51(2.
5)
1.56 18.8 18.0 17.6 17.5 17.2 17.4 21.3 18.7 19.0 18.7 18.7 18.3 NW3,000
228 n n 23.00 it 5.48 5.85(1.4)
6.22(6.2)
(1.5)
6.58(6.5)
(1.6)
6.99(6.9)
18.9 18.6 18.4 18.4 18.3 18.3 21.4 19.8 20.0 19.4 19.5 19.3 S E33,
000
No. Date Time St 1955