The Geospatial Information Authority of Japan (GSI), as a designated government organization under the Disaster Countermeasures Basic Act, Act No. 223 of 1961, “Shall endeavor to collect and disseminate information about disasters.” According to the Basic Disaster Prevention Plan (May 2016) created by the Central Disaster Management Council as well, the GSI “collects information visually and photographically with aircraft” and “works to understand the scale of damage using image information.”
Therefore, the National Mapping Department immediately took and provided aerial photographs in connection with the damage caused by the Kumamoto earthquake using the survey aircraft Kunikaze III, and created and provided photomaps and base maps of emergency restoration measures. This paper reports on those efforts.
1. Introduction
Immediately after the Kumamoto earthquake, the National Mapping Department of GSI established the National Mapping Department Disaster Countermeasures Group (hereafter, “Countermeasures Group”) based on the department’s general implementation of disaster countermeasures.
The Countermeasures Group was established simultaneously with the GSI Headquarters for Disaster
Countermeasures and took initial action by contacting and coordinating with related departments such as the Disaster Management Office of Planning Department, and collecting disaster information and information relating to the necessity of emergency aerial photography.
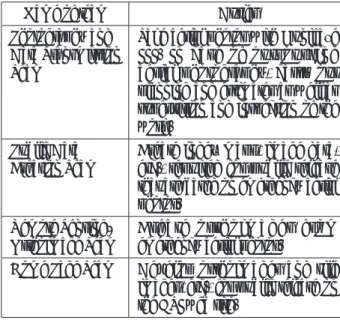
In addition, survey teams were established under the Countermeasures Group and immediately began the emergency response work. Table 1 lists the duties of each team.
2. Emergency Aerial Photography
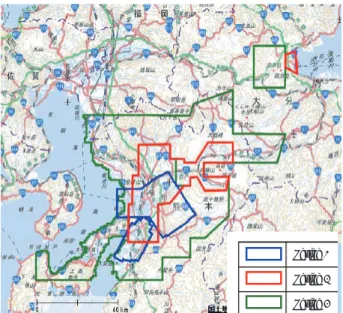
As part of this emergency aerial photography, aerial photos were taken during three periods: (1) after the foreshocks occurred on April 14 (April 15), 2016; (2) April 16 (the day of the main-shock), and (3) April 19 and 20, after precipitation and aftershocks up to level 5 on the Japanese seismic intensity scale had occurred over a wide area. Fig. 1 and Table 2 show the areas and the number of districts that were photographed, respectively.
Name of team Duties
Photography and Data Transmission Team
Take aerial photos with Kunikaze III. In case of outsourcing aerial photography, carry out planning and estimates as well as supervision and inspection of the work.
Public Data
Creation Team Create index maps, image data, etc., required for public release that are based on emergency aerial photos.
Remote Sensing/
Orthoimage Team C r e a t e o r t h o i m a g es f r o m emergency aerial photos. Home Page Team Develop orthoimages and tile images, etc., for public release on the GSI web site.
2.1 Emergency Aerial Photography with Kunikaze III In order to grasp the extent of the damage resulting from the April 14 foreshocks, Kunikaze III arrived onsite in Kumamoto on April 15 for initial response. On April 15, 40 oblique photos were taken at the Kumamoto Castle and 3 other locations. By the 17th, 99 oblique photos had been taken (Fig. 2 and 3).
After the main-shock on April 16, 324 vertical aerial photos were taken of the Uto district, and on the 19th and 20th, 270 photos of the 2 Nishihara districts, 688 photos of the Oguni district, 311 photos of the Taketa district, and 678 photos of the Yufuin district were taken (Fig. 4). In addition, in the initial response, image processing was started immediately upon arrival at the Kitakyushu Airport, and the photographic images were transmitted in JPEG format from the airport to the main offi ce of the GSI in Tsukuba City through the Internet.
Period 1 Period 2 Period 3
Fig. 1 Map of areas of vertical aerial photos for emergency response
Fig. 2 Locations of oblique photos (taken April 15 – 17)
Fig. 3 Oblique photos of the Aso-ohashi Bridge vicinity (taken April 16)
Fig. 4 Map of areas of vertical aerial photos taken by Kunikaze III
Table 2 Number of districts and areas where vertical aerial photos were taken in the initial response
Number of districts Area covered
Period 1 3 923 km2 Period 2 8 1,277 km2 Period 3 11 4,152 km2 Total 22 6,352 km2 Uto district Nishihara 2 districts Oguni district Yufuin district Taketa district
aerial photos were taken of the Kumamoto district on May 30 and 31 (Fig. 6).
In addition, on May 17 discontinuous ruptures appeared, and airborne laser measurements were taken of the Kikuyo and Ozu districts (Fig. 7).
Precise Survey and Applied Technology (hereafter, APA) to facilitate emergency photography of disaster areas. In order to implement the agreement properly and quickly, the “Operating Standards for Emergency Aerial Photography During Disasters” (hereafter, “Operating Standards”) were established. Additionally “Operating Manual for Emergency Photography During Disasters” (hereafter, “Manual”) provides detailed information about implementation methods, procedures, formats, etc., of the items covered in the Agreement and Operating Standards. Hereafter, the Agreement, Operating Standards, and Manual are referred to collectively as “Agreement”.
The Kumamoto earthquake caused wide spread damage and since the area that had to be photographed from the air was too large for Kunikaze III to cover by itself alone, aerial photos were taken in accordance with the Agreement. The companies affiliated with APA that were commissioned for the fi rst response and the districts where photos were taken are shown in Fig. 5.
Fig. 5 Map of areas of aerial vertical photos taken based on the Agreement
Fig. 6 Map of areas photographed after the emergency photos
Fig. 7 Map of airborne laser measurement areas (Kikuyo and Ozu districts)
Kumamoto fault zone Kumamoto district
4. Providing Aerial Photo Images, etc., and Preparing Data for Website Browsing
4.1 Creation of an Index Map
In order to make the aerial photo images released on the GSI web site easier to read, the images were processed with the upper side being the north side. For districts for which more than 100 photos were taken, the number of photos was thinned out, and the odd-numbered aerial photo images were released.
In addition, in order to make aerial photos accessible to the On-site Headquarters for Major Disaster Management, affected municipalities, etc., an index map was created to show on GSI maps the locations where the aerial photos were taken (Fig. 8). To show the positional relationships of the orthoimages, index maps were also created for the vertical aerial photos.
4.2 Creation of Browsing Data such as Orthoimages and GSI Tiles
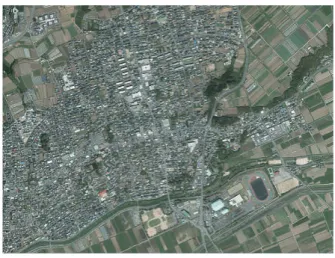
Orthoimages for external use were created. First, orthoimages of affected areas were created for each photographed district. Then, in consideration of the volume of data, it was decided to divide these into rectangle orthoimages covering 2 km E-W and 1.5 km N-S. Two types of data were created: high-resolution data to provide directly to the On-site Headquarters for Major Disaster Management, affected municipalities, and other relevant organizations, and low-resolution data to publish on the web site (Fig. 9).
Furthermore, tile images for GIS maps (hereafter, GSI tiles) were created from low-resolution orthoimages . The images could be viewed from zoom level 10, at which a whole range of orthoimages could be visually recognized in a moment, to level 18, where viewers could see details of the conditions of disaster areas. The intended purpose was to make it easier for people viewing GSI maps to understand them.
5. Dispatching Staff to GSI Technical Emergency Control Force (TEC-FORCE)
5.1 Aerial Photography with UAV
Given the damage such as landslides and ground fissures that occurred over an extensive area, it was decided to dispatch the GSI Land Bird team (GSI-LB), which was launched on March 16, to the disaster area. National Mapping Department sent 3 staff from the Geospatial Technology Development Office to act as operators and safety managers. They also processed photographic images and posted them on the GSI home page (Fig. 10).
Fig. 8 Index maps
Fig. 10 Images derived with Unmanned Aerial Vehicle (UAV) Fig. 9 Orthoimages
FORCE,” and conducted subsequent analyses.
6. Preparation of Geospatial Information (Maps, Photo Maps) for Restoration
On June 14, the National Mapping Department decided to prepare 1:2,500 base maps and 1:2,500 photo maps for emergency restoration measures as geospatial information with the Kumamoto Earthquake Restoration Fund allocated by the Japanese Cabinet. These cover a 204 km2 area that had sustained major damage such as
landslides, ground fissuring, building collapse, etc., during the Kumamoto earthquake (Fig. 11).
The 1:2,500 base maps for emergency restoration measures provide detailed and accurate map data on changes in topography and the condition of temporary housing. The 1:2,500 base photo maps for emergency restoration measures enable a thorough understanding of ground surface conditions, such as vegetation and soil in areas where landslides and ground fissures occurred.
Thanks to these maps, the national and local governments and organizations that were involved with emergency measures and restoration projects no longer had to develop their own maps individually but were able to share the maps developed by GSI, which helped to make the various types of restoration work more efficient and effective. In addition, base maps of emergency restoration measures will be compiled into Fundamental Geospatial Data (Japanese geospatial data framework) used as positioning standards to allow the public to continue using geospatial information.
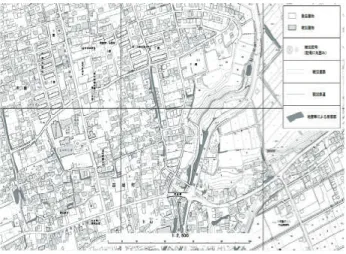
6.1 Developing 1:2,500 Base Maps for Emergency Restoration Measures
In order to promote the restoration and reconstruction of areas that had sustained particularly significant damage such as building collapse, destruction, etc., during the Kumamoto earthquake, priority was given to compiling highly accurate geospatial information, including Fundamental Geospatial Data items, into base maps for emergency restoration measures. Therefore, work was started in July with the taking and processing of highly accurate aerial photos. After that, from the end of August, 1:2,500 quick maps were provided to relevant organizations to assist with their emergency restoration work. The entire 204 km2 base map area is scheduled to
be provided by November (Fig. 12 and 13).
With respect to destroyed buildings, the aerial photos taken by the GSI in the past were compared with those taken in July, and buildings that no longer existed were identified in site surveys, etc., and recorded after the earthquake on the maps. However, it is possible that information about such buildings as relevant from past aerial photos does not necessarily reflect the conditions immediately before the Kumamoto earthquake, so this was handled as reference information.
When providing base maps for emergency restoration measures, maps will be provided in printed form, PDF files, or digital map files, depending on the needs of users of relevant organizations.
In the future, base maps (corresponding to the City
response measures were developed. The green dots in the figure show landslide areas, while the red lines show the distribution of surface fissures.
Planning Base Map) for emergency restoration measures will be issued as basic survey results.
6.2 Developing 1:2,500 Orthophoto Maps for Emergency Restoration Measures
Before creating this photo map for emergency restoration measures (in September), efforts were made to compile a quick version by the end of July (Fig. 14).
A quick version orthophoto map was compiled using aerial photos of the Kumamoto district taken by Kunikaze III on May 30 and 31. It contained pre-disaster 25,000-level map information from the Digital Japan Basic Map including contour lines, geographical names, names of public facilities, numerical values of elevation points, and administrative boundaries. The results were printed, as well as compiled as PDF and TIFF images
with a scale of 1:2,500 sheet line. The printed maps were printed on synthetic paper which made them easy to use outdoors.
Because of the record rainfall during the rainy season, new landslides continued to occur from June 20 on. At the request of the Sabo (Erosion and Sediment Control) Department of the Ministry of Land, Infrastructure, Transport and Tourism, emergency aerial photos were taken in two districts in Kumamoto. The following items from the detailed orthoimages derived from newly taken aerial photos and the base maps for emergency restoration measures (quick version) were incorporated into these photo maps: contour lines, annotations, numerical values of elevation points, and administrative boundaries. It should be noted that the annotations include geographical names and public facilities, as well as information on temporary housing required for restoration work. The orthophoto maps will be printed on paper, and also compiled as PDF and TIFF images. As soon as they are completed, they will be distributed to affected organizations. (Information current as of September 2016)
7. Concluding Remarks
This paper is a summary of the disaster responses such as emergency photography taken in disaster areas in Kumamoto Prefecture by the National Mapping Department from April to end of September 2016.
As part of the emergency responses, immediately after the earthquake, efforts were made to quickly compile Fig. 13 Enlargement of a base map for emergency restoration
measures (rapid version)
Fig. 14 Photo map for emergency restoration measures (quick version)
Fig. 12 Base map for emergency restoration measures (rapid version)
Finally, we sincerely hope that the information compiled and provided so far will be utilized by relevant organizations in disaster-related work, on site and elsewhere, and that it will also be of some help in supporting restoration efforts in disaster areas.