Application of Remote Sensing and GIS Techniques for Analysis of
Lake Water Fluctuations and the Potential Impact of Human
Activities: Case Study on Ogii Lake Basin in Mongolia
A Thesis
submitted in partial fulfillment of the requirement for the
degree of
Doctor of Philosophy
by
Amgalan Magsar
(Student Number: 2017DAC001)
Supervisor: Prof. Toru Matsumoto
Department of Life and Environment Engineering
The University of Kitakyushu
Graduate School of Environmental Engineering
The University of Kitakyushu
Japan
Application of Remote Sensing and GIS Techniques for Analysis of Lake Water
Fluctuations and the Potential Impact of Human Activities: Case Study on Ogii Lake Basin
in Mongolia
byAmgalan Magsar
Submitted to the Graduate School of Environmental Engineering in partial fulfillment of the requirement for the degree of
Doctor of Philosophy
Author ………
Amgalan Magsar
Graduate School of Environmental Engineering
Supervisor ……….
Toru Matsumoto
Professor, Course of Environmental and Ecological System
Graduate School of Environmental Engineering This doctoral thesis has been examined by a Committee of the Graduate School of
Environmental Engineering, The University of Kitakyushu Professor Toru Matsumoto ………
Chairman, Thesis Committee
Professor, Department of Life and Environmental Engineering
Professor Atsushi Nogami ……… Member, Thesis Committee
Professor, Department of Life and Environmental Engineering
Professor Tohru Futawatari ……… Member, Thesis Committee
Professor, Department of Life and Environmental Engineering
Associate Professor Hiroshi Murakami ……… Member, Thesis Committee
Associate Professor, Department of Mechanical Systems Engineering
湖水変動と人間活動の潜在的影響分析に対する
リモートセンシング及び GIS 技術の適用
:モンゴル 0gii 湖流域のケーススタディ
博士論文 アマガラン マグサル (学籍番号: 2017DAC001) 指導教員: 松本 亨 国際環境工学部 環境生命工学科 教授 公立大学法人北九州市立大学 国際環境工学研究科 2021 年 3 月湖水変動と人間活動の潜在的影響分析に対する
リモートセンシング及び GIS 技術の適用
:モンゴル 0gii 湖流域のケーススタディ
博士論文 著者:アマガラン マグサル 国際環境工学研究科 環境システム専攻 環境生態システムコース 指導教員: 松本 亨 国際環境工学部 環境生命工学科 国際環境工学研究科 環境システム専攻 環境生態システムコース 教授 論文審査委員会 主査 松本 亨 国際環境工学部 環境生命工学科 教授 副査 野上 敦嗣 国際環境工学部 環境生命工学科 教授 二渡 了 国際環境工学部 環境生命工学科 教授 村上 洋 国際環境工学部 機械システム工学科 准教授v Contents
List of tables ... vii
List of figures ... viii
List of acronyms ... x Acknowledgement ... xi Summary ... 1 Summary in Japanese ... 3 Chapter 1 Introduction ... 5 Climate condition ... 5
Soil, vegetation and land resources ... 8
Description of study area and water resources ... 10
Literature review ... 11
Chapter 2 Research objective and methodology ... 14
Research objective ... 14
Research methodology ... 14
Chapter 3 Study on environmental characteristics of Ogii Lake ... 16
Research background ... 16
Research methods ... 20
3.2.1 Field survey – water sampling ... 20
3.2.2 Research methods for water quality analysis ... 21
3.2.3 Questionnaire survey ... 24
3.2.4 Research method for investigating the potential generation of livestock related pollution... 26
Result of field survey ... 27
3.3.1 Water quality of Ogii Lake, Khugshin Orkhon River, and streams in Orkhon Valley ... 27
3.3.2 Results of the questionnaire survey ... 33
3.3.3 Result of estimated livestock excreta pollution around Ogii Lake ... 34
3.3.4 Emission prediction of livestock waste generation in the Ogii Lake County... 35
Summary ... 39
Chapter 4 Study on climate change impact on the Ogii Lake Basin ... 40
Research background ... 40
Data collection ... 44
4.2.1 Satellite remote sensing images... 44
4.2.2 Available station data: ... 44
4.2.3 Global reanalysis data: ... 45
4.2.4 GPCC precipitation data: ... 45
vi
4.3.1 Satellite image processing & analysis ... 46
4.3.2 Historical reanalysis data analysis ... 48
Estimation of changes on Ogii Lake water surface area using satellite remote sensing ... 51
Estimation of evaporation from Ogii Lake using the energy budget method... 56
Estimation of water balance of the Ogii Lake ... 60
Summary ... 63
Chapter 5 Study on potential groundwater zone of the Ogii Lake Basin ... 64
Research background ... 64
Data collection and research methods ... 64
5.2.1 Land use land cover classification technique ... 64
5.2.2 Soil map generation ... 65
5.2.3 Rainfall map generation ... 65
5.2.4 Digital elevation model ... 66
5.2.5 Slope and drainage density generation ... 66
Result ... 69
5.3.1 Digital elevation model ... 70
5.3.2 Drainage density ... 71
5.3.3 Slope ... 72
5.3.4 Rainfall ... 73
5.3.5 Land use ... 74
5.3.6 Soil properties ... 75
Delineation of groundwater potential zone ... 76
5.4.1 Validation of groundwater potential zones ... 77
Summary ... 78
Chapter 6 Discussion: Summary of key findings and recommendations ... 78
Summary of key findings ... 78
Recommendations ... 81
Chapter 7 Conclusion, limitation of this study and further studies ... 84
Conclusion ... 84
Limitation of this study and further studies ... 84
Reference ... 85
Annex ... 90
vii List of tables
Table 3.1 Permissible level of surface water variables in Mongolian National Standard ... 23
Table 3.2 Classification of water quality index ... 23
Table 3.3 Population, livestock, and herder’s census data ... 26
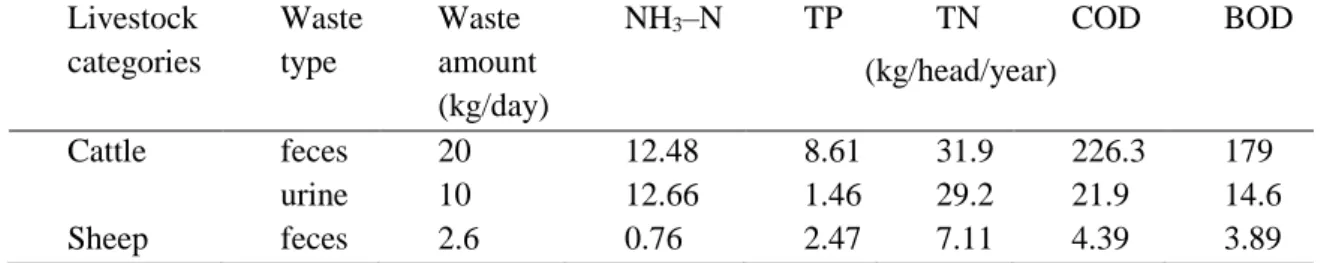
Table 3.4 Average waste generation and pollutants of cattle and sheep ... 27
Table 3.5 Daily discharge data of Old Orkhon River at Kharkhorin Station (m3/s) ... 29
Table 3.6 Water analysis results of July 2017 ... 31
Table 3.7 Water analysis results of August 2018 ... 32
Table 3.8 The annual potential pollutants load around Ogii Lake ... 34
Table 3.9 Population growth rate in country and subdivision ... 35
Table 3.10 Growth rate by livestock categories ... 35
Table 3.11 The yearly growth rate for both cattle and sheep in Ogii Lake County ... 36
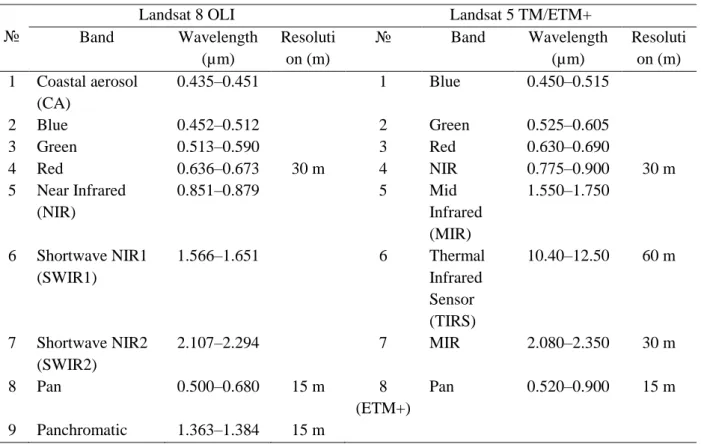
Table 4.1 The difference in band range and resolution between the OLI sensor and TM sensor ... 45
Table 4.2 Multiband indices used for water feature extraction ... 47
Table 4.3 Details of Landsat 8 OLI images and field survey dates ... 51
Table 4.4 Comparison between the in-situ measurement and different water indices for estimating the surface area of Ogii Lake ... 51
Table 4.5 Monthly average lake surface area fluctuation (km2) using MNDWI-1 ... 53
Table 4.6 Monthly total precipitation (mm) in Ogii Lake basin /2001–2019/ ... 55
Table 4.7 Comparison of climatic variables and morphometric parameters of the Ogii Lake in September (2002–2019) ... 60
Table 4.8 The morphometric parameters of reference data ... 61
Table 4.9 The volume of the Ogii Lake between 2002 and 2019 ... 62
Table 4.10 Water balance of the Ogii Lake ... 63
Table 5.1 AHP numerical value classification ... 68
Table 5.2 Random index (RI) corresponding to the number of criteria (n) ... 68
Table 5.3 Pair-wise comparison matrix for the AHP process ... 69
Table 5.4 Normalized pair-wise comparison matrix and weights obtained for the thematic parameters ... 69
Table 5.5 Probability rating for the parameters ... 70
Table 5.6 Groundwater potential zone of the study area ... 77
Table 6.1 Potential pollutants from cattle (ton/year) ... 82
Table 6.2 Potential pollutants from sheep (ton/year) ... 82
Table A.1 Total number of livestock and available wells ... 90
Table A. 2 Total annual precipitation and evaporation ... 90
Table A. 3 Lake morphology and climate variables ... 90
Table A.4 Experts’ pair-wise comparison matrices for the AHP ... 93
viii List of figures
Fig. 1.1 Climate zone classification of Orkhon River Basin ... 5
Fig. 1.2 Percentage of annual total precipitation in the Kharkhorin station /1974-2018/ ... 6
Fig. 1.3 Annual total rainfall and snowfall in the Kharkhorin station /1974–2018/ ... 6
Fig. 1.4 Mean air temperature in the Kharkhorin station (1974–2018) ... 7
Fig. 1.5 Monthly average temperature and precipitation in the Kharkhorin station (1974–2018) ... 8
Fig. 1.6 Desertification rate in Orkhon River Basin ... 9
Fig. 1.7 Location of the study area ... 11
Fig. 1.8 Tectonic fault and depression of Ogii Lake ... 13
Fig. 2.1 Research framework–1 ... 15
Fig. 3.1 Research framework–2 ... 20
Fig. 3.2 Map of water sampling sites along Orkhon Valley, Mongolia (R–river water; S–spring and stream; L–Lake water; G–Groundwater)... 20
Fig. 3.3 Equipment used for water quality analysis ... 22
Fig. 3.4 Research framework–3 ... 25
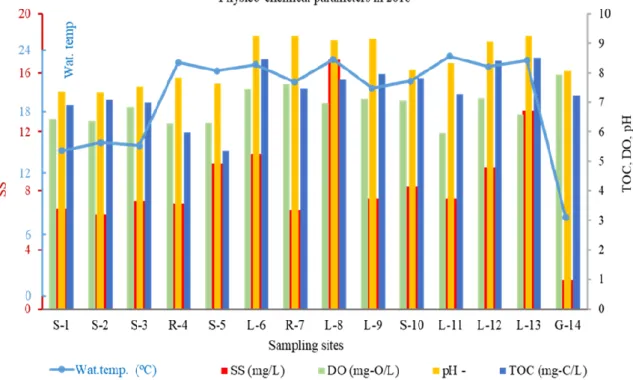
Fig. 3.5 Physicochemical parameters of water samples a) 7–8 July 2017; b) 23–24 August 2018... 30
Fig. 3.6 Water quality of sampling sites in 2017 and 2018 ... 30
Fig. 3.7 Hardness water samples in 2017 and 2018 ... 30
Fig. 3.8 Household distribution around Ogii Lake in 2016 ... 34
Fig. 3.9 Correlation between actual and predicted livestock population in Ogii Lake County, a) cattle and b) sheep ... 36
Fig. 3.10 Livestock population growth prediction in Ogii Lake County a) population of cattle, b) population of sheep ... 36
Fig. 3.11 Prediction for livestock potential excreta pollutants (kg/year) a) Pollutants from cattle, b) Pollutants from sheep c) Total amount of potential excreta pollutants in Ogii Lake County ... 37
Fig. 3.12 Total livestock water demand in Ogii Lake County ... 38
Fig. 4.1 Land surface temperature change trend at Tsetserleg station in Arkhangai Province ... 41
Fig. 4.2 Ogii Lake water level fluctuation, cm ... 41
Fig. 4.3 Monthly averages discharge of Khugshin Orkhon River /1977–2019/ ... 42
Fig. 4.4 Research framework–4 ... 44
Fig. 4.5 Linear regression for a relationship between GPCC model and precipitation data of the Kharkhorin station ... 46
Fig. 4.6 Comparison of different water indices ... 52
Fig. 4.7 Correlation between lake level and surface area (a) NDWI, (b) MNDWI-1 ... 52
Fig. 4.8 Monthly lake surface area fluctuation between 2002 and 2019 ... 53
Fig. 4.9 Mapping of surface area of Ogii Lake in September of every year between ... 54
Fig. 4.10 Monthly total precipitation in Ogii Lake Basin (GPCC) ... 56
Fig. 4.11 Comparison of the total annual evaporation and precipitation, mean annual solar net radiation with mean annual lake surface area changes in August (1986–2019) ... 57
ix Fig. 4.13 Correlation of estimated lake water surface and a) observed lake water level, b) estimated
lake water surface evaporation, c) observed precipitation (GPCC) ... 59
Fig. 4.14 Comparison of climatic variables and changes on lake morphology, monthly lake area fluctuation using NDWI, MNDWI1 /2002-2019/ ... 60
Fig. 4.15 Depth of the Ogii Lake ... 61
Fig. 5.1 Location map of the study area ... 65
Fig. 5.2 Flowchart for groundwater potential zone ... 66
Fig. 5.3 Mapping of the DEM of the study area ... 71
Fig. 5.4 Drainage density of the study area ... 72
Fig. 5.5 Slope of the study area ... 73
Fig. 5.6 Rainfall classification of the study area ... 74
Fig. 5.7 LULC classification of the study area ... 75
Fig. 5.8 Soil type of the study area ... 76
Fig. 5.9 Groundwater potential zone of the study area ... 77
Fig. 6.1 Location of the herders and existing wells at the different distances from the lake ... 80
Fig. 6.2 Potential pollutants around Ogii Lake... 82
Fig. 6.3 Potential pollutants around the lake a) cattle, b) sheep ... 83
Fig. A. 1 Different classes of rainfall in 2019 a) 1 classes, b) 2 classes, c) 3 classes, and d) 5 classes 95 Fig. A.2 GWPZs of the Ogii Lake Basin in 2019 based on the different classes ... 96
x List of acronyms
AHP – Analytical Hierarchy Process BOD – Biological Oxygen Demand COD – Chemical Oxygen Demand DEM – Digital Elevation Model DO – Dissolved Oxygen
DD – Drainage density
ECMWF – European Centre for Medium – Range Weather Forecast ERA – Fifth major global reanalysis produced by ECMWF
ESRI – Environmental System Research Institute GIS – Geographic Information System
GPCC – Global Precipitation Climatology Centre GWPZs – Groundwater potential zones
JICA – Japan International Cooperation Agency IPCC – Intergovernmental Panel on Climate Change LULC – Land use and land cover
MCDM – Multi criteria decision making
MNDWI – Modified Normalized Difference Water Index MNE – Ministry of Nature and Environment of Mongolia MSS– Multispectral Scanner
NDVI – Normalized Difference Vegetation Index NDWI – Normalized Difference Water Index NIR – Near infrared reflectance
NOAA National Oceanographic Atmospheric Administration OLI – Operational Land Imager
RED – Visible red reflectance RS – Remote Sensing
SM – Standard method SS – Suspended solid
TIRS – Thermal Infrared Sensor TM – Thematic Mapper instruments TN – Total nitrogen
TP – Total phosphorus
PSL – Physical Science Laboratory
UNESCO – United Nations Educational, Scientific and Cultural Organization UTM – Universal Transverse Mercator
WMO – World Meteorological Organization WQI – Water Quality Index
xi Acknowledgement
There have been many people who was encouraging me to complete my Ph. D research in Japan. First of all, I would like to thank to my research supervisor Prof. Toru Matsumoto. It was a great opportunity to do my Ph. D research under his valuable advice and supervision. He supported me a lot during my doctorate years. Without his great supervision and kindness my research could not be completed successfully. It was wonderful four years to achieve my goal through improving a research collaboration, and skills.
Secondly, I would like to thank to Prof. Hidenari Yasui, without his support it was not able to do the important analysis using the modern techniques, and develop the research article. Also, I would like to thank Prof. Ulaanbaatar Tarzad, Prof. Tsoggerel Tsamba, and D.Eng. Enkhtsolmon Otgonbayar who was supported me a lot to apply for Doctoral degree course at the Faculty of Environmental Engineering, The University of Kitakyushu with fully funded scholarship by Mongolian-Japanese Engineering Education Development (MJEED) project sponsored by JICA. Part of my research was completed under the joint research project “Study to develop strategies to reduce desertification, water quality contamination, soil degradation ecology in the Orkhon Valley and Ogii Lake Basin” (J22D16-3).
I wish to express my sincere thanks to Nandintsetseg Nyam-Osor and Erdenetuya Chultem. Their involvement for the field surveys was very helpful to gain an important information. Also, I would like to express my thanks to Prof. Erdenesukh Sumya, Sandelger Dorligjav, and Altanbold Enkhbold who provided a valuable data for my research. It was a great experience to work with very supportive people who involved and encouraged me during this time. My special thanks to my parents Magsar Rentsendorj and Dolgor Sonom as well as for my family members for always pay attention on my feelings, health and extending their warm wishes to inspire me while staying in abroad.
Finally, thanks and appreciation are also extended to all my friends and colleagues who have been discovering this great world with me and being a part of my life.
1 Summary
This study focused on one of the Mongolian Lake, Ogii Lake located in the valley of the Orkhon River comprising extensive alluvial areas of grassland, river channels, pools and marshes surrounded by grassy steppe. Ogii Lake is registered as an International Ramsar Convention site, particularly due to its status as a waterfowl habitat in 1998. In this research, the impact of global climate change and human activities on Ogii Lake Basin were studied using Remote Sensing (RS), and Geographical Information System (GIS). Mongolia is the most vulnerable country in the world to adverse impact of climate change, and livestock is one of the main sectors that consist of Mongolian gross domestic products. In recent decades, the number of livestock is rapidly increasing while the available water resources have been dried out due to several impacts of human activities as well as climate change. Due to the increase in livestock number along the river and lake shore, the potential discharge of livestock excreta pollutants to water bodies increase, that leads to the degradation of water quality and pastureland. In the literature, livestock waste generation related studies are rarely found in the case of Mongolia. This research was based on the three main part of research.
In the first part of research, the GIS techniques were applied for generating the livestock distribution map around the Ogii Lake based on the statistical data and herders’ location in 2016. Based on livestock waste generation, excreta pollutants such as chemical oxygen demand, biological oxygen demand, total nitrogen, total phosphorus, and ammonia were calculated using livestock population in different radiuses from the lake. Also, water samples from Ogii Lake Basin were analyzed in 2017, and 2018. Questionnaire survey was also conducted to estimate the human activities and influence in the lake ecosystem. According to the water quality analysis Ogii Lake and Khugshun Orkhon River’s water was classified as clean and slightly polluted water both in 2017 and 2018. However, human waste generation was found to be a harmful consequence of seasonal tourism in the Ogii Lake environment due to a lack of proper management of lake-based tourism, as well the living habits of local people. The result was illustrated that the livestock-related pollutants and the water demand for the expected livestock in 2036 would be increased by 3.8 times, that would be account as 1288.07 ton NH3-N,
11358.11 ton COD, 9062.76 ton BOD, 1461.03 ton TP, and 5427.33 ton TN, and 876.809 cubic meters, respectively.
The second part of this research was focused on correlation between climatic variables and monthly lake water surface area changes based on obtained climatic data, RS, and GIS techniques. Globally, many researchers applied the RS and GIS for hydrological studies. Delineation of surface water area using the satellite images is the most applicable, low-cost method. During the last decades, Ogii Lake’s surface area has fluctuated, surface inflow and outflow of the lake has dried out for several years. The on-site measurement was conducted three times in May, July, and September in 2020 to measure the lake water surface area as a reference. Landsat 8 OLI images which has close acquisition dates with field survey was obtained from the Earth Explorer to estimate the surface area of Ogii Lake using four different indices such as Normalized Difference Vegetation Index (NDVI), Normalized Difference Water Index (NDWI), Modified Normalized Difference Water Index (MNDWI-1 and MNDWI-2). Based on the field survey result, the most accurate water index for delineating the surface area of Ogii Lake was MNDWI-1 (R=0.94, p < 0.01). Moreover, the energy-budget
2 method was used to estimate the lake water evaporation based on the historical reanalysis (ERA5) daily data between 1986 and 2019 which was provided by the European Centre for Medium–Range Weather Forecast. The results illustrated that total annual evaporation from the lake has increased since 1995. The total annual evaporation from Ogii Lake increased steadily over the last three decades; comparing to 1989, annual evaporation increased by 20.02, 25.79, and 32.4 mm in 1999, 2009, and 2019, respectively. Comparison of climatic variables and estimated surface area was illustrated that Ogii Lake’s surface area has weak correlation with precipitation, and evaporation. Therefore, precipitation is not a main part of the water source for Ogii Lake. The result of the estimated water balance between 2016 and 2019 was demonstrated that the both surface and groundwater have a considerable influence on Ogii Lake’s water balance.
The third part of this research was studied the groundwater potential zones (GWPZs) of Ogii Lake through integrating the Analytical Hierarchy Process, Multi Criteria Decision Making methods. According to the classification of GWPZs, Ogii Lake area was coincided in high to very high zones. The highest GWPZs of the Ogii Lake Basin was coincided with the deepest part of the lake, where the tectonic fault cross Ogii Lake. The results of delineation of potential groundwater zones show that there is a possibility to solve the source of drinking water that is essential for both herders and livestock through drilling wells, which could reduce the potential discharge of livestock related pollutants to the lake and inflow river. The case study on Ogii Lake shows that is possible to reduce budget expenditures on hydrological surveys while integrating the RS and GIS technology. Such results could provide valuable information for decision makers to implement a water resource management and reduce the environmental pollution.
In order to protect the Ogii Lake ecosystem, the lake based tourism needs to be urgently improved through announcing a tender for companies those who could serve environmentally friendly tour services. Sufficient number of waste containers should be installed at the dumpsites; parking lots, and a composting toilets also need to be installed considering on the number of tourists and herders. The livestock access to the lake and inflow river should be restricted.
3 Summary in Japanese 要旨 本研究は、モンゴルのオルホン渓谷にある Ogii 湖を対象とした研究である。この 湖は川や池、草原に囲まれた湖であり、1998 年にラムサール条約に登録された自然 保護区でもある。本研究では、地球規模での気候変動と人間活動が Ogii 湖流域に与 える影響を、リモートセンシング(RS)と地理情報システム(GIS)を使用して調査 した。モンゴルは気候変動の悪影響に対して世界で最も脆弱な国の一つである。ま た、モンゴルにおいて畜産業は主要な産業の 1 つであり、ここ数十年で、家畜の数 は急速に増加している。一方で、利用可能な水資源は、人間活動や気候変動の影響 により減少している。特に、川や湖の沿岸域での家畜頭数の増加により、家畜排泄 物由来の汚染物質が増加し、その影響による水質や牧草地への悪化が指摘されてい る。しかしながら、モンゴルにおいて家畜排泄物の環境影響に焦点を当てた研究は ほとんどないのが現状である。 本研究は、大きく 3 つの項目で構成している。 第 1 部では、まず GIS を用いて、2016 年の統計データと遊牧民の位置情報をもと に Ogii 湖周辺の家畜分布図を作成した。その際、家畜の個体数をもとに家畜廃棄物 由来の、化学的酸素要求量と生物化学的酸素、全窒素、全リン、アンモニアなどの 排泄物汚染物質を試算した。さらに、2017 年と 2018 年の Ogii 湖流域の水をサンプ リングし、分析するとともに、人間の活動と湖の生態系への影響を推定するために アンケート調査を実施した。水質分析によって、Ogii 湖とクグシュンオルホン川の 水域は、2017 年と 2018 年のいずれにおいてもきれいではあるが、わずかに汚れてい ると分類された。しかしながら、湖を基盤とした観光と地元住民の生活習慣によっ て、観光シーズンは Ogii 湖の環境が悪くなることが判明した。シミュレーションに よると、家畜由来の汚染は、2036 年には 3.8 倍に増加すると推計されその量は、NH3 -N が 1,288.07 トン、COD が 11,358.11 トン、BOD が 9,062.76 トン、総リン(TP)が 1,461.03 トン、総窒素(TN)が 5,427.33 トンと、876.809m3になることが推計され た。 第 2 部では、得られた気候データ、RS、GIS データを用いて、湖の表面積の月ごと の変化と気候の関係を把握した。なお、世界中で、多くの研究者が水文学研究に RS と GIS を適用しており、衛星画像を使用して地表水域を把握することは、最も適切 で費用対効果の高い方法である。過去数十年間の間に、Ogii 湖の表面積は変動し、 数年前から乾燥している。2020 年 5 月、7 月、9 月に 3 回現地調査を実施し、湖の地表水 域面積を測定した。現地調査に最も近い Landsat8 OLI の画像をは、衛生から取得し、 正規化植生指数(NDVI)、正規化水指数(NDWI)、改良正規化水指数(MNDWI-1、 MNDWI-2)の 4 つの異なる指標を用いて Ogii 湖の表面積を推定した。現地調査の結果 によると、Ogii 湖の表面積を表す最も正確な指標は MNDWI-1(R = 0.94、p <0.01)であっ た。さらに、エネルギー収支法を用いて、ヨーロッパ中期天気予報センターから提供された 1986 年から 2019 年までの過去の再分析(ERA5)の日次データをもとに湖の水分蒸発量を推 定した。その結果、湖からの年間総蒸発量が 1995 年以降増加していることが示された。 Ogii 湖からの年間総蒸発量は、1989 年と比較して、年間蒸発量は 1999 年、2009 年、2019
4 年でそれぞれ 20.02mm、25.79mm、32.4mm と過去 30 年間で着実に増加していることがわかっ た。気候と推定表面積を比較すると、Ogii 湖の表面積は降水量と蒸発量と弱い相関関係が あることがわかった。したがって、Ogii 湖にとって降水量は主な水源ではないことがわか った。2016 年から 2019 年まで水の収支を推計した結果、地表水と地下水の両方がOgii湖の 水収支に大きく影響を及ぼしていることが示された。 第 3 部では、階層分析法と多基準意思決定法を統合することにより、Ogii 湖の地下水ポ テンシャルゾーン GWPZs を解析した。GWPZs の分類によると、Ogii 湖流域ではとても高 いゾーンにおいて一致していた。Ogii 湖流域の最も高い GWPZ は、構造断層が Ogii 湖を横切る湖の最深部と一致していた。地下水域のポテンシャル量を推計した結果、 井戸を掘削することにより、遊牧民と家畜の両方にとって必要な飲料水源を確保す ることができる可能性が示された。これによって、家畜に起因する汚染の湖や流入 河川への流出を減らすことができると考えられる。Ogii 湖を対象としたケーススタ ディにおいて、RS と GIS 技術を統合することで、水文調査における経費を削減でき る可能性があることも示された。この結果は、環境汚染を減らすために水資源の管 理を実施している意思決定者に貴重な情報を提供することが可能となる。 Ogii 湖の生態系を保護するためには、環境に配慮した観光サービスを供給するこ とが可能な企業への入札を発表することにより、湖を基盤とした観光を早急に改善 することが必要である。また、ごみ箱を十分に設置するとともに、観光客数や遊牧 民数を考慮して、駐車場やバイオトイレを設置するとともに、湖や流入河川への家 畜のアクセスは制限するべきである。
5 Chapter 1 Introduction
Climate condition
Central Asia, including Mongolia, is located in the triangle of the Westerlies, the East Asian Monsoon and Indian Monsoon. Mongolia occupies a region of extreme continentally. The climate becomes increasingly moist from south to north due to decrease in temperature and increases in precipitation[1]. Mongolia is one of the most vulnerable countries in the world to adverse impacts of climate change because of its specific geographical location, weather and climate conditions. Extremely dry air causes a strong radiative cooling of the surface and temperature regime in winter in most part of Mongolia controlled by high pressure, including the stable so called Siberia-Mongolian High (SMH) with short period interruption due to infrequent cyclonic activities[2].
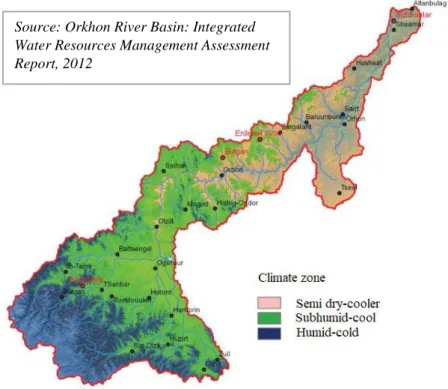
B.Jambaajamts (1989) divided Mongolia into 3 climate zones such as a humid-cold, subhumid-cool, and semidry-cooler. A humid-cold zone, which is elevated more than 1800 m, a subhumid-cool zone - elevated between 1300 m and 1800 m, and a semidry-cooler zone which is elevated between 700 m and 1300 m above sea level. Ogii Lake is located in the subhumid-cool zone which is elevated 1332 m above sea level (Fig. 1.1). The Ogii Lake Basin is characterized by an extremely continental climate with cold and dry winters dominated by the SMH, and warm and humid summers.
The mean annual temperature is about −2°C, and the mean annual precipitation ranges from 250 to 300 mm and occurs mostly in June, July and August. The continentally causes a strong seasonality in temperature and precipitation. Highest precipitation rates generated by heavy rainfalls are found in summer, while precipitation in winter (November to March) occurs mostly in solid form and rarely exceeds 10 mm per month. Percentage of annual total precipitation in the Kharkhorin station which is 60 km distance from the lake is shown in Fig. 1.2.
Fig. 1.1 Climate zone classification of Orkhon River Basin Source: Orkhon River Basin: Integrated
Water Resources Management Assessment Report, 2012
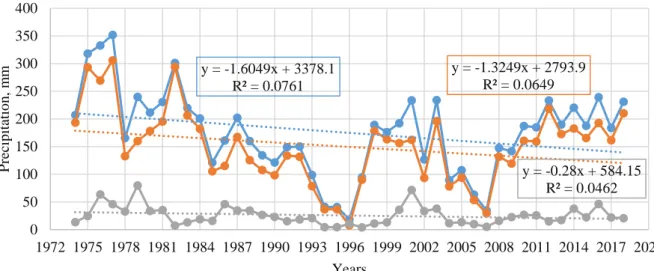
6 According to the observation data at the Kharkhorin meteorological station, average percentage of the rainfall (summer precipitation) accounts approximately 88 percent of total annual precipitation. The percentage of summer rainfall and winter precipitation (snowfall) has changed slightly since 1974.
The precipitation trends at the Kharkhorin station between 1974 and 2018 are shown in Fig.
1.3. Considering the historical precipitation trend, the total annual precipitation sharply dropped
from 1992 to 1996, and 2003 to 2007. The highest total annual precipitation (352 mm) occurred in 1977, while the lowest value accounted 18.1 mm in 1996. In 2007, the total annual
precipitation accounted for 34.6 mm, which is the lowest amount during the last decade. Winter
precipitation exceeded 50 mm several times, which could strongly affect the local livestock herders. For instance, snowfall accounted as 79.9 mm and 71.6 mm, while mean air temperature in the winter account -13.9 °C and -18.0 °C in 1979 and 2001 respectively. Changes in precipitation due to climate change affect the seasonal and annual runoff.
0 10 20 30 40 50 60 70 80 90 100 P er ce n tag e o f p rec ip itatio n ( %) Years
Precipitation in winter Precipitation in summer
Fig. 1.2 Percentage of annual total precipitation in the Kharkhorin station /1974-2018/
y = -1.6049x + 3378.1 R² = 0.0761 y = -1.3249x + 2793.9 R² = 0.0649 y = -0.28x + 584.15 R² = 0.0462 0 50 100 150 200 250 300 350 400 1972 1975 1978 1981 1984 1987 1990 1993 1996 1999 2002 2005 2008 2011 2014 2017 2020 P rec ip itatio n , m m Years
SUM Summer total Winter total
Linear (SUM) Linear (Summer total) Linear (Winter total )
7 The impacts of global warming on lakes include an extended growing period at high latitudes, where climate models indicate increased precipitation, while water levels at mid- and low latitudes are projected to decline. Endorheic (terminal or closed) lakes are most vulnerable to a change in climate because of their sensitivity to changes in the balance of inflows and evaporation[3]. Changes in inflows to such lakes can have very substantial effects under some climatic conditions. Wetlands are especially vulnerable to changes in precipitation relative to evaporation because of their shallow depths and large surface to volume ratio. Special Report on Emissions Scenarios set up by IPCC, Batimaa et al., 2011 suggested that the rate of future
winter warming in Mongolia would vary from 0.9 °C to 8.7 °C, while summer temperature
would increase in a range from 1.3 °C to 8.6 °C, winter precipitation increase by range from
12.6 to 119.4% when the amount of summer rainfall varied from minus 2.5% to plus 11.3%.
Fig. 1.4 shows rapid increases starting from 1995 to 1997. In 1997, the highest temperature was observed during the period. And then, the summer temperature decreased rapidly between 1997 and 2006. According to the mean air temperature trend, air temperature from April to October has been increased (R2=0.3468) between 1974 and 2018, while the mean air temperature in the winter season (November to March) has increased slightly (R2=0.0044).
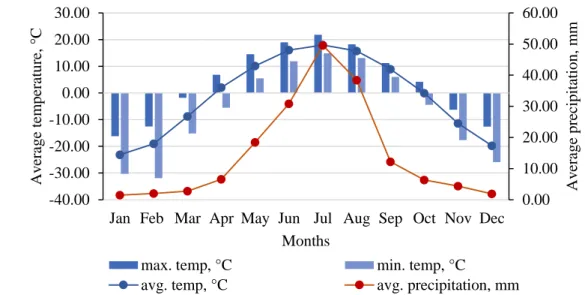
Winter temperature has dropped several years up to -21.7 °C in 2005, -19.7 °C in 2011 and 2012. However, in recent years the winter temperatures have increased, which accounted for -15.6 °C to -13.5 °C.
A monthly average temperature ranges between -23.16 °C and 17.94 °C during 1974–2018. An average minimum temperature ranges between -4.47 °C and -30.30 °C during October and March, the lowest temperature in February reaches -31.93 °C, while the highest temperature reaches about 14.88 °C in July. During this period, monthly average precipitation occurs 1.47 mm in January and 49.60 mm in July.
R² = 0.3468 R² = 0.0044 -25.0 -22.5 -20.0 -17.5 -15.0 -12.5 -10.0 -7.5 -5.0 -2.5 0.0 0.0 2.0 4.0 6.0 8.0 10.0 12.0 14.0 1974 1977 1980 1983 1986 1989 1992 1995 1998 2001 2004 2007 2010 2013 2016 Me an air tem p er au re °C (No v -Ma r) M ea n air tem p er atu re °C (A p r-Oct) Years
Mean temp IV-X Mean temp XI-III Linear (Mean temp IV-X) Linear (Mean temp XI-III )
8 Soil, vegetation and land resources
The study site is situated within the area of dry, grass steppes and is dominated by grasses (Cleistogenes, Stipa), forbs (Allium), and shrubs (Artemisia, Caragana) while trees are generally lacking[4]. Festuca-Poa-Carex montane steppe and Stipa-Cleistogenes-Artemisia steppe are the main vegetation types in the catchments of the Ogii Lake, where montane steppe mixed with Agropyron, Carex, Stipa, Artemisia, Thymus, etc. is distributed between 2300 and 1900 m a.s.l, and Stipa-Cleistogenes-Artemisia steppe mainly develops below 1900 m a.s.l[5]. Along with climate change and global warming, negative human activities including mining, road network concentration increase and they cause a change of land cover. The aridity is increased in the river basin and number of surface water sources is decreasing, including small rivers and springs. A total of 82 plant species of Orkhon River and Ogii Lake Basins belong to low land plant species. It means that this area is having some sort of pasture degradation. The desertification map developed by the Institute of Geo-Ecology of the Mongolian Academy of Science shows that the desertification in the Orkhon River Basin covers a total of 246.823 km2
of land or 45.9 percent of the total territory of the river basin. Desertification of Ogii Lake Basin is shown that northern site of the lake belonged to slightly, and southern site of the lake belonged to severely desertification. High density of livestock or overgrazing is one of the causes of desertification. The forest steppe plants in the pasture land, the percentage of many types of plants has decreased and low quality plants that tolerate livestock grazing very well increased. In such places, soil moisture is decreased and soils are compacted and become hard[6].
Fig. 1.5 Monthly average temperature and precipitation in the Kharkhorin station (1974–2018)
0.00 10.00 20.00 30.00 40.00 50.00 60.00 -40.00 -30.00 -20.00 -10.00 0.00 10.00 20.00 30.00
Jan Feb Mar Apr May Jun Jul Aug Sep Oct Nov Dec
A v er age pr eci pi tat ion, m m A v er age tem per at ur e, °C Months
max. temp, °C min. temp, °C
9 Fig. 1.6 Desertification rate in Orkhon River Basin
Wang et al studied the lithology and chronology of the study area using an 854-cm-long core (UG04 core) which drilled with gravitational piston corer in 2004 at the east-central part of the Ogii Lake where the water depth was 14.5 m. Three major lithofacies are distinguished from their study based on field visual inspection and laboratory analysis. Unit 1 (854–480 cm) and unit 3 (242–0 cm) are clayey silt layers, unit 2 (480–242 cm) is a silt layer with two carbonate-rich interlayers at 450–492 cm and 368–348 cm[5]. The Ogii Lake Basin is located within the zone of highly continental steppe soil formation. Soils found in the Ogii Lake Basin predominantly consist of Kastanozems while Regosols and Leptosols dominate on steep slopes and ridges. Soils are loamy to sandy riddled with a considerable amount of debris and pebbles that are often layered and adjusted[5]. Kastanozem are humus-rich soils that were originally covered with early-maturing native grassland vegetation, which produces a characteristic brown surface layer. Kastanozem found in relatively dry climate zones (200–400 mm) of rainfall per year, usually bordering arid regions such as southern and central Asia, northern Argentina, the western United States and Mexico[7]. The soil has light, sandy and clay combination of mechanic composition, medium size of petrifaction, with 18 cm humus depth and solution pH is neutral and alkaline (pH=7.17-7.57). Steppe kastanozem with combination of sand and light clay soil is located east and north east valley of the lake under grass-herb and grass –herb-wormwood types of vegetation. Light kastanozem soil with clay and sandy stratum distributed in the west and north-west side of the lake and formed under vegetation type with Achnatherum splendens. Light and carbonated kastanozem soil is formed under caragana bush-needle grass type of vegetation around north-western area of the lake. Sandy kastanozem soil with clay is formed under grass-herb and needle grass-wormwood vegetation in south plateau of the lake[8].
Source: Orkhon River Basin: Integrated Water Resources Management Assessment Report, 2012
10 Description of study area and water resources
Mongolia is situated on three international river basins such as the Arctic Ocean Basin, Pacific Ocean Basin, and Central Asian Internal Drainage Basin which covers an area of 20 percent, 12 percent and 68 percent of the country, respectively[9]. The Orkhon River (1124 km) is major tributary of Selenge Basin which originates in the Khangay mountains and it’s one of the major river of the Arctic Ocean Basin.
Total water resource of Mongolia is estimated to be 599 km3/year, and is composed mainly from water stored in lakes (83.5%), glaciers (10.5%) and rivers (5.8%)[10]. In the last 30 years the territory of glaciers and permanent snow in Mongolia decreased by 34.4–74%. There are around 1730 lakes, small lakes and shallow waters in the Orkhon Basin with around 100 of those having an area of more than 0.1 km2 by 1984. Previous studies[11],[12] have reported
that Ogii Lake was formed by the meandering of the Khugshin Orkhon River, which is originates from the eastern Khangay Mountains meanders across mountain steppes. The Khugshin Orkhon River flows into the Ogii Lake in the southwest, and the lake water over-flows into the Orkhon River in the northwest after a distance of 7 km (Fig. 1.7), this outflow river is only ephemerally active due to overflow from Ogii Lake. The inflow rate of Khugshin Orkhon River was reported as 0.43 m3/s in 2005 and 0.58 m3/s in 2006[8]. The Khugshin
Orkhon River's length is approximately 90 km, with a catchment area of 6210 km2. The lake is situated 1332 m above sea level[13] and has a maximum depth of 15.3 m (mean of 6.6 m), length of 7.4 km, and width of 5.3 km (mean of 3.4 km). The lake has a shoreline of 24.7 km and carries a water volume of ~0.171 km3 [14], and covers an area of 25.7 km2, approximately 50 percent of which is less than 3 m deep as a result of fluvial process[4]. Regarding the groundwater flow of the lake studied by literature, however, there is no highlights on the lake water supply[11]. In Ogii Lake, one gauging station is under operation since 2002. According to the observed water level at the Ogii Lake station, water level has been under fluctuation each year. In 2011, lake water level measured approximately 160 cm, which accounts more than 50 percent of decrease compare to 2004 (353 cm). Unfortunately, during the period of lake water fluctuation there is not available information about the Khugshin Orkhon River discharge, because the hydrological station in Khugshin Orkhon River closed in 1995 due to the several reasons.
The Ogii Lake Basin is a representative location of the dry steppe region of Mongolia[11], which is located at ~102.77º E, 47.76º N in the foothill piedmont area at the northern flank of the Khangay Mountains[15]. It has an extensive alluvial area of grasslands. River channels, pools and marshes at the western end and is surrounded by grassy steppe. Ogii Lake was registered as an International Ramsar Convention site in 1998, particularly due to its status as a waterfowl habitat. The site is very important breeding and staging area for a wide variety of waterfowl, particularly Anatidae[16].
There are 17 fish species of 12 families, 4 amphibian species, 70 mammal species of 17 families of 7 orders, and 245 bird species in the Orkhon Valley[17]. Due to mining activities in the upstream part of Orkhon River water quality of Orkhon and Khugshin Orkhon decreased, and fish species percentages of Ogii Lake have changed in some parts of the river channels[6]. In the last two decades, lake-based tourism, local stockholders with a lot of livestock concentrated surrounding the lake and its tributaries. The result is a consequence of land
11 degradation, overgrazing, and desertification. Livestock husbandry of residents and unplanned tourism facilities development in the shore of the lake, predator mammals are escaping from those areas that result in increased rodents’ population around the lake. More specific information on climate condition, and hydrological characteristics of the study area are given in the subsections.
Literature review
Globally, researchers have been investigating the impacts of climate change on lake and freshwater ecosystems for over two decades, and several comprehensive reports have been published by the Intergovernmental Panel on Climate Change (IPCC). Lake ecosystems are vital resources for aquatic wildlife and human needs. It always has been subject to the impacts of climate change, and natural climate variations in the past. Changes in air temperature and precipitation have direct effects on the physical, chemical, and biological characteristics of lakes indirectly via modifications in the surrounding watershed through shifts in hydrological flow pathways, landscape weathering, catchment erosion, soil properties, and vegetation[18]. Changes in the precipitation regime that accompany climate change have the potential to cause shifts in the connectivity of lakes (with biological implications, e.g., for migratory fish species), as well as in erosion rates that could affect the inflow and outflow dynamics of lakes. Shifts in precipitation relative to evaporation (the P/E ratio) cause changes in the water budget and hydraulic residence time of lakes, as well as in their depth and areal extent. Ponds and wetlands are especially vulnerable to changes in P/E because of their shallow depths and large surface to volume ratio[18]. Current global circulation models predict an increase in air temperatures of several degrees by the end of the twenty-first century, combined with large changes in the regional distribution and intensity of rainfall. These shifts in climate forcing appear to have already begun, and the onset of changes in the physical, chemical, and biological attributes of lakes is affecting their ability to maintain the present-day communities of aquatic plants,
Fig. 1.7 Location of the study area
12 animals, and microbes, and their capacity to provide ecosystem services such as safe drinking water and inland fisheries. Glaciers in many parts of the world are undergoing accelerated retreat, and glacial fed lakes and reservoirs are therefore particularly vulnerable to changes in their inflow regime. For example, the Chinese Academy of Sciences estimates that by 2050, up to 64% of China’s glaciers may have disappeared, with serious consequences for the estimated 300 million people who live in China’s arid west and who depend upon this vital water supply. At Lake Biwa, Japan, the reduced flow from snowpack in the surrounding mountains is thought to be a mechanism reducing cold underflows that play an important role in recharging the bottom waters of the lake with oxygen[18].
Various studies were carried out on the local climate and hydrological relationship on Ogii Lake Basin. Khosbayar et al., (2003) reported that Ogii Lake’s water level was about 5 to 6 meters higher than current water level in the early and mid-Holocene. Based on the distribution of plant dust in the lake, lake sediments were accumulated inconstantly, which is a sign of rapid climate change in a short period of time. Walter et al., (2005) were carried out paleo environmental studies of lake water fluctuations and Holocene climate change through sampling the bottom sediments of the lake at three different water level. The study found that the climate was cool in the early and middle Holocene, and relatively dry in the region during the late Holocene[13]. Wolfrang et al., (2008) analyzed lake sediment of the Ogii Lake based on chemical and mineralogical properties of the lake sediments (630 cm sediment core) to estimate the Holocene climate evolution of the Ogii Lake Basin. According to the principal component analysis (PCA) of the elemental composition of the samples from Ogii Lake sediment, the Ogii Lake record indicated that stable high lake levels from 2.8 kyr BP to present, thus suggesting enhanced moisture supply during the late Holocene. Low lake condition was identified during the Early Holocene (10.6–7.9 kyr BP. It is proposed that lakes in this area benefitted from increased discharge induced by glacier melting in the Khangay Mountains during a warm but relatively arid period. The Mid-Holocene (7.9–4.2 kyr BP) was characterized by generally higher lake levels and thus increased moisture supply. Yet, this period was prone to strong climate fluctuations. More arid conditions prevailed from 4.2–2.8 kyr BP and were followed by a stable, more humid phase until today[4]. Chinese researcher Wang Wei et al., (2009, 2011) analyzed the vegetation and climate change dynamics during the last 8660 cal. a BP in central Mongolia, based on a high resolution pollen record from Ogii Lake. They inferred four stages of climate changes such as a mild and semi-humid climate before 6860 cal. a BP with a remarkable cool and humid interval (8350–8250 cal. a BP), a prolonged warm and dry climate from 6860 to 3170 cal. a BP, a cooler and wetter climate between 3170 and 1600 cal. a BP, and an increased climatic instability after 1600 cal. a BP[5]. A similar study was conducted by the Japanese researcher Fukumoto (2012) based on the accumulation of plant and animal remains in Ogii Lake to identify environmental changes since the beginning of the Holocene. The study found that in the early Holocene, the climate was humid and cooler, and in the middle of the Holocene, the climate was dry. They also highlighted that regional climate change affected not only Mongolia but also Euro-Asia. However, during the Late Holocene, the low glaciation and short periods of drought periods were alternated. According to lake researcher J.Tserensodnom (1971 & 2000), the Ogii Lake watershed is fed by the Khugshin Orkhon River and runoff of Khugshin Orkhon River is regulated by the Orkhon River. Recently, S. Erdenesukh et al., (2020) investigated the impact of recent global climate change on the water
13 surface area of Ogii Lake. They analyzed various measured hydro-meteorological variables of the lake basin and lake surface area, which was estimated from Landsat series satellite images of each August from 1986 to 2018. They concluded that total annual evaporation and inflow river discharge were the essential hydro-meteorological factors affecting the surface area of the Ogii Lake.
The literature27) found a tectonic fault (Fig. 1.8) crossing the lake from west to east through
the highest depth (center) of Ogii Lake using Hypsometric Integral analysis, spatial improvement method, morphostructural and morphgeographic methods. They highlighted, the tectonic fault has same direction with Khoid Tamir River, and it crosses the lake after cross the Orkhon River horizontally. They concluded that, the Ogii Lake’s water fed by the surface and groundwater flow of Khugshin Orkhon River, Khoid Tamir River, and Orkhon River.
Fig. 1.8 Tectonic fault and depression of Ogii Lake
Provided by E. Altanbold et al. Journal of Geographic issue (2019)
14 Chapter 2 Research objective and methodology
Research objective
As mentioned in the previous chapter, Ogii Lake is one of the ecologically important lakes in Mongolia, registered at Ramsar's Convention in 1998. It is a freshwater lake located in the semi-arid region, which is the main tourist place in Arkhangai Province, central Mongolia. In recent years, due to increase in human activities along the lake shore, Ogii Lake’s ecosystem is under anthropogenic impact. Moreover, the Ogii Lake water surface area has been changed, and outflow from the lake has dried out for several years. Therefore, it’s important to study the impact of human activities and climate change impact on the ecologically important lake in the semi-arid steppe region in Mongolia. Objective of this research is to estimate the environmental characteristics of Ogii Lake considering the impact of climate change and anthropogenic effects on Ogii Lake’s water quality and quantity.
Research methodology
To achieve this goal, a qualitative and a quantitative analysis were conducted which may be divided into three steps.
Step one, field surveys were conducted in the summer of both 2017 and 2018. Water samples were collected from several springs, streams, rivers, and lake water in Ogii Lake Basin. A water quality analysis was carried out in the Recycling Engineering Laboratory at the Faculty of Environmental Engineering, The University of Kitakyushu. In 2018, a questionnaire survey also contacted both local households and tourist camp’s owners around the lake to evaluate the impact of human activities on the Ogii Lake environment. During the field surveys, I observed that herders grass their livestock close to the lake, and mostly horses, sheep and goats over stay near to lake shore, and along Khugshin Orkhon River during the day. Therefore, the potential excreta pollutants from livestock around Ogii Lake were estimated based on herder’s location and livestock numbers provided by the National Statistical Office (NSO). Based on statistical data, potential excreta pollutants of livestock in the Ogii Lake County were predicted in Excel.
Step two, the climate change impact on Ogii Lake Basin were studied based on monthly changes in lake water surface area and estimated evaporation from the Ogii Lake’s water surface area using satellite images and historical reanalysis data, respectively.
Step three, groundwater potential zone of Ogii Lake Basin was delineated based on integration of AHP, MCDM, RS, and GIS using six thematic layers.
A detailed information of each research method is described in the following chapters. The research framework–1 given in Fig. 2.1.
15 Fig. 2.1 Research framework–1
Chapter 1: Introduction
Chapter 2: Research objective &
methodology
Chapter 3: Study on environmental characteristics
of the Ogii Lake Basin
Field Survey (Water samples in 2017, 2018) Questionnaire Survey (Local residents and Tourist camps) Statistical data (NSO) (Livestock number and Herders' location)
Chapter 4: Study on climate change impact on the Ogii
Lake Basin Estimation of changes on the
surface area of Ogii Lake Satellite Remote Sensing Images (Landsat 5 TM Landsat 8 OLI) Field Survey (Measurement of Ogii Lake water surface area) Estimation of evaporation from the Ogii Lake Data collection (Climate Reanalysis and Precipitation data) Observation data (Hydro-meteorological data)
Chapter 5: Study on potential groundwater zone of the Ogii
Lake Basin Thematic layers (DEM, Soil, LULC, Slope, Drainage density, Rainfall) AHP& Multi Criteria Decision Making Technique Chapter 6: Discussion
Summary of key findings and recommendations
Application of remote sensing and GIS techniques for analysis of lake water fluctuations and the potential impact of human
16 Chapter 3 Study on environmental characteristics of Ogii Lake
Research background
Water pollution and land degradation is mostly related to population density, livestock density and overgrazing pastureland. Mongolia is a landlocked country in the Central Asian plateau. It is experiencing a significant modification of herding practices, combined with an increase in livestock numbers[19]. The livestock is one of the main sectors that consist of gross domestic products GDP, followed by the mining sector. Traditionally, nomadic herders have grazed the vast but fragile grassland by rotating animals over shared pasture in a seasonal species segregated pattern. Co-operation among herders was common, such as the traditional
Khot-ail (group of nomadic families), for sharing labor resources and controlling grazing use
without degrading the environment. Political and economic changes associated with the shift from command economy to market economy since 1990 have had a significant impact on herders and pasture land. Several studies revealed that nowadays the pastures are exposed to considerably higher grazing pressure, whereby sharp increases in animal numbers as a result of the introduction of market economy in the 1990s[20]. Increase of herders, livestock numbers and herding behavior/grazing patterns and breaking of wells has resulted in an overuse of pasture land and an expansion of grazing grounds into formerly unused areas, including protected areas. Overgrazing favors unpalatable plant species, reduces the vegetation cover and thereby reduces the moisture storage in the soil, leading to acceleration of desertification processes. Traditional herd composition has also shifted and the number of goats almost doubled. It is widely known that the goats have the most negative impact on grazing land due to their natural grazing behavior which involves uprooting the vegetation. This leads to almost irreversible degradation of pastures[16]. Almost 70% of total pastureland degraded to some extent, and widespread over-grazing has been documented[21]. Moreover, the impacts on stream water quality from livestock have changed in recent times; between 1990 and 2010, livestock numbers increased significantly in Mongolia[19]. According to livestock census data in 2018[22], 66.46 million livestock officially counted in Mongolia, and livestock densities reached approximately 42 head per km2 nationally, and 165 head per km2 in Ogii Lake County. Livestock population consist by 5.92 % horse, 6.6 % cattle/yak, 0.7 % camel, 45.97 % sheep, and 40.81 % goat at country level. Pastureland and drinking water availability are both important resources for herding livestock. As a result of the increase of livestock population, pastureland pressure raised, which instigated the pasture and soil cover degradation process[23]. In contrast, result of land degradation and climate change a drought (extended periods of deficient rainfall) occurs has increased in Mongolia which increase vulnerability and cause of mortality of livestock to harsh winters. Mongolian herders commonly classify dzuds into five types depending on the characteristics of the severe winter weather: (1) white dzud, deep heavy snow and cold temperatures; (2) black dzud, freezing temperatures and the absence of surface water and forage; (3) combined dzud, deep snow with a sudden drop in temperature; (4) iron dzud, impenetrable ice cover over the forage area; and (5) storm dzud, high winds and heavy snow[24]–[27]. Historical records indicate that fifteen dzuds occurred in the 18th century, thirty-one in the 19th century, and forty-three in the 20th century[28]. While dzuds were once predicted to occur every eight to twelve years, now expected every other year[29]. In the past two decades,
17 six dzuds have occurred in Mongolia. In the winter of 2009–2010 Mongolia experienced the most severe dzud about 8.5 million livestock had died, approximately 20% of the country’s livestock population[30]. However, the livestock population census has shown increased livestock population in the past 25 years’ period. On the other hand, a high density of livestock population also negatively influences water quality when free access to the water body. The current situation of drinking water sources of livestock is mostly surface water such as a river, stream, and a lake in the summer season. A considerable amount of literature has studied the influences of livestock production on water quality. Literature [19] found that livestock impacts affecting the water quality of streams have changed recently between 1990 and 2010 in Mongolia. A higher livestock density increases the risk of nutrients leaching into the environment[31]. Nutrient enrichment, along with excess sediment inputs, is the primary water quality issue for the most freshwater ecosystem in the world[32]. Maasri and Gelhaus (2011) found that the increase of livestock numbers is reaching beyond the grassland and affecting the stream ecosystem in Mongolia. Two major impacts were highlighted based on their study. Firstly, the extensive watershed and stream bank erosion, and secondly, the increase in the concentration of suspended particle and orthophosphate in the stream. At both the pasture and watershed scales, grazing animals negatively affect water quality when the number of animals exceeds the carrying capacity of the land[33]. A literature review[34] found a strong correlation between high livestock numbers and high biological oxygen diamond (BOD) from the direct discharge of farm effluents. The disposal of animal waste is a potential nonpoint source of water quality degradation, and it is characterized by a diffuse discharge of pollutants, generally over large areas such as pastures[35]. Livestock excreta contain a considerable amount of nutrients such as nitrogen, phosphorus, and potassium, as well as drug residues, heavy metals, and pathogens [36]. A consequence of significant enrichment of nitrogen and phosphorus in aquatic environments is eutrophication. Due to the high density of livestock located around Ogii Lake, the lake has found that having the phenomenon of eutrophication. Currently, no information is available regarding phosphorus excretion from the livestock in Mongolia [8]. Due to the huge number of livestock settling around the lake, and along the river that is only surface inflow to the lake livestock-related pollutants has been increased recently. The eutrophication in the northern side of the lake might be one of the indicators of the livestock-related pollutants. Since the hydrological station in Khugshin Orkhon River closed in 1995, water quality information limited until 2005. The Ministry of Nature and Environment of Mongolia (MNE), and the Japan International Cooperation Agency (JICA) implemented the Ogii Lake Ecosystem Conservation Project from August 15 to September 30, 2005, from July 18 to October 29, 2006. This previous study confirmed that the concentration of nutrients in Ogii Lake water was as low as 0.04 mg N/L, 0.001 mg N/L, 0.10 mg N/L, and 0.005 mg P/L for ammonia (NH3–N), nitrite (NO2),
nitrate (NO3), and Phosphorus (P), respectively [8]. However, the concentration of easily
oxidized organic matter such as the concentration of BOD in the water was relatively high at several points, such as the western parts and the bottom layer of the central point of the lake[8]. Geo-Ecological Institute of Mongolian Academy of Science (MAS) implemented the project that named “Ecological assessment of the Terkhiin Tsagaan Lake and Ogii Lake” in 2015. Ecological assessment of Ogii Lake has been carried out under this project. They found that dominant algal species in the northern side of the Ogii Lake was Rivularia planctonica in 2015. Colonies could be seen by eyes and were floating near water surface during on Sep 8, 2015.
18 Rivularia planctonica algal colonies are floating on the water surface
Rivularia planctonica algal cells (Source: Pictures obtained from the report of Ecological assessment of the Terkhiin Tsagaan Lake and Ogii Lake, 2015)
During the project at least 17 species belonging to 5 phyla have been observed in Ogii Lake on July 14, 2016. The dominant algal species is still Rivularia planctonica, one of the cyanobacteria, and the second large population was Aphanocapsa delicatissima, which is also a species of cyanobacteria. The literature highlighted that 1) Microbial populations were similar in samples collected form the lakeshore and lake center. Microbial population composition from the lake intake stands apart from all other lake water samples; 2) From the microbial population comparison, cow feces may be the major contamination sources (among three fecal samples tested) in Ogii Lake; 3) At least 15 common bacterial Operational taxonomic unit (OTUs) were found from all water and fecal samples and some of them were host-specific species. It is possible that lake water has been affected by all three types of feces[37].
Ogii Lake water quality
The Ogii Lake is the largest and ecologically important lake in Orkhon River Basin which is locates at relatively lower altitude than the upstream part, and mineralization in the Ogii Lake tends to increase. Ogii Lake water exchange process is relatively slow due to only one inflow and outflow in its west part which exists when the lake water level has increased. Ogii Lake water mineralization ranges 210–274 mg/L and it is subject to “fresh” according to classification by A.M. Ovchinnikov. There are two small lakes on the east of the Ogii Lake, big one’s mineralization is 312 mg/L and another one 620 mg/L. Water hardness of Ogii Lake ranges 2.70–3.20 mg-eqv/L, and Mg ion is dominant in its hardness that is different from other fresh water lakes[6].
The water quality of Ogii Lake depends on the water quality of Khugshin Orkhon River[38], which is unique surface inflow into the Ogii Lake[11]. In recent years, due to lake-based tourism and livestock settlements, the lake environment has been under pressure and has suffered degradation of its wetland area. Concentration of livestock around the lake led to the loss of habitats for migratory birds nesting around the lake. In addition, some part of the lake faced to the eutrophication.
19
Animal residues around the Ogii Lake in 2018
Since the lake-based tourism developed around Ogii Lake, transport and livestock holdings have been concentrated around the lake and its tributaries. According to the information from the Ogii Lake Information Center, tourist visits to the lake begin each year between June and August due to the suitable weather conditions during the summer vacation period in Mongolia. A preliminary sampling and analysis of the water conducted in 2017 under a joint research project funded by the Mongolia–Japan Higher Engineering Education Development (MJEED) Project. The results of joint research project in 2017 implied that the main cause of the water quality deterioration was the livestock in this region, with Ogii Lake experiencing eutrophication in recent years. It is, therefore, necessary to assess the potential load of the recent increase of livestock numbers on the lake and stream ecosystem by calculating the gross amount of pollutants, expressed as the amount of chemical oxygen diamond (COD), BOD, NH3–N,
20 Research methods
Based on current environmental issue of Ogii Lake Basin, the field and questionnaire surveys conducted in 2017 and 2018 according to the following research framework to investigate the environmental characteristics of Ogii Lake (Fig. 3.1).
Fig. 3.1 Research framework–2 3.2.1 Field survey – water sampling
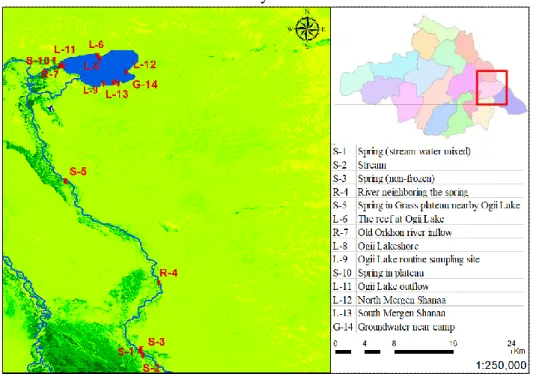
The water samples collected from stream, spring, Khugshin Orkhon River, and Ogii Lake during July 7–8, 2017 and August 23–24, 2018 (Fig. 3.2). In 2018, water sampling sites from the lake were extended based on the water analysis results of 2017.
Fig. 3.2 Map of water sampling sites along Orkhon Valley, Mongolia (R–river water; S–spring and stream; L–Lake water; G–Groundwater)
Field survey and data collection
Water sampling from several springs, streams, Khugshin Orkhon River,
and Ogii Lake water
Analysis of water Quality
Water quality of surface water in Ogii
Lake Basin
Questionnaire from the local residents and owner of the
tourist campuses
Assess the impact of human activities on Ogii
Lake environment
Statistical data for livestock provided by the National Statistical
Office
Statistical data analysis
Estimation of potential excreta pollutants from
livestock
Study on environmental characteristics of the Ogii Lake Basin
Mapping of livestock distribution
21 Photoshoot during the field survey in 2018
3.2.2 Research methods for water quality analysis
Water temperature, dissolved oxygen (DO), and pH were measured immediately at the sampling sites using calibrated portable meters (Oxi 3310; Multi 3630 IDS, WTW, Germany). Suspended solids (SS) were determined by first filtering water samples through membrane filter papers (GF/F Whatman, UK), which were then dried at 105 °C for 24 h in the laboratory at the University of Kitakyushu, Japan. Dried filters were subsequently weighed for SS. Chemical parameters were analyzed according to the Standard Methods for the Examination of Water and Wastewater [39], which associates a number for the standard method (SM) of each individual parameter. Concentrations of Ca, Al, Fe, Cr, Cu, Mn, Na, Pb, Zn, Li, Cd, Au, and As were measured by ion chromatography (ICP-MS #7900, Agilent, USA) as per SM 3125 B. K and Mg concentrations were analyzed by an atomic absorption spectrophotometer (AA240FS, Varian, USA) following SM 3111. NH3-N concentrations were measured by a
spectrophotometer (#7012, Hitachi, Japan) using a 5 cm glass cell in accordance with SM 4500 for NH3 H (flow injection analysis). Concentrations of Cl-, NO2-, NO3-, SO42-, F-, and PO4
3-were measured by inorganic ion chromatography (ICS-1500 Thermo Fischer, USA) as per SM 4500-Cl G, SM 4500-NO2- B, SM 4500-NO3- I, and SM 4500-SO42- G, respectively. Total
organic carbon (TOC) was measured using a TOC analyzer (TOC-V csn Shimadzu, Japan) according to SM 5310.
22 Fig. 3.3 Equipment used for water quality analysis
Based on the existing surface water quality standard MNS 4586:1998 (Table 3.1), the specified values of each variable, including DO, NH4+, NO2-, NO3-, Cl-, PO43- and SO42- were
used to calculate the water quality index (WQI) at each sampling site. This method is used to assess the ecological state of surface water in Mongolia, which classified into six classes, ranging from very clean (WQI < 0.3) to dirty (WQI > 6) [40]. WQI was estimated using Eq. 3.1, which was developed by the Mongolian National Center for Standardization and Meteorology (CSM) in 1998 [41]. The classification of WQI is shown in Table 3.2.
𝑊𝑄𝐼 =∑ 𝐶𝑖 𝑃𝑙𝑖 𝑛 𝑖=1 𝑛 3.1 where,
WQI: Water Quality Index
𝑃𝑙𝑖: The specified value of the ith variable of the MNS 4586:1998 𝐶𝑖: Concentration of ith variable
23 Table 3.1 Permissible level of surface water variables in Mongolian National Standard
Variables name Chemical
formula
MNS 4586:1998 standard
Biochemical Oxygen Demand – 5 day BOD 3 mg/L
Chemical Oxygen Demand – Manganese COD 10 mg/L
Dissolved oxygen DO 6~4 mg-O/L
Hydrogen ion activity pH 6.5-8.5
Total organic carbon TOC -
Chloride Cl 300 mg/L
Nitrate NO3 9.0 mg-N/L
Sulphate SO4 100 mg/L
Phosphorus PO4 0.1 mg-O/L
Fluoride F 1.5mg/L Nitrite NO2 0.02 mg-N/L Ammonium NH4 0.5 mg-N/L Aluminum Al 200 mg/L Calcium Ca 100 mg/L Chromium Cr 0.05 mg/L Manganese Mn 0.1 mg/L Copper Cu 0.01mg/L Arsenic As 0.01 mg/L Cadmium Cd 0.005 mg/L Lead Pb 0.01 mg/L Magnesium Mg 30 mg/L
Table 3.2 Classification of water quality index Quality index Water quality Classes
<0.30 1 Very clean 0.31-0.89 2 Clean 0.90-2.49 3 Slightly polluted 2.50-3.99 4 Moderately polluted 4.00-5.99 5 Heavily polluted 6.00-10.0 6 Dirty >10.0 7 Very dirty
Water hardness is the amount of dissolved calcium and magnesium in the water. It is usually expressed as the equivalent quantity of calcium carbonate. Total water hardness was estimated using Eq. 3.2
𝐶𝑎𝐶𝑂3 = 2.5 ∙ [𝐶𝑎2+] + 4.1 ∙ [𝑀𝑔2+] 3.2
Where:
𝐶𝑎𝐶𝑂3: Water hardness mg of CaCO3 equivalent hardness in 1 liter of water (mg/L)
𝐶𝑎2+: Concentration of calcium (mg/L) 𝑀𝑔2+: Concentration of magnesium (mg/L)