A generalized model for visualizing library popularity, adoption, and diffusion within a software ecosystem
13
0
0
全文
(2) A Generalized Model for Visualizing Library Popularity, Adoption, and Diffusion within a Software Ecosystem Raula Gaikovina Kula∗ , Coen De Roover† , Daniel M. German‡ , Takashi Ishio∗ , and Katsuro Inoue§ ∗ Nara. Institute of Science and Technology, Japan Universiteit Brussel, Belgium ‡ University of Victoria, Canada § Osaka University, Japan {raula-k,ishio}@is.naist.jp, [email protected], [email protected], [email protected] † Vrije. Abstract—The popularity of super repositories such as Maven Central and the CRAN is a testament to software reuse activities in both open-source and commercial projects alike. However, several studies have highlighted the risks and dangers brought about by application developers keeping dependencies on outdated library versions. Intelligent mining of super repositories could reveal hidden trends within the corresponding software ecosystem and thereby provide valuable insights for such dependencyrelated decisions. In this paper, we propose the Software Universe Graph (SUG) Model as a structured abstraction of the evolution of software systems and their library dependencies over time. To demonstrate the SUG’s usefulness, we conduct an empirical study using 6,374 Maven artifacts and over 6,509 CRAN packages mined from their real-world ecosystems. Visualizations of the SUG model such as ‘library coexistence pairings’ and ‘dependents diffusion’ uncover popularity, adoption and diffusion patterns within each software ecosystem. Results show the Maven ecosystem as having a more conservative approach to dependency updating than the CRAN ecosystem.. I. I NTRODUCTION Reusing software by depending on libraries is now commonplace in both open source and commercial settings alike [1], [2]. Software libraries come with the promise of being able to reuse quality implementations, thus preventing ‘reinventions of the wheel’ and speeding up development. Examples of popular reuse libraries are the S PRING [3] web framework and the A PACHE COMMONS [4] collection of utility functions. Contributing to the popularity of these and other libraries has certainly been the ease through which they can be accessed nowadays from ecosystems formed by a collection of super repositories such as Maven Central [5], R’s CRAN [6], Sourceforge [7] and GitHub [8]. With new libraries and newer versions of existing libraries continuously being released, managing a system’s library dependencies is a concern on its own. Improper dependency management can be fatal to any software project [9]. As outlined in related studies [10], [11], [12], dependency management includes making cost-benefit decisions related to keeping or updating dependencies on outdated libraries. Additionally, a recent study [13] reported that 87.5% of developers do not update their dependencies, a result that. complements other studies that show updating library APIs is slow and lagging [14], [15], [16], [17]. This study found that such update decisions are not only influenced by whether or not security vulnerabilities have been patched and important features have been improved, but also by the amount of work required to accommodate changes in the API of a newer library version. Recently, there also has been other work that studies dependency issues at the ecosystem level [18], [19], [20]. Meta-data recorded within these ecosystems can provide system maintainers valuable “wisdom-of-the-crowd” insights into these dependency-related questions. We introduce the Software Universe Graph (SUG) as a means to model the realities of popularity, adoption and diffusion within a software ecosystem. Popularity refers to the usage of a library over time. Adoption refers to systems introducing a new library dependency. Diffusion, inspired by use-diffusion [21], is a measure of the spread of library versions over dependent systems. The abstract nature of our SUG enables generalizing and hence comparing these aspects across different types of super repositories. To evaluate the SUG model, we report on a large-scale empirical study in which we construct SUGs for a large collection of Maven and CRAN super repositories. Our goal is to: (1) construct real-world SUG models to show its practical application and (2) demonstrate its usefulness in library dependency management through several case studies. Our key contributions are: • We introduce the fully formalized SUG model for representing super repositories in a generic manner, which lends itself to being mined for insights about popularity, adoption and diffusion. • We define several metrics related to popularity, adoption and diffusion —all in terms of formal operations on a SUG model. We also introduce several SUG-based visualizations. • In a large-scale study, we build SUG models for the very different realities of the Maven and of the CRAN super repositories. We demonstrate that our visualizations intuitively provide valuable insights for dependency.
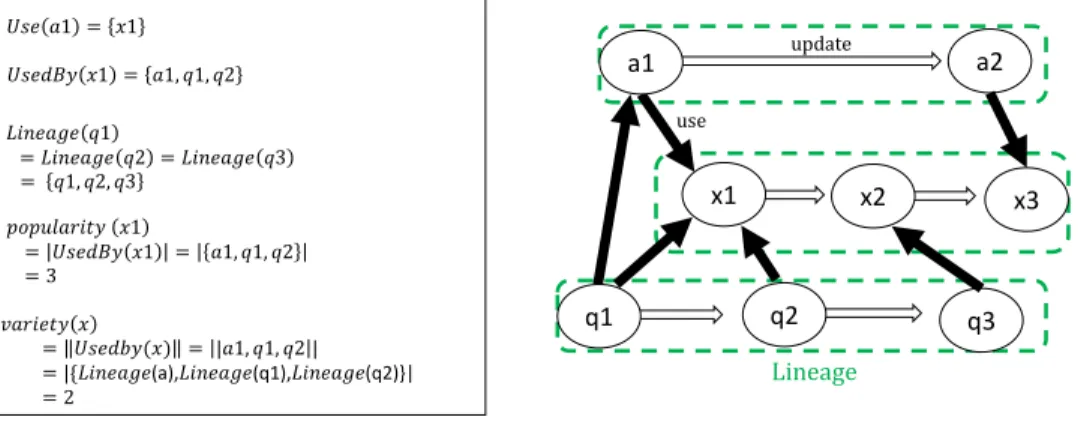
(3) management. The study results empirically depict Maven users as reluctant to update to newer library releases, with older library releases deemed ‘usable’ by the crowd. CRAN users are more disciplined in this regard. II. BACKGROUND Studying library usage in terms of absolute popularity is not a new concept. Holmes et al. appeal to popularity as the main indicator to identify libraries of interest [22]. Eisenberg et al. improve navigation through a library’s structure using the popularity of its elements to scale their depiction [23]. De Roover et al. explored library popularity in terms of source-level usage patterns [24]. Popularity over time has received less attention. Mileva et al. study popularity over time to identify the most commonly used library versions [25]. Follow-up work applies the theory of diffusion to identify and predict version usage trends [26]. Similar to our diffusion work, Bloemen et al. [27] explored the diffusion of Gentoo packages. Using the economic bass model, they modeled the diffusion of gentoo packages over time. Teyton et al. use ‘library migration graphs’ to identify candidate library migrations [11]. Instead of a single-dimensional analysis of popular library usage, we present an extensively formalized SUG model with popularity and variety metrics and additional complementary diffusion and coexistence plot visualizations. This provides for a much richer understanding of significant phenomena in the evolution of library dependencies.. (2). Use-relations can be extracted from either the source code or configuration files. As depicted in Figure 1, node a1 uses node x1. Also node x1 is used by nodes a1, q1 and q2. Parallel edges for node pairs are not allowed. In this paper, we focus on popular software units that are connected by many use-relation edges. Definition 2: For a given node u, popularity is the number of incoming use-relation edges and is defined as: popularity(u) ≡ |U sedBy(u)|. This paper is concerned with intelligent mining of a large collection of software repositories within an ecosystem, defined as super repositories. More specifically, we present an abstract model to understand and compare adoption, diffusion and popularity within its particular universe. We conjecture that useful information such as popularity is indicative of a library reliability, which is measured by significant usage within the ecosystem. A. Software Universe Graph We present the Software Universe Graph (SUG) as a structural abstraction of a super repository. Figure 1 will serve as an illustration of the different relationships within the graph. Let G = (N, E) for a graph G. N is a set of nodes, with each node representing a software unit. We consider both any system version, such as SymmetricDs version 3.6.3 (SymmetricDs3.6.3 ) or a library version Junit version 4.11 (Junit4.11 ) as software unit nodes. For any SUG, the edges E are composed of Euse and Eupdate . Euse is a set of use-relations and Eupdate is a set of update-relations. We first present Euse in Definition 1 and 2. Eupdate is then introduced in Definition 3. Definition 1: An edge u → v ∈ Euse means that u uses v. The defined functions of Euse are: (1). (3). For instance in Figure 1, for node x1, popularity(x1) = |U sedBy(x1)| = |{a1, q1, q2}| = 3. As an extension, the popularity of any pair of nodes (u and v) is defined by the number of common nodes connected by an incoming edge. Formally, popularity(u, v) ≡ |U sedBy(u) ∩ U sedBy(v)|. (4). We define u and v as being coexistence pairs if popularity(u, v) ≥ 1. Take from Figure 1, popularity(x1, a1) = |{U sedBy(x1) ∩ U sedBy(a1)}| = |{a1, q1, q2} ∩ {q1}| = |{q1}| = 1. Therefore in the Figure, x1 and q1 are coexistence pairs. Definition 3: We represent an update-relation from node a to b using a ⇒ b, meaning that newer update b had been released from node a and is defined as: a ⇒ b ∈ Eupdate. III. S OFTWARE U NIVERSE M ODELING. U se(u) ≡ {v|u → v}. U sedBy(u) ≡ {v|v → u}. (5). Update-relations refers to when a succeeding release of a software unit is made available. Figure 1 shows that node q1 is first updated to node q2. Later on, node q2 is updated to the latest node q3. Hence, q1 ⇒ q2 ⇒ q3. We find that every node in the SUG should be denoted by three attributes: <name,release,time>. For a node u, we then define: • u.name Name is the string representation identifier of a software unit. We introduce the name axiom: For nodes u and v, if u ⇒ v, then u.name = v.name holds. • u.release. Release refers the specific assigned change reference for a software unit. For nodes u and v, if u ⇒ v then v is the immediate successor of u. Note that the versioning pattern may vary from project to project. • u.time. Time refers to the time-stamp at which node u was released. For nodes u and v of u ⇒ v, u.time < v.time. An example of the attributes can be shown with the JU NIT library. These attributes belong to the most recent release1 (i.e., <name = "junit", version= "4.11", time="2012-11-14">). We define a set of nodes weakly connected by update-relations as a lineage. We are interested in all releases within a lineage. Definition 4: Lineage of a related set of nodes is determined through transitive update-relations. This is defined as: 1 http://mvnrepository.com/artifact/junit/junit/4.11:. accessed 2017-04-01.
(4) 𝑈𝑠𝑒 𝑎1 = 𝑥1. a2. use. 𝐿𝑖𝑛𝑒𝑎𝑔𝑒 𝑞1 = 𝐿𝑖𝑛𝑒𝑎𝑔𝑒 𝑞2 = 𝐿𝑖𝑛𝑒𝑎𝑔𝑒 𝑞3 = 𝑞1, 𝑞2, 𝑞3. 𝑝𝑜𝑝𝑢𝑙𝑎𝑟𝑖𝑡𝑦 𝑥1 = 𝑈𝑠𝑒𝑑𝐵𝑦 𝑥1 =3. update. a1. 𝑈𝑠𝑒𝑑𝐵𝑦 𝑥1 = 𝑎1, 𝑞1, 𝑞2. x1. x2. x3. = 𝑎1, 𝑞1, 𝑞2. q2. q1. 𝑣𝑎𝑟𝑖𝑒𝑡𝑦 𝑥 = 𝑈𝑠𝑒𝑑𝑏𝑦(𝑥) = |𝑎1, 𝑞1, 𝑞2 | = |{𝐿𝑖𝑛𝑒𝑎𝑔𝑒(a),𝐿𝑖𝑛𝑒𝑎𝑔𝑒(q1),𝐿𝑖𝑛𝑒𝑎𝑔𝑒(q2)}| =2. q3. Lineage. Fig. 1. A Conceptual Example of the Software Universe Graph with formalized definitions and notations.. +. +. Lineage(u) ≡ {v|v ⇒ u ∨ u ⇒ v ∨ u = v}. a1. (6). a2. a3 (∆𝐸) (∆𝑁). +. where a ⇒ b is the transitive closure on any update-relation a ⇒ b. The name axiom proves that all names in a lineage are the same. A lineage of nodes is depicted in Figure 1, where Lineage(q1) = Lineage(q2) = Lineage(q3) = {q1, q2, q3}. The lineage function enables more dynamic operations. To differentiate between lineages, we now introduce an additional operator. Definition 5: We use the k S k operator to represent the number of different lineage in a set of nodes in S. k S k≡ |{Lineage(u)|u ∈ S}|. (7). Looking back at the example in Figure 1, suppose S = {a1, a2, x1}. Hence, k S k= |{Lineage(a1), Lineage(a2), Lineage(x1)}| = |{{a1, a2}, {x1}}| = 2. Complex queries on our SUG model based on lineages are now possible. The previously defined popularity function alone is insufficient in reflecting the spread or diffusion of a software unit across the software universe. We introduce a variety function that allows us to measure diffusion. Definition 6: Variety represents the number of different lineages that use a software unit. variety(u) ≡k U sedBy(u) k. (8). In Figure 1 we observe that node x1 is used by node related to Lineage(a1) and Lineage(q1). Hence, variety is 2. Formally, variety(x1) =k {a1, q1, q2} k = |{Lineage(a1), Lineage(q1), Lineage(q2)}| = 2. Definition 7: The SUG has temporal properties. This describes the simultaneity or ordering in reference to time. Let SUG G = (N, E) be at time t. At time t0 > t, we observe an extension of G, such that: G0 = (N ∪ ∆N, E ∪ ∆E). where ∆E ∩ (N × N ) = ∅.. (9). (∆𝐸). x2. x1. 𝐺 = (𝑁 , 𝐸 ) 𝐺′ = (𝑁 ∪ ∆𝑁, 𝐸 ∪ ∆𝐸). Fig. 2. Temporal property of the SUG. Figure 2 illustrates the temporal properties of the SUG. Here, it is observed that G0 is composed of G augmented with newly added node a3 and its corresponding a3 → x2 and a2 ⇒ a3 relations. A SUG grows monotonically over time with only additions. Here we consider that modification or deletion changes on the SUG do not occur. Definition 8: A timed SUG specifies the state of the SUG at any point in time. So for a SUG G = (N, E), we represent a timed SUG Gt at time t as a sub-graph of G. Formally, Gt ≡ (Nt , Et ). (10). where Nt = {u|u ∈ N, u.time ≤ t} and Et = {e|e ∈ E ∧ e ∈ Nt }. We are now able to describe the temporal properties of popularity. We introduce P opularityt (u) for a node u at time t. This provides the popularity of u for Gt 2 . B. Query Operations on the SUG Model We utilize the SUG model to query and retrieve useful information from the software ecosystem. We now introduce Coexistence Pairing and Diffusion Plots as examples of the visualization of popularity. Our rational is that popular usage of a software unit is evident by successful adoption and diffusion over its predecessors. It is important to note that results do not indicate concrete evidence of library compatibility, instead 2 We. define that P opularityt (u) = 0 if t < u.time.
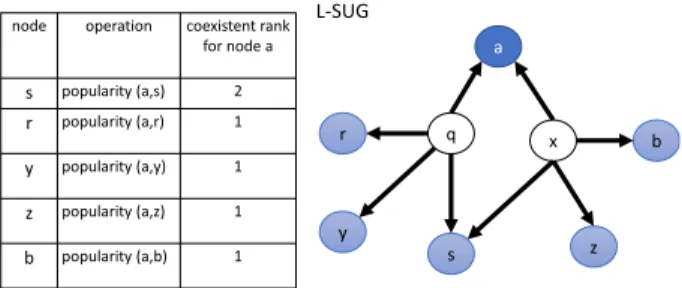
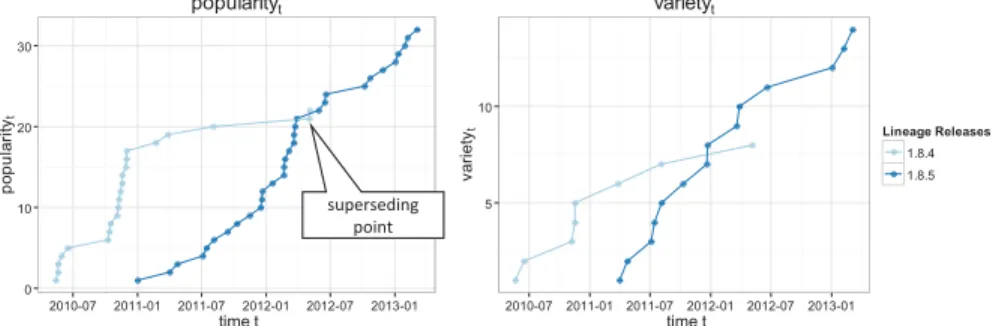
(5) b). L-SUG G`. a). SUG G a1. a2 c1. d1. d2. a. a c. c2. e1 b1. a3. c). Popularity(a,b) of G`. d. d3. e2. e. b. d e b. operation. coexistent rank for node a. s. popularity (a,s). 2. r. popularity (a,r). 1. y. popularity (a,y). 1. z. popularity (a,z). 1. b. popularity (a,b). 1. L-SUG a. r. q. x. y. b2. Fig. 3. Illustrative example of the coexistence pairing. Let Figure 3(a). shows a typical SUG G with respective lineages annotated. Figure 3(b) is the LSUG G0. Finally in Figure 3(c), the popularity is determined. In this case the coexistence popularity(a,b) is 2.. popularity suggests some recommended usages based on the ‘wisdom of the crowd’. Coexistence pairing examine and explores occurrences of specific combinations between software components. We empirically visualize these coexistence pairs, deemed to be compatible by the ‘crowd’. The coexistence popularity of two nodes (i.e., popularity(u, v)) is used to establish a pairing between the nodes. Alternatively, non coexistence pairs (i.e., popularity(u, v) = 0) suggest combinations that are possible but not seen yet. To aggregate nodes by lineage, we introduce a reduced SUG called Lineage SUG (L-SUG). Definition 9: A Lineage SUG is used to merge all related nodes into a single node. We define a Lineage SUG (L-SUG) G0 = (N 0, E0) of an SUG G = (N, E = Euse ∪ Eupdate ) where: N 0 = {Lineage(u)|u ∈ N }. node. (11). and E0 = {Lineage(u) → Lineage(v)|u, v ∈ N ∧ u → v ∈ Euse } (12). In the L-SUG, all nodes belonging to the same lineage are merged with all use-relations mapped onto the merged node. All update-relations are discarded. Almost all defined functions for the SUG like popularity, should theoretically apply on the L-SUG3 . An example of the L-SUG is explained in Figure 3. Figure 3(a) shows a typical SUG G with respective lineages annotated. Figure 3(b) depicts the lineage SUG G0. In Figure 3(c), the L-SUG popularity of L-SUG nodes a and b is calculated. We now introduce the three different types of coexistence pairing operations as follows: 1) L-SUG Lineage Pairs. We use the popularity of two L-SUG nodes. Further exploration of the lineage pairs would lead to release pairs of these lineages. 2) SUG Release Pairs. Once interested lineage pairs are identified, maintainers next decide on popular release combinations. To this end, we use popularity of two nodes on the SUG to establish coexistence release pairs. 3) L-SUG Lineage Coexistence Rank. The coexistence rank returns popularity pairs relative to a specific L-SUG 3 An exception would be L-SUG variety, which is a lineage within an lineage. We consider this to be out of scope for this study.. s. b. z. Fig. 4. Example of the coexistence operation. For the L-SUG P 0, for a node a, the coexistence rank allows to determine popularity in relation to node a. In this example node s has the highest coexistence rank.. node. Formally, for a node u on a set of L-SUG U 0, we compute all values of popularity(u, v) for v ∈ U 0 where popularity(u, v) ≥ 1. We refer to them as the coexistence rank. For example in Figure 4, consider LSUG node a. The coexistence rank returns 5 results, with node s having the highest coexistence rank of 2. Later in Section IV-C, we demonstrate how the coexistence rank may uncover intuitive insights. As an extension on our work of Library Dependency Plots (LDP) [28], we introduce Diffusion Plots. For any software unit, DPs enable plotting and tracking both popularity and variety at any given point in time t such that popularityt (u) and varietyt (u) for a node u. The DPs provide a temporal means to evaluate popularity and the adoptive behavior of a software unit within its universe. We introduce the two main attributes of the DP: • Popularity and Variety Plots. DPs plot both the popularityt and corresponding varietyt on a SUG. We use the plots to understand the adoption and diffusion at both the lineage and release level. • Diffusion Curve Types. The DPs allow us to perceive patterns of popularity for a specific release belonging to a lineage. Additionally, the DPs provide insights on the adoption and diffusion within that universe. In Figure 5, we show an example DP of the MOCKITO CORE lineage from the Maven super repository. For illustration purposes –and to simplify the curve– this DP only shows two releases. Note the crossing of lines, which is described as the superseding point where MOCKITO - CORE1.8.5 succeeds MOCKITO - CORE 1.8.4 in both popularityt and varietyt . Section IV-D details the DP visualizations. IV. E MPIRICAL S TUDY A. Case Study of Maven and CRAN Ecosystems Our aim of the empirical study is to demonstrate: (1) practical application of our formalized SUG model when applied to real-world data and (2) usefulness by providing insights and comparisons between two different ecosystems. In detail, we demonstrate how our model operations and visualizations support describing real-world data. All tools, scripts, data and results are freely available on request..
(6) popularityt. varietyt. 30. Lineage Releases. varietyt. popularityt. 10 20. superseding point. 10. 1.8.4 1.8.5 5. 0 2010-07. 2011-01. 2011-07. 2012-01. time t. 2012-07. 2013-01. 2010-07. 2011-01. 2011-07. 2012-01. time t. 2012-07. 2013-01. Fig. 5. A simple example of the diffusion plot for the Maven MOCKITO - CORE lineage release 1.8.4 and 1.8.5. TABLE I C ONSTRUCTION OF THE SUG USING ATTRIBUTES STORED FOR M AVEN JAR BINARIES AND CRAN ZIP W INDOWS PACKAGES . File type Euse Eupdate x.name x.release x.time. Maven POM.xml <dependency> <version> <groupId>.<artifactId> <version> time-stamp of jar binary. CRAN DESCRIPTION Depends: Version: Package: Version: indicated build time. To demonstrate the practicality of the SUG, we construct and apply the SUG model and its operations to a large collection of Maven Central [5] and CRAN [6] super repositories. We then perform model operations on both the Maven and CRAN SUGs to demonstrate the usefulness of our models. By selecting different examples, we show different insights on adoption, diffusion and popularity within each universe. The Maven Central super repository is a major super repository that hosts many JVM project artefacts from the Java programming language ecosystem. Note that most projects in this repository are open-source Java, Scala or Clojure libraries (referred to as artefacts). R [29] is a free software environment for statistical computing and graphics. The Comprehensive R Archive Network (CRAN) belongs to an R ecosystem that hosts sources, binaries and packages related to the R environment. For the experiment, we only targeted contributed packages under windows4 (from R version 1.7 to 3.1). B. SUG Construction and Analysis Table I shows the different attributes collected from metafiles, that we used to construct the SUGs. We constructed each SUG by extracting (i) use-relations, (ii) update-relations and (iii) software attributes such as the name, release and time properties of each software in the ecosystem. Specifically, we employed a typical extraction method of dependency information using meta-files [11], [30], [31], [32]. For the Maven libraries, we use the Project Object Model file (i.e., POM.xml) that describes the project’s configuration metadata —including its compile-time dependencies5 , while each. TABLE II SUG S TATISTICS FOR M AVEN L IBRARIES AND CRAN PACKAGES Time Period # of nodes # of lineages Reuse. Maven 2005-11-03 to 2013-11-24 188,951 6,374 5,146. TABLE III S UMMARY S TATISTICS FOR L-SUG POPULARITY Min 1st Quartile Median Mean 3rd Quartile Max. Maven 1 2 6 38.8 20 10160. CRAN 1 4 8 64.62 22 26460. CRAN package stores its dependency information in a file called ‘DESCRIPTION’6 . Table II presents a summary of data mined for the experiment. For our SUGs, our tools were able to mine and generate 188,951 Maven and 93,184 CRAN nodes from each super repository, spanning across 9-11 years. Note that independent software units (i.e.,without use-relation edges) were not included in SUGs. For the CRAN universe, we also include both available and archived packages.7 . The SUGs were built from the dates shown in Table II. To understand the reuse within each universe, we measure how many lineages are being used internally. For every node u in SUG U : reuse =k. [. U sedBy(u) k. (13). u∈U. Table II details each SUG. The results suggest that the CRAN universe reuse is comprised of a much smaller subset of reuse libraries (i.e., 1,518 lineages). In contrast, for Maven there is an indication of more reuse within the universe (i.e., 5,146 lineages are used by 6,374 other lineages). We find this result not so surprising as most Maven artifacts comprise of either libraries or frameworks that may depend on multiple libraries.. 4 http://cran.r-project.org/bin/windows/contrib/. 6 https://goo.gl/H1S1vJ. 5 Refer. 7 http://cran.r-project.org/web/packages/. to http://maven.apache.org/pom.html for the data structure. CRAN 2003-08-29 to 2014-08-22 93,184 6,506 1,517. reports 5,833 at time of experiment.
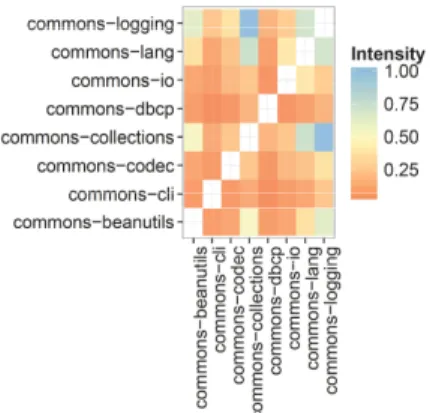
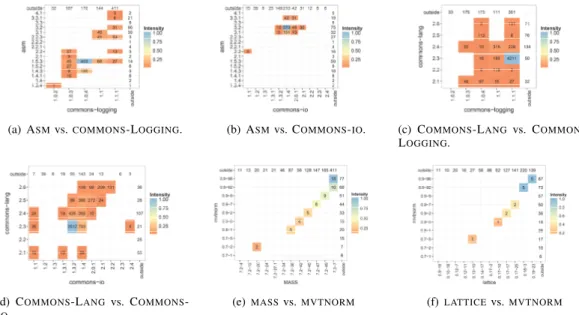
(7) To determine popularity of a lineage, we apply the popularity function on a L-SUG. Hence, from the Maven and CRAN SUGs, we derive their respective L-SUGs with a lineage by lineage use relation. The statistical summary of this L-SUG popularity distribution for both Maven and CRAN is presented in Table III. Surprisingly, we observe that except for the median and the 3rd quartile, both distributions of the Maven and CRAN universes seem similar. We had expected that since CRAN exhibited lower reuse (shown in Table II), it would be more likely to generate higher popularity counts. For Maven, the testing library J UNIT was the most popular, while dependency on the R package release was found to be the most popular in CRAN packages. C. Coexistence Pairs using Heat Maps We utilize a heat map matrix to visualize coexistence pairs. We define the intensity as a normalized frequency count of popular pairs. For a given set of nodes I, for pairs x, y ∈ I intensity is: intensity(x, y, I) =. popularity(x, y) max (popularity(i, j)). (14). i,j∈I i6=j. where x, y ∈ I and max returns the most frequent counts of pairing. The Intensity function allows for normalized intensity shading of tiles from a scale of 0 to 1 (darker indicates higher popularity) by returning the most frequent pair count. Using the L-SUG popularity, we utilize the heat map and the intensity function to plot popular pair frequency counts. Figure 6 illustrates examples of these lineage pairings. Figure 6(a) depicts the pairing of eight selected Maven Apache Commons [4] artifacts built for Java. From the matrix, it is observed that the most popular pairing is between COMMONS - LOGGING, a log helper and COMMONS - COLLECTIONS, a library used for handling data structures. In Figure 6(b), we observe two cases of non-coexistence. Figure 6(b) shows the top 10 most popular dependent packages8 in CRAN. Notice that pairs (TCLTK, M ATRIX) and (TCLTK, MVTNORM) lack coexistence. We speculate but cannot confirm that common functionality of handling complex matrices manipulation and GUI could be a reason. The pairing of (GRAPHICS,STATS) as the most frequent package combination is typical. This is because it is known as the ‘free software environment for statistical computing and graphics’ [29]. In summary, the results provide at a glance hints of popular pairings at the lineage level. From the lineage pairing (L-SUG), popularity on the SUG is used to determine release pairs between two lineages. A heat map matrix with the intensity is used for this visualization. Figures 7(a), 7(b), 7(c) and 7(d) depict the release pair plots between Maven’s ASM [33], COMMONS - IO [34], COMMONS LOGGING [35] and COMMONS - LANG [36]. Figures 7(e) and 7(f) show release pair plots between CRAN’s MASS [37], MVTNORM [38] and LATTICE . Different to the L-SUG lineage pairs, the popularity is annotated at each pairing point. 8 excluding. the R dependency. (a) Lineage pairings of eight Apache commons artifacts. (b) Top 10 popular CRAN package dependents (excluding R). Notice that pairs TCLTK, M ATRIX and TCLTK, MVTNORM lack coexistence. Fig. 6. Example of Coexistence Lineage Pairing. Additionally, the release pair plots include the popularity of a specific version x and any other software unit ‘outside’ Lineage(y). It is plotted at the end of the x and y axis of the release pair plot. Formally, for each node n in U : X outside(x, y) = popularity(x, n) (15) n∈U Lineage(n)6=Lineage(x) Lineage(n)6=Lineage(y). The outside pairs gauge relative popularity of alternative combinations. For instance, in Figure 7(b), the popularity of pairing Maven COMMONS - IO1.4 and ASM3.2 (popularity of 579) is greater than both ‘outside’ COMMONS - IO1.4 (popularity of 210) and ASM3.2 (popularity of 75). This classifies.
(8) (a) A SM vs. COMMONS -L OGGING.. (b) A SM vs. C OMMONS - IO.. (c) C OMMONS -L ANG vs. C OMMONS L OGGING.. (d) C OMMONS -L ANG vs. C OMMONS I O.. (e) MASS vs. MVTNORM. (f) LATTICE vs. MVTNORM. Fig. 7. Example of Coexistence Mapping for both Maven Artifacts (a,b,c,d) and CRAN Packages (e,f). Note the different co-evolving patterns.. Latest release of both lineages Older releases of Lineage B. Older releases of Lineage A. Lineage B. LATEST. OLDEST. Lineage A. LATEST. Fig. 8. Conceptual example of release pairs patterns, provide hints of popular pairings with older releases or if co-evolution (diagonal pattern) occurs.. this pairing as very popular. On the other hand in Figure 7(e), CRAN’s MASS7.3−7 and MVTNORM0.9.96 (popularity of 15) lower than the ‘outside’ MASS7.3−7 (popularity of 411) indicate that the (MASS, MVTNORM) pair combination is not the most popular possible pairing combination. Co-evolution patterns assist with interpretation of the evolution between the two lineages. As depicted in Figure 8, coevolving patterns such as the diagonal co-evolving pattern can be identified from the heat map matrix. As shown in Figure 8, pairings with older releases can be easily distinguished. Figure 7(a) highlights COMMONS - LOGGING1.0.3 and COMMONS LOGGING 1.1.1 as popular pairings for ASM releases, forming an almost vertical pattern. While in Figure 7(b), there seems to be no apparent co-evolving pattern, with the ‘crowd’ settling on the ASM3.2 and COMMONS - IO1.4 pairing. Patterns from Figure 7(c) indicate that older releases of COMMONS - LANG have popular pairings with even newer COMMONS - LOGGING releases. Figure 7(d) displays a more diagonal co-evolving pattern between COMMONS - LANG and COMMONS - IO.. Back to Figures 7(a), 7(b), 7(c) and 7(d) the intensity indicates that the most popular Maven ‘crowd choices’ are not necessarily the latest releases of their respective lineages. Maven maintainers seem conservative with older versions. Quite in contrast to the Maven pairings, CRAN packages depict a more distinguished diagonal pattern of co-evolution. This is illustrated in Figures 7(e) and 7(f). There are some inconsistencies such as non-coexistence and overlapping pairs. Take for instance, the (M ASS7.3−7 , MVTNORM0.9−92 ) and ( M ASS7.3−7 , MVTNORM0.9−96 ) pairings. This is due to the same version (M ASS7.3−7 ) being released over two consecutive R releases. Also different to Maven, the most popular ‘crowd choices’ are the latest releases of their respective lineage. We conjecture that regular updates by maintainers to comply with the latest R release build check 9 may contribute to why CRAN packages are so well maintained. Also as outlined by Mens [39], since only a single version is allowed per release of R, maintainers must update to the compatible version or risk their package being removed in the next release. Regular updates for R packages may account for why the most popular releases are the most frequent release pairs. Finally from the Maven super repository, we provide an example of an L-SUG coexistence rank. We perform the coexist function on an L-SUG of Maven, thus allowing a lineage as a node input. The operation returns lineages that at some point in time had a coexistence pairing. The Maven lineage artefact COMMONS - DBCP, a relational database connector [40] was used as an illustrative example. Using the Maven L-SUG, the coexistence rank returned 513 results. Table IV pertains to the top 10 results. Note that the list comprises of many non-database, general-purpose libraries such as J UNIT and LOG 4 J. For a more useful result, the use of 9 the. latest build is accessible at http://cran.rstudio.com/.
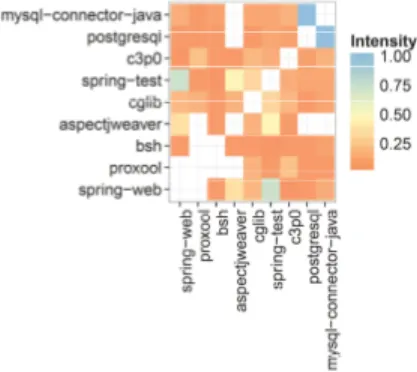
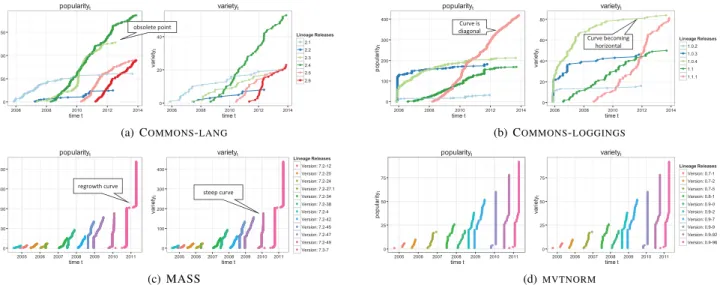
(9) TABLE IV T OP 10 FILTERED FREQUENT COUNTS OF coexistence rank FOR LINEAGE COMMONS - DBCP lineage junit commons-collections log4j commons-pool commons-logging hsqldb commons-lang derby servlet-api spring. coexistence rank 37 28 28 27 25 20 15 14 13 13. TABLE V T OP 10 FREQUENT COUNTS OF coexistence rank FOR LINEAGE COMMONS - DBCP EXCLUDING POPULAR LINEAGES . lineage mysql-connector-java postgresql c3p0 spring-test cglib aspectjweaver bsh geronimo-spec-jms proxool spring-web. coexistence rank 11 10 8 7 6 4 4 4 4 4. L-SUG popularity thresholds (shown in Table III) can be used to remove the more general purpose lineages, creating a more domain-specific result. We removed lineages that were above the 3rd quartile popularity threshold. The filtered results are provided in Table V. Compared to Table IV, the results in Table V provide more database-specific entries such as MYSQL - CONNECTOR JAVA 10 , POSTGRELSQL 11 , C 3 P 0 12 and PROXOOL 13 . The filtered results are not entirely database-specific such asSPRING WEB 14 . As an extension, we can further explore lineage pairing of the domain-specific results in Table V. Figure 9 depicts this result. Popular pairings of both POSTGRESL and MYSQL - CONNECTOR - JAVA suggest that in regards to COMMONS - DBCP , the postgresql and mysql databases are popular among the Maven ‘crowd’. The non-coexistence of MYSQL - CONNECTOR - JAVA and ASPECTJWEAVER 15 suggests that maintainers who depend on the ASPECTJWEAVER library should pay special attention to ‘the wisdom of the crowd’, as for one reason or another the crowd avoids its coexistence with the MYSQL - CONNECTOR - JAVA library. Additional operations of filtering and heat map lineage pairing are examples of how users can use any combination of SUG operations. 10 MYSQL - CONNECTOR - JAVA. is a MySQL database java connector is a PostgreSQL Driver JDBC4 12 C 3 P 0 is a JDBC Connection pooling / Statement caching library 13 PROXOOL is a Java connection pool. 14 SPRING - WEB is the web component of the spring framework 15 ASPECTJWEAVER AspectJ weaver introduces aspect-oriented advices 11 POSTGRELSQL. Fig. 9. Top C OMMONS - DBCP filtered coexistence ranked lineage pairs. D. Diffusion Plots A key element lacking in the coexistence pairing visualizations are the SUG temporal properties. Diffusion Plots (DPs) are used to this end, so that adoption and diffusion of a lineage is seen at any point in time. For any lineage, we describe both popularityt and varietyt . For popularity, we plot the number of software units using a particular release of the lineage. Conversely in the variety plot, we track the number of lineages that use a specific release. Popularity is characterized as a curve that depicts important visual features, such as the steepness, when the curve halts and when the curve is superseded by a successive release curve. Figure 10 provides examples of DPs for both Maven and CRAN. Figures 10(a) and 10(b) depict DPs for two lineages within the Maven Repository. C OMMONS - LANG is a helper utility library, notably assisting with Java string manipulation methods, basic numerical methods, object reflection, concurrency, creation and serialization. C OMMONS - LOGGING is a java logger helper library. As seen in Figure 10(a), C OMMONS LANG 2.4 (dark green) it is overall the most popular although older release. It is deemed as ‘stable’ by the ‘crowd’. The steepness of the curve can be interpreted as the adoption trend. For instance in the varietyt plot of Figure 10(b), we observe that C OMMONS - LOGGING1.0.4 has the most variety at any point in time. However, closely looking at its curve (light green), popularity has probably peaked with the curve being almost horizontal. C OMMONS - LOGGING1.1.1 (pink), however, adopts a more diagonal curve, hinting future adoptions could follow this trend. Note that the predecessor C OMMONS LANG 2.4 (dark green) in Figure 10(a) is still adopted beyond the C OMMONS - LANG2.3 obsolete point, making it more successful. Significant difference between popularityt and the corresponding varietyt reveals lineages with abnormally high releases depending on this specific lineage release. For instance, in Figure 10(a), on the y-axis depicts popularityt > 150 while varietyt > 40. Such variances could be misleading, so care should be taken in its interpretation. The DPs of the CRAN universe exhibit a very different adoption and diffusion behavior. Figures 10(c) and 10(d) show the DPs of both M ASS and MVTNORM lineages. The.
(10) popularityt. varietyt. 150. popularityt. varietyt. 400. 80. 300. 60. 200. 40. 100. 20. Lineage Releases. 40. 2.1. Lineage Releases 1.0.2. 2.2 100. 2.3 2.4 20. 2.6. 2008. 2010. 2012. time t. 1.1 1.1.1. 0. 0 2006. 2014. 2006. 2008. 2010. 2012. time t. 2014. 0 2006. 2008. 2010. 2012. time t. (a) C OMMONS - LANG popularityt. 2006. 2008. popularityt. Lineage Releases. 2010. 2012. time t. 2014. varietyt. Version: 7.2-12. 400. Version: 7.2-20 Version: 7.2-24. 300. 2014. (b) C OMMONS - LOGGINGS. varietyt. 400. 1.0.4. 2.5. 50. 0. 1.0.3. Lineage Releases 75. 75. 50. 50. 25. 25. Version: 0.7-1 Version: 0.7-2. Version: 7.2-27.1. 300. Version: 0.7-5. Version: 7.2-34 Version: 7.2-38 200. 200. Version: 0.8-1 Version: 0.9-0. Version: 7.2-4. Version: 0.9-2. Version: 7.2-42 100. Version: 7.2-45. 100. Version: 0.9-7 Version: 0.9-9. Version: 7.2-47. Version: 0.9-92. Version: 7.2-49 0. 0 2005. 2006. 2007. 2008. time t. 2009. 2010. 2011. Version: 7.3-7 2005. 2006. 2007. 2008. time t. 2009. 2010. 2011. (c) MASS. Version: 0.9-96 0. 0 2005. 2006. 2007. 2008. time t. 2009. 2010. 2011. 2005. 2006. 2007. 2008. time t. 2009. 2010. 2011. (d) MVTNORM. Fig. 10. Dependents Diffusion Plots for selected Maven and CRAN lineages. The left hand depicts the popularityt while the right shows the varietyt for their respective releases.. Mass package supports functions and datasets for Venables and Ripley’s MASS while the MVTNORM package computes multivariate normal and t probabilities, quantiles, random deviates and densities. These are depicted in Figure 10(c) and 10(d), with regular superseding of the previous release. Previous release curves never overlap but grow incrementally over time. Note that the most popular library versions are the latest releases. Differences in corresponding popularityt and varietyt values are minimal. This is consistent with the fact that only a single lineage release is permitted per R release. The steepness of the rate of adoption is almost vertical, meaning migration to newer releases is almost instantaneous, while making previous releases obsolete. In Figure 10(c), the M ass7.3−7 curve follows an abnormal regrowth type shape possibly caused by migration to a newer R release. In summary, DPs offer a visualization of adoption and diffusion patterns for a lineage. This has shown to be particularly useful in the case of the Maven universe, where adoption is slow and older releases are still popular. Particularly, results in Figure 10(a) coincide with Figure 7(c), where the older releases of C OMMONS -L ANG are still preferred over newer versions. Superseding points may provide hints on when it is safe to update. Additionally as shown, care must be taken when interpreting variance in popularityt and varietyt . V. D ISCUSSION SUG Model Considerations. The SUG model enables a standardized comparison of use-relations across diverse structured universes of software repositories within the ecosystem. The model allows for uncovering adoption, diffusion and popularity within a super repository universe, that is useful for assessing dependency management issues for developers. In this study, we only looked at two different ecosystems, however, we would like to investigate more ecosystems such as the ’C programming language’ libraries universe. As the rise of cross-language (or platform) systems emerge, potential future. research avenues could be the adaptation from a different universe and how system applications deal with cross-universe interaction. The use of an abstract model has its drawbacks, such as disregarding more complex concepts such as package ‘containment’ and ‘transitive’ relationships. At this stage we only consider the basic elements of software usage to measure popularity. As we study more systems, we will consider modeling additional concepts common to all universes as extensions to the model. A concern in the SUG construction was the assignment of the Ruse and Rup edges in relation to the name attribute of the node. Threats specific to the Maven and CRAN repositories, such as changed domains or lineage from more multiple nodes exist. Nevertheless, conceptually the SUG model was successfully applied to each universe. For future improvements of accuracy the model can expand beyond the name attribute for lineage classifications. We plan to incorporate more sophisticated techniques and tools used in ‘code clone’ such as code clone detection [41], [42] and ‘origin’ analysis [43], [44] to determine common lineage. Recently, Ishio et al. presented a promising technique to find software provenance using its Software Bertillonage [45]. There exist many definitions of software variability and dependency relationships. In Software Product Line Engineering (SPL), terms such as ‘product’ variability have been used extensively [46], [47], [48]. In the code clones field, Kim et al. [49] coined clone ‘genealogies’ to track variability between software of similar origins. To coincide with the abstract nature of the SUG and avoid preconceptions, we decided on the term ‘lineage’ to describe variability between software releases. In addition, systems and libraries are not explicitly distinguished. Graph cyclic based approaches such as page ranking, reference counting, and component ranking are common for measuring popularity on graph based models [11],[50]. Our SUG model does not employ any of these approaches as it is designed to rely on the dependency chains.
(11) to measure immediate dependency characteristics directly. Model Operations. As stated in our background, related studies have all reported maintainer’s concerns with API breakages and incompatibilities of existing dependencies over time. The results of this study revealed that the coexistence mapping provides interesting visual patterns. Assuming that usage implies stability, we can identify combinations of lineages deemed safe by the ‘crowd’. The coexistence operations on the SUG demonstrate more ‘intuitive’ aspects of the model, although domain-specific filtering may be required. Another complex but useful operation that was not presented in this paper is the tracing of systems that have abandoned a dependency. This could be future work. The Diffusion Plots (DPs) provide for a more temporal analysis of popularity and diffusion. Consistent with the SUG temporal properties, the restriction of adding nodes results in incremental adoption curves. The accumulating growth provides for a comparison of previous releases. Overall the DPs describe different adoption behaviors within the universe. Our qualitative visualizations indicate that maintainers of CRAN packages are more inclined to update to the latest version of their dependencies. The conservative nature of Maven artifact maintainers on the other hand, further justifies the potential usefulness of the SUG. Its model querying visualizations should assist maintainers to gain intuitive insights and understand the opportunities for updating components. We envision that an integration of both the coexistence and DP temporal properties into a single visualization would be beneficial. This is seen as future work. In practice, basing update decisions solely on popularity is not practical as there are often many other factors to consider. Therefore for a complete toolkit, popularity should be complementary to the many existing code and API compatibility checking tools. Ultimately, the maintainer’s personal preference may override all suggestions of the crowd. Our aim is to provide additional insights to maintainers who have to make a timely choice. Threats to Validity. The main internal threat to validity is the real-world assessment of the usefulness of our model. We believe that we are currently only at the conceptual stage of the research. We have been working closely with system integration industrial partners to develop and test our visualizations. We have received positive feedback regarding the modeling and particularly concerning coexistence. Another threat is that the results that we show may not generalize to all types of systems. We understand that in reality the repository data can be modified such as when changing domain locations, thus threatening the temporal property. Our investigations have proven, however, that most SUGs hold the temporal property. An external threat is that our datasets only include information about dependencies that are explicitly stated in project configuration files, such as the Maven POM and R Description files. It does not take into account reuse such as copy-and-paste and clone-and-own. Although gauging dependencies by the configuration file only provides for a sample of the actual reuse, we believe this is sufficient to give an impression of trends within each universe. We understand. that our data and analysis are dependent on the tools and analysis techniques. We are confident our samples are large enough to represent the real world. VI. R ELATED W ORK Next to work discussed in Section II and Section V, work from the following domains is complementary: Library Popularity Measures. Raemaekers et al. [10], [51], [30] performed several studies on the Maven repositories about the relation between usage popularity and system properties such as size, stability and encapsulation. Popularity has also been leveraged in IDEs [23]. Code Search and Recommendations. Code search is prominent among research on software reuse with many benefits for system maintainers [52]. Examples of available code search engines are google code [53]. Research tools such as Ichi-tracker [54], Spars [50], MUDAblue [55] and ParserWeb [56] are just a few of many available search tools that crawl software repositories mining different software attributes and patterns with different intentions. Software Systems as Components Within an Ecosystem. Recently, there has been an increase in research that perceives software systems as being components that interact and form dynamic relationships within an ecosystem. Work such as Bosch [46] have studied the transition from Product Lines to an Software Ecosystem level of abstraction. German et al. [31] studied the GNU R project as an ecosystem over time. Bogart et al. [12] studied how different ecosystems deal with API changes of their evolving libraries. The results show differences in each ecosystem policy and its supporting infrastructure; and there is value in making community values and accepted tradeoffs explicit and transparent in order to resolve conflicts and negotiate change-related costs. Furthermore, Mens et al. [57] performed ecological studies of open source software ecosystems with similar results. Other recent work has been related to dependency networks [18], [58]. VII. F UTURE W ORK AND C ONCLUSION In this paper, we present the SUG model as a means to represent, query and visualize different super repositories in a standardized and systematic manner. Immediate future work focuses on evaluating the insights of these queries and visualizations with actual system maintainers. Combining its “wisdom-of-the-crowd” insights with complementary work on compatibility checking of API changes, should give rise to a comprehensive recommendation system for effective dependency management. ACKNOWLEDGMENTS This work is supported by JSPS KANENHI (Grant Numbers JP25220003, JP15H02683 and JP26280021) and the “Osaka University Program for Promoting International Joint Research.”..
(12) R EFERENCES [1] C. Ebert, “Open source software in industry,” in IEEE Software, 2008, pp. 52–53. [2] L. Hainemann, F. Deissenboeck, M. Gleirscher, B. Hummel, and M. Irlbeck, “On the extent and nature of software reuse in open source java projects,” in Proceedings of the 12th International Conference on Top Productivity Through Software Reuse, 2011, pp. 207–222. [3] Spring framework homepage, accessed 2018-01-01. [Online]. Available: http://spring.io/ [4] Apache commons library homepage,accessed 2018-01-01. [Online]. Available: http://commons.apache.org/ [5] Maven central repository, accessed 2018-01-01. [Online]. Available: http://mvnrepository.com/ [6] Comprehensive r archive network(cran), accessed 2018-01-01. [Online]. Available: http://cran.rstudio.com/ [7] Sourceforge repository,accessed 2018-01-01. [Online]. Available: http: //sourceforge.net/ [8] Github repository, accessed 2018-01-01. [Online]. Available: https: //github.com/ [9] R. E. Grinter, “Understanding dependencies: A study of the coordination challenges in software development,” Ph.D. Thesis. University of California. Department of Information and Computer Science., 1996. [10] S. Raemaekers, A. van Deursen, and J. Visser, “Measuring software library stability through historical version analysis,” in Proc. of Intl. Comf. Soft. Main. (ICSM), Sept 2012, pp. 378–387. [11] C. Teyton, J.-R. Falleri, and X. Blanc, “Mining library migration graphs,” in Proc. of. Work. Conf. on Rev. Eng. WCRE2012, Oct 2012, pp. 289– 298. [12] C. Bogart, C. K¨astner, J. Herbsleb, and F. Thung, “How to break an api: Cost negotiation and community values in three software ecosystems,” in Proceedings of the 2016 24th ACM SIGSOFT International Symposium on Foundations of Software Engineering, ser. FSE 2016, 2016, pp. 109– 120. [13] R. G. Kula, D. M. German, A. Ouni, T. Ishio, and K. Inoue, “Do developers update their library dependencies?” Empirical Software Engineering, pp. 1–34, 2017. [14] R. Robbes, M. Lungu, and D. R¨othlisberger, “How do developers react to api deprecation?: The case of a smalltalk ecosystem,” in Proceedings of the ACM SIGSOFT 20th International Symposium on the Foundations of Software Engineering, ser. FSE ’12. New York, NY, USA: ACM, 2012, pp. 56:1–56:11. [15] A. Hora, R. Robbes, N. Anquetil, A. Etien, S. Ducasse, and M. T. Valente, “How do developers react to api evolution? the pharo ecosystem case,” in Proceedings of the 2015 IEEE International Conference on Software Maintenance and Evolution (ICSME), ser. ICSME ’15. Washington, DC, USA: IEEE Computer Society, 2015, pp. 251–260. [16] A. A. Sawant, R. Robbes, and A. Bacchelli, “On the reaction to deprecation of 25,357 clients of 4+1 popular java apis,” in Proceedings of the 32th IEEE International Conference on Software Maintenance and Evolution., 2016. [17] G. Bavota, G. Canfora, M. Di Penta, R. Oliveto, and S. Panichella, “How the apache community upgrades dependencies: An evolutionary study,” Empirical Softw. Eng., vol. 20, no. 5, pp. 1275–1317, Oct. 2015. [18] A. Decan, T. Mens, and M. Claes, “An empirical comparison of dependency issues in oss packaging ecosystems,” in 2017 IEEE 24th International Conference on Software Analysis, Evolution and Reengineering (SANER), Feb 2017, pp. 2–12. [19] R. Abdalkareem, O. Nourry, S. Wehaibi, S. Mujahid, and E. Shihab, “Why do developers use trivial packages? an empirical case study on npm,” in Proceedings of the 2017 11th Joint Meeting on Foundations of Software Engineering, ser. ESEC/FSE 2017. New York, NY, USA: ACM, 2017, pp. 385–395. [Online]. Available: http://doi.acm.org/10.1145/3106237.3106267 [20] S. Mirhosseini and C. Parnin, “Can automated pull requests encourage software developers to upgrade out-of-date dependencies?” in Proceedings of the 32Nd IEEE/ACM International Conference on Automated Software Engineering, ser. ASE 2017. Piscataway, NJ, USA: IEEE Press, 2017, pp. 84–94. [Online]. Available: http://dl.acm.org/citation.cfm?id=3155562.3155577 [21] S. Chuan-Fong and V. Alladi, “Beyond adoption: Development and application of a use-diffusion model,” Journal of Marketing, 2004. [22] R. Holmes and R. J. Walker, “Informing Eclipse API production and consumption,” in OOPSLA2007, 2007, pp. 70–74.. [23] D. S. Eisenberg, J. Stylos, A. Faulring, and B. A. Myers, “Using association metrics to help users navigate API documentation,” in VL/HCC2010, 2010, pp. 23–30. [24] C. De Roover, R. L¨ammel, and E. Pek, “Multi-dimensional exploration of api usage,” in Proc. of IEEE Intl. Conf. on Prog. Comp.(ICPC13), 2013. [25] Y. M. Mileva, V. Dallmeier, M. Burger, and A. Zeller, “Mining trends of library usage,” in ERCIM Workshops, 2009, pp. 57–62. [26] Y. M. Mileva, V. Dallmeier, and A. Zeller, “Mining API popularity,” in TAIC PART, 2010, pp. 173–180. [27] R. Bloemen, C. Amrit, S. Kuhlmann, and G. Ord´on˜ ez Matamoros, “Innovation diffusion in open source software: Preliminary analysis of dependency changes in the gentoo portage package database,” in Proc. of Work. Conf. on Mining Soft. Repo. (MSR2014), 2014, pp. 316–319. [28] R. G. Kula, C. D. Roover, D. M. German, T. Ishio, and K. Inoue, “Visualizing the evolution of systems and their library dependencies,” Proc. of IEEE Work. Conf. on Soft. Viz. (VISSOFT), 2014. [29] R statistical computing and graphics project homepage,accessed 2018-01-01. [Online]. Available: http://www.r-project.org/ [30] S. Raemaekers, G. Nane, A. van Deursen, and J. Visser, “Testing principles, current practices, and effects of change localization,” in Mining Soft. Repo. (MSR), May 2013, pp. 257–266. [31] D. M. German, B. Adams, and A. E. Hassan, “The evolution of the r software ecosystem,” Proc. of European Conf. on Soft. Main. and Reeng. (CSMR2013), pp. 243–252, 2013. [32] Y. M. Mileva, V. Dallmeier, M. Burger, and A. Zeller, “Mining trends of library usage,” in Proc. Intl and ERCIM Principles of Soft. Evol. (IWPSE) and Soft. Evol. (Evol) Workshops, ser. IWPSE-Evol ’09. New York, NY, USA: ACM, 2009, pp. 57–62. [33] Apache commons asm homepage, accessed 2018-01-01. [Online]. Available: http://asm.ow2.org/ [34] Apache commons io homepage, accessed 2018-01-01. [Online]. Available: http://commons.apache.org/proper/commons-io/ [35] Apache commons logging homepage, accessed 2018-01-01. [Online]. Available: http://commons.apache.org/proper/commons-logging/ [36] Apache commons lang homepage, accessed 2018-01-01. [Online]. Available: http://commons.apache.org/proper/commons-lang/ [37] Cran mass package homepage, accessed 2018-01-01. [Online]. Available: http://cran.r-project.org/web/packages/MASS/index.html [38] Cran mvtnorm package homepage, accessed 2018-01-01. [Online]. Available: http://cran.r-project.org/web/packages/mvtnorm/index.html [39] M. Claes, T. Mens, and P. Grosjean, “On the maintainability of CRAN packages,” in Proc. of CSMR-WCRE 2014, 2014, pp. 308–312. [40] Apache commons dbcp homepage, accessed 2018-01-01. [Online]. Available: http://commons.apache.org/proper/commons-dbcp/ [41] C. K. Roy and J. R. Cordy, “A survey on software clone detection research,” in Technical Report No. 2007-541,Queens University, Canada, 2007. [42] T. Kamiya, S. Kusumoto, and K. Inoue, “CCFinder: a multilinguistic token-based code clone detection system for large scale source code,” IEEE Transactions on Software Engineering, vol. 28, no. 7, pp. 654–670, 2002. [43] M. Godfrey and L. Zou, “Using origin analysis to detect merging and splitting of source code entities,” IEEE Transactions on Software Engineering, vol. 31, no. 2, pp. 166–181, 2005. [44] J. Davies, D. M. German, M. W. Godfrey, and A. Hindle, “Software bertillonage: Finding the provenance of an entity,” in Proceedings of the 8th Working Conference on Mining Software Repositories, 2011, pp. 183–192. [45] T. Ishio, R. G. Kula, T. Kanda, D. M. German, and K. Inoue, “Software ingredients: Detection of third-party component reuse in java software release,” in Proceedings of the 13th International Conference on Mining Software Repositories, ser. MSR ’16, 2016, pp. 339–350. [46] J. Bosch, “From software product lines to software ecosystems,” in Proc.of the Int Soft. Prod. Line (SPLC ’09), 2009, pp. 111–119. [47] C. Seidl and U. Assmann, “Towards modeling and analyzing variability in evolving software ecosystems,” in Proc. of the Int. Workshop on Variability Modelling of Software-intensive Systems (VaMoS ’13), 2013. [48] M. Nonaka, K. Sakuraba, and K. Funakoshi, “A preliminary analysis on corrective maintenance for an embedded software product family,” IPSJ SIG Technical Report, vol. 2009-SE-166, no. 13, pp. 1–8, 2009. [49] M. Kim, V. Sazawal, D. Notkin, and G. Murphy, “An empirical study of code clone genealogies,” in Proceedings of the 10th European Software.
(13) [50] [51]. [52]. [53] [54]. Engineering Conference Held Jointly with 13th International Symposium on Foundations of Software Engineering, 2005, pp. 187–196. K. Inoue, R. Yokomori, T. Yamamoto, M. Matsushita, and S. Kusumoto, “Ranking significance of software components based on use relations,” Software Engineering, IEEE Trans., vol. 31, pp. 213–225, March 2005. S. Raemaekers, A. v. Deursen, and J. Visser, “The maven repository dataset of metrics, changes, and dependencies,” in Proc. Conf. on Mining Soft. Repo., ser. MSR ’13. Piscataway, NJ, USA: IEEE Press, 2013, pp. 221–224. S. Bajracharya, A. Kuhn, and Y. Ye, “Proc. of work. on search-driven dev.: Users, infrastructure, tools, and evaluation (suite 2011),” in Proceedings of the 33rd International Conference on Software Engineering, 2011. Google code, accessed 2014-09-01. [Online]. Available: https://code. google.com/ K. Inoue, Y. Sasaki, P. Xia, and Y. Manabe, “Where does this code come from and where does it go? - integrated code history tracker for open. source systems -,” in Proc. of Inl Conf. on Soft. Eng., ser. ICSE 2012. Piscataway, NJ, USA: IEEE Press, 2012, pp. 331–341. [55] S. Kawaguchi, P. K. Garg, M. Matsushita, and K. Inoue, “MUDABlue: an automatic categorization system for open source repositories,” Journal of Systems and Software, vol. 79, no. 7, pp. 939–953, 2006. [56] S. Thummalapenta and T. Xie, “Parseweb: A programmer assistant for reusing open source code on the web,” in Proceedings of the IEEE/ACM Intl. Conf on ASE, ser. ASE ’07. New York, NY, USA: ACM, 2007, pp. 204–213. [57] T. Mens, M. Claes, and P. Grosjean, “Ecos: Ecological studies of open source software ecosystems,” in Soft. Main. Reeng. and Rev. Eng. (CSMR-WCRE), Feb 2014, pp. 403–406. [58] R. Kikas, G. Gousios, M. Dumas, and D. Pfahl, “Structure and evolution of package dependency networks,” in 2017 IEEE/ACM 14th International Conference on Mining Software Repositories (MSR), May 2017, pp. 102–112..
(14)
図
+4
関連したドキュメント
In this work we apply the theory of disconjugate or non-oscillatory three- , four-, and n-term linear recurrence relations on the real line to equivalent problems in number
That is, sequential parts within a given cluster in the Gauss Map are mapped to sequential members of the corresponding branch in the left-half of the Stern-Brocot Tree.. Right
Since the same idea can be used to give immediate proofs of a large variety of Aczél type inequalities (including the classical Aczél Inequality — see Corollary 3, case p = q = 2),
Thus, in Section 5, we show in Theorem 5.1 that, in case of even dimension d > 2 of a quadric the bundle of endomorphisms of each indecomposable component of the Swan bundle
Eskandani, “Stability of a mixed additive and cubic functional equation in quasi- Banach spaces,” Journal of Mathematical Analysis and Applications, vol.. Eshaghi Gordji, “Stability
It is suggested by our method that most of the quadratic algebras for all St¨ ackel equivalence classes of 3D second order quantum superintegrable systems on conformally flat
Following Speyer, we give a non-recursive formula for the bounded octahedron recurrence using perfect matchings.. Namely, we prove that the solution of the recur- rence at some
Theorem 4.8 shows that the addition of the nonlocal term to local diffusion pro- duces similar early pattern results when compared to the pure local case considered in [33].. Lemma
