Hyogo Framework for Action
2005-2015:
Building the Resilience of Nations
and Communities to Disasters
International Research Institute of Disaster Science
Tohoku University
Japan
Focusing on
2011 Great East Japan Earthquake
May 2014
HFA IRIDeS Review
Report
International Research Institute of Disaster Science
Tohoku University
Japan
Focusing on
2011 Great East Japan Earthquake
May 2014
HFA IRIDeS Review
Hyogo Framework for Action
2005-2015:
Building the Resilience of Nations
and Communities to Disasters
Preface
Having experienced the catastrophic disaster in 2011, Tohoku University has founded the International Research Institute of Disaster Science (IRIDeS). Together with collaborating organizations from many countries and staff with a broad array of specializations, the IRIDeS conducts world-leading research on natural disaster science and disaster mitigation. Based on the lessons from the 2011 Great East Japan (Tohoku) Earthquake and Tsunami disaster, the IRIDeS aims to become a world center for the research/ study of disasters and disaster mitigation, learning from and building upon past lessons in disaster management from Japan and others around the world. Throughout, the IRIDeS should contribute to on-going recovery/reconstruction efforts in areas affected by the 2011 tsunami, conducting action-oriented research and pursuing effective disaster management to build a sustainable and resilient society.
The 3rd United Nations World Conference on Disaster Risk Reduction 2015 will be held on 14-18 March 2015 in Sendai City, one of the areas seriously damaged due to the 2011 Earthquake and Tsunami. The IRIDeS shall play an important role at the conference as an academic organization located in the hosting city. Drafting of this report, focusing on the 2011 Earthquake and Tsunami in terms of the core indicators of the Hyogo Framework for Action 2005-2015, is one of the contributory activities to the forthcoming event.
This publication is the final issue after the preliminary published in October 2013, for encouraging the discussion, making agreement, and achieving consensus. We hope that the Japanese experience of past disasters including the 2011 Earthquake and Tsunami will be shared among national/local governments, the private sector, NGO, NPO and citizens all over the world.
Fumihiko Imamura Director
International Research Institute of Disaster Science Tohoku University
1. Introduction
2. World's 21st Century Natural Disasters
3. History of Natural Disasters in Japan (1888 - 2010)
4. Damage due to 2011 Great East Japan Earthquake and Tsunami
5. Various Post-tsunami Recovery Plans for the Coastal Areas
affected by 2011 Great East Japan Earthquake and Tsunami
6. 2011 Great East Japan Earthquake Review
HFA Priority for Action 1
Ensure that disaster risk reduction is a national and a local priority with a strong institutional basis for implementation.
1 National Policy and Legal Frameworks for Disaster Risk Reduction 2 Evacuation System for “Persons with Special Needs” in Nuclear Disasters 3 Dedicated and Adequate Resources for Disaster Management in Japan
4 University Faculty as a Non-Governmental Resource to Support Disaster Risk Reduction in Recovery Planning with Local Government
5 Community Participation in Japan
6 Japan’s Multi-sectoral Platform for Disaster Risk Reduction
HFA Priority for Action 2
Identify, assess and monitor disaster risks and enhance early warning.
7 Improvement in Risk Assessment and Early Warning Systems with Real-time Monitoring: Lessons from the 2011 Tohoku Earthquake and Tsunami
8 Importance of Quantitative Assessment of Uncertainties and their Visualization in Tsunami Hazard Assessment 9 Tsunami Fragility Curves for Supporting Reconstruction and Future Risk Assessment
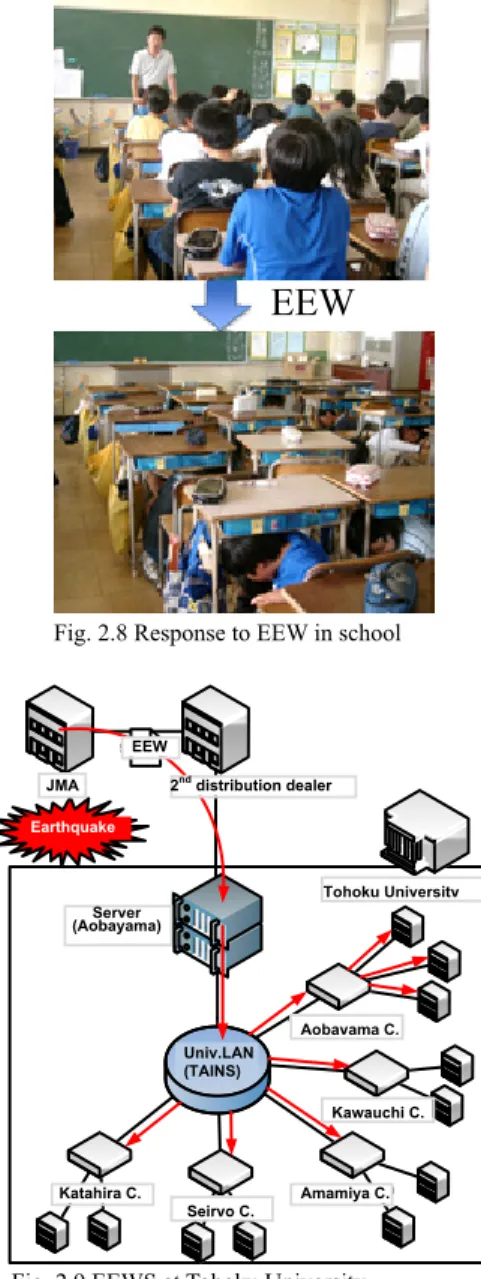
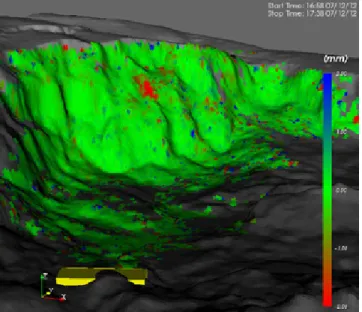
10 Small-area Population Estimates and Landscape Planning for Hazard Assessment and Reconstruction Planning 11 Earthquake Early Warning System in Schools and at a University during the 2011 Tohoku Earthquake 12 Monitoring of Land Slides and Status of Buildings and Construction Areas by Radar Technology
HFA Priority for Action 3
Use knowledge, innovation and education to build a culture of safety and resilience at all levels.
13 Information Sharing, Cooperation, and Expert Training Provided by Academic Research Institutes for Natural Disasters
14 Education to Build a Culture of Safety and Resilience at All Levels around Academic Research Institutes 15 Education Practice Program for Improving Response Capability to Survive from a Tsunami
16 Development of the Reconstruction Mapping Program at the Tsunami-affected Elementary School 17 International Post-graduate Education Program for Disaster Medicine;
Collaboration with Tohoku University Human Security Program
18 Recent Advances in Numerical Simulation for Disaster Prevention in the View of the 2011 Great East Japan Earthquake
1 2 4 6 16 23 31 8
HFA Priority for Action 4
Reduce the underlying risk factors.
19 Post-tsunami Recovery Strategies in Sanriku Coastal Areas after the 1933 Tsunami 20 Integrated Perspective of Civil Engineering, Architecture and Urban Planning 21 Measures for People Requiring Assistance during a Disaster
22 Enhancement of Business Continuity Plans and Business Continuity Management 23 Disruption of Supply and Supply Chain Management
24 Promotion of the Earthquake-proof Retrofit of Buildings after the 1995 Great Kobe Earthquake 25 Public Housing for the Mitigation on the Negative Impact of Environmental Transition on the Victims 26 Post-tsunami Recovery for Risk Reduction after the 2011 Great East Japan Earthquake and Tsunami 27 Destruction of Coastal Levees by the 2011 Tsunami and their Reconstruction
28 Comprehensive Post-tsunami Recovery after the 201 Great East Japan Earthquake and Tsunami
HFA Priority for Action 5
Strengthen disaster preparedness for effective response at all levels.
29 Measures and Agenda for Large-scale Disasters in Japan: from the Perspective of Personal Information and Disaster Prevention Education
30 National Preparedness of Disaster Medicine as Tertiary Risk Reduction 31 Enhancement of Plans for Operational Continuity of Government
32 Three Coastal Districts in Iwaki City, Fukushima Prefecture: Differences Resulting from the Local Residents Organization Disaster Response Activities
33 Pre-Disaster Activities to Preserve Historical Materials and the Great East Japan Earthquake 34 DMAT as the First and Long-lasting Responder
35 Legal and Financial Frameworks for Recovery and Reconstruction
36 Preparedness for Low-frequency and High-impact Disasters from a Medical Perspective
37 Prospect of Future Information Exchange Methods in the Event of a Disaster by Taking Advantage of SNS
Future Recommendations for Post Hyogo Framework for Action
39
50
1. Introduction
1
Japan has one of the highest levels of urban risk of natural disaster in the world because all the three values determining the risk—hazard, vulnerability, and exposed value—are very high. Thus, Japanese society has struggled against natural disasters throughout history.
In this context, the UN World Conference on Natural Disaster Reduction was held in Yokohama in May 1994 as a part of a mid-term review of the International Decade for Natural Disaster Reduction (IDNDR). However, the most tragically disastrous event in Japanese history since World War II, the 1995 Great Kobe Earthquake, occurred the next year.
The earthquake led the 2005 World Conference on Disaster Reduction (WCDR) to select Kobe City, Hyogo Prefecture, as its location for demonstrating the city’s remarkable recovery from the earthquake. The Hyogo Declaration was adopted at the conference, and the Hyogo Framework for Action 2005–2015 (HFA) was built as a 10-year plan to safeguard the world from natural hazards. The HFA consists of the following five priorities for action, which would serve as guidelines to reduce future disaster damage for every country or region.
Priorities for action 2005–2015:
1. Ensure that disaster risk reduction is a national and local priority with a strong institutional basis for implementation;
2. Identify, assess, and monitor disaster risks and enhance early warning;
3. Use knowledge, innovation, and education to build a culture of safety and resilience at all levels;
4. Reduce the underlying risk factors;
5. Strengthen disaster preparedness for effective response at all levels.
During that decade, the Great East Japan Earthquake with Mw 9.0 occurred on March 11, 2011. We must learn from such devastating experiences for the sake of future societies. To this end, International Research Institute of Disaster Science (IRIDeS), Tohoku University issued “HFA IRIDeS Review
Preliminary Report Focusing on 2011 Great East Japan Earthquake” in October 2013 in terms of HFA
guidelines from the academic viewpoints of professors at IRIDeS to disseminate the event’s lessons learned. IRIDeS faculties had enriched the report with more cases learnt from the disaster since then. This revised report adds more topics to the previous one with additional information of post-disaster urban recovery plan announced by municipalities affected by the 2011 Tsunami.
As well as the preliminary report, each topic deals with a specific case, contains context, the situation before and after the event, good practices, and problems, followed by future recommendations summarized at the end of the 6th chapter: 2011 Great East Japan Earthquake Review.
2. World's 21st Century Natural Disasters
No. Month/Year Disaster Type Country Killed Total AffectedEstimatedDamage
(US$ Million) No. Month/Year Disaster Type Country Killed Total Affected
Estimated Damage
(US$ Million) No. Month/Year Disaster Type Country Killed Total Affected Estimated Damage
(US$ Million) No. Month/Year Disaster Type Country Killed Total Affected Estimated Damage (US$ Million) 1 January 2010 Earthquake Haiti 222,570 3,700,000 8,000 14 August 2003 Heat wave Spain 15,090 880 27 May-August 2010 Flood China 1,691 134,000,000 18,000 39 May-June 2004 Flood Dominican Republic 688 10,002
2 December 2004 Earthquake Indonesia 165,708 532,898 4,452 15 August 2003 Heat wave Germany 9,355 1,650 28 October 2005 Storm Guatemala 1,513 475,314 988 40 February 2004 Earthquake Morocco 628 13,465 400 3 May 2008 Storm Myanmar 138,366 2,420,000 4,000 16 December 2004 Earthquake Thailand 8,345 67,007 1,000 29 July 2006 Heat wave France 1,388 41 October 2011 Earthquake Turkey 604 32,938 1,500 4 May 2008 Earthquake China 87,476 45,976,596 85,000 17 November 2013 Storm Philippines 7,986 16,106,807 10,000 30 August 2003 Heat wave Belgium 1,175 42 August 2007 Earthquake Peru 593 658,331 600 5 October 2005 Earthquake Pakistan 73,338 5,128,309 5,200 18 June 2013 Flood India 6,054 504,473 1,100 31 July 2003 Heat wave Switzerland 1,039 280 43 February 2010 Earthquake Chile 562 2,671,556 30,000 6 June-August 2010 Heat wave Russia 55,736 400 19 May 2006 Earthquake Indonesia 5,778 3,177,923 3,100 32 July 2006 Heat wave Netherlands 1,000 44 April-June 2013 Heat Wave India 557
7 December 2004 Earthquake Sri Lanka 35,399 1,019,306 1,317 20 April 2010 Earthquake China 2,968 112,000 500 33 November 2001 Flood Algeria 921 45,423 300 45 February 2002 Drought Malawi 500 2,829,435 8 December 2003 Earthquake Iran 26,796 267,628 500 21 September 2004 Storm Haiti 2,754 315,594 50 34 January 2011 Flood Brazil 900 45,000 1,000 46 July 2007 Heat wave Hungary 500
9 July-August 2003 Heat wave Italy 20,089 4,400 22 August 2003 Heat wave Portugal 2,696 35 January 2001 Earthquake El Salvador 844 1,334,529 1,500 47 August 2006 Flood Ethiopia 498 10,096 3 10 January 2001 Earthquake India 20,005 6,321,812 2,623 23 May-June 2004 Flood Haiti 2,665 31,283 36 January-February 2006 Extreme winterConditions Ukraine 801 59,600 48 April 2010-March 2011 Flood Colombia 418 2,791,999 1,000 11 March 2011 Earthquake Japan 19,846 368,820 210,000 24 May 2003 Earthquake Algeria 2,266 210,261 5,000 37 July 2003 Heat wave Croatia 788 49 September 2013 Earthquake Pakistan 399 185,749 100 12 August 2003 Heat wave France 19,490 4,400 25 December 2012 Storm Philippines 1,901 6,246,664 1,693 38 July 2013 Heat Wave UnitedKingdom 760 50 August-September 2006 Flood Ethiopia 364 8,000
13 December 2004 Earthquake India 16,389 654,512 1,023 26 August-September 2005 Storm United States 1,833 500,000 125,000
26 28 35 21 1 23 39 48 42 43 34 22 14 29 1230 32 15 31 40 33 24 9 37 38 2
Earthquake
Windstorm, Flood
Drought Heat wave
Extreme winter conditions This map indicates the fifty worst disasters
between 2001 and April 2014. These disasters are categorized into five types.
No. Month/Year Disaster Type Country Killed Total AffectedEstimatedDamage
(US$ Million) No. Month/Year Disaster Type Country Killed Total Affected
Estimated Damage
(US$ Million) No. Month/Year Disaster Type Country Killed Total Affected Estimated Damage
(US$ Million) No. Month/Year Disaster Type Country Killed Total Affected Estimated Damage (US$ Million) 1 January 2010 Earthquake Haiti 222,570 3,700,000 8,000 14 August 2003 Heat wave Spain 15,090 880 27 May-August 2010 Flood China 1,691 134,000,000 18,000 39 May-June 2004 Flood Dominican Republic 688 10,002
2 December 2004 Earthquake Indonesia 165,708 532,898 4,452 15 August 2003 Heat wave Germany 9,355 1,650 28 October 2005 Storm Guatemala 1,513 475,314 988 40 February 2004 Earthquake Morocco 628 13,465 400 3 May 2008 Storm Myanmar 138,366 2,420,000 4,000 16 December 2004 Earthquake Thailand 8,345 67,007 1,000 29 July 2006 Heat wave France 1,388 41 October 2011 Earthquake Turkey 604 32,938 1,500 4 May 2008 Earthquake China 87,476 45,976,596 85,000 17 November 2013 Storm Philippines 7,986 16,106,807 10,000 30 August 2003 Heat wave Belgium 1,175 42 August 2007 Earthquake Peru 593 658,331 600 5 October 2005 Earthquake Pakistan 73,338 5,128,309 5,200 18 June 2013 Flood India 6,054 504,473 1,100 31 July 2003 Heat wave Switzerland 1,039 280 43 February 2010 Earthquake Chile 562 2,671,556 30,000 6 June-August 2010 Heat wave Russia 55,736 400 19 May 2006 Earthquake Indonesia 5,778 3,177,923 3,100 32 July 2006 Heat wave Netherlands 1,000 44 April-June 2013 Heat Wave India 557
7 December 2004 Earthquake Sri Lanka 35,399 1,019,306 1,317 20 April 2010 Earthquake China 2,968 112,000 500 33 November 2001 Flood Algeria 921 45,423 300 45 February 2002 Drought Malawi 500 2,829,435 8 December 2003 Earthquake Iran 26,796 267,628 500 21 September 2004 Storm Haiti 2,754 315,594 50 34 January 2011 Flood Brazil 900 45,000 1,000 46 July 2007 Heat wave Hungary 500
9 July-August 2003 Heat wave Italy 20,089 4,400 22 August 2003 Heat wave Portugal 2,696 35 January 2001 Earthquake El Salvador 844 1,334,529 1,500 47 August 2006 Flood Ethiopia 498 10,096 3 10 January 2001 Earthquake India 20,005 6,321,812 2,623 23 May-June 2004 Flood Haiti 2,665 31,283 36 January-February 2006 Extreme winterConditions Ukraine 801 59,600 48 April 2010-March 2011 Flood Colombia 418 2,791,999 1,000 11 March 2011 Earthquake Japan 19,846 368,820 210,000 24 May 2003 Earthquake Algeria 2,266 210,261 5,000 37 July 2003 Heat wave Croatia 788 49 September 2013 Earthquake Pakistan 399 185,749 100 12 August 2003 Heat wave France 19,490 4,400 25 December 2012 Storm Philippines 1,901 6,246,664 1,693 38 July 2013 Heat Wave UnitedKingdom 760 50 August-September 2006 Flood Ethiopia 364 8,000
13 December 2004 Earthquake India 16,389 654,512 1,023 26 August-September 2005 Storm United States 1,833 500,000 125,000
45 4750 36 9 37 46 6 41 8 5 10 13 7 20 4 27 3 16 2 19 25 11 17 18 49 44
Data Source: EM-DAT: The OFDA/CRED International Disaster Database, Centre for Research on the Epidemiology of Disasters (CRED)
(Source: NOAA)
3. History of Natural Disasters in Japan (1888 - 2010)
Japan is located in one of the most disaster-prone areas in the world, and we Japanese have experienced many disastrous events throughout history. Thus Japanese society and cities are skilled at disaster management. Each disaster has helped develop and strengthen our disaster management system. Although we occasionally experience catastrophic disasters, the number of deaths and missing persons due to disasters has been declining as a result of gradual improvement of the various aspects of our disaster management system.
This map displays the distribution of major disasters in Japan from 1888 to 2010. About sixty disasters are classified into four types: earthquake or tsunami, volcanic disaster, windstorm or flood, and heavy snowfall.
1946 Nankai Earthquake (M8.0) : 1,443
→ 1947 • Disaster Relief Act
1948 Fukui Earthquake (M7.1) : 3,769
→ 1950 • Building Standard Law
1973 Mt. Sakurajima Eruption : —
→ 1973 • Act on Specia Measures for Active Volcanoes
1999 Torrential Rains in Hiroshima
→ 2000 • Act on Promotion of Sediment Disaster Countermeasures for Sediment Disaster Prone Areas
2000 Torrential Rains in the Tokai Region : 10
→ 2003 • Specified Urban River Inundation Countermeasures Act Nobi Earthquake (M7.9) : 7,273 1891 Typhoon Muroto : 3,036 1934 Torrential Rains : 925 1938 Typhoon Makurazaki : 3,756 1945 1947 Mt. Asama Eruption : 11 Typhoon Jane : 539 1950 Typhoon Ruth : 943 1951 1954 Typhoon Toyamaru : 1,761 Torrential Rains : 722 1957 1958 Mt. Aso Eruption : 12 Typhoons 23, 24, 25 : 181 1965 Typhoons 24,26 : 317 1966 Torrential Rains : 256 1967
Typhoon 17 and Torrential Rains : 171
1976 Heavy Snowfall : 101 1977 1977 Mt. Usu Eruption : 3 1979 Kita-Tango Earthquake (M7.5) : 2,925 1927 Heavy Snowfall : 152 1980 Nihon-kai-chubu Earthquake (M7.7) : 104 1983 Torrential Rains : 117 1983 Heavy Snowfall : 131 1983 Nagano-ken-seibu Earthquake (M6.8) : 29 1984 1990 Mt. Unzen Eruption : 44 Hokkaido-nansei-oki Earthquake (M7.8) : 230 1993 1993 2000 Mt. Usu Eruption : — Typhoon 23 : 98 2004 Heavy Snowfall : 152 2005 Heavy Snowfall : 231 1963 Typhoon 20 : 115 Niigata-ken-Chuetsu-oki Earthquake (M6.8) :15 2007 1943 Tottori Earthquake (M7.2) : 1,083 Heavy Snowfall : 131 2010 Torrential Rains : 79 Torrential Rains : 447 1972 Torrential Rains : 1,013 1953 1914 Mt. Sakurajima Eruption : 58 Storm damage : 670 1954 4
Data Source: “Disaster Management in Japan” (Cabinet Office, Government of Japan, 2011)
→ 1995 • Act on Special Measures for Earthquake Disaster Countermeasures • Act on Promotion of the Earthwuake-proof Retrofit of Buildings
• Amendment of Disaster Countermeasures Basic Act • Amendment of Act on Special Measures
for Large-scale Earthquakes
→ 1996 • Act on Special Measures for Preservation of Rights and Profits of the Victims of Specified Disasters → 1997 • Act on Promotion of Disaster Resilience Improvement in Densely Inhabited Areas
→ 1998 • Act on Support for Livelihood Recovery of Disaster Victims
→ 2005 • Amendment of Act on Promotion of the Earthquake-proof Retrofit of Buildings
• Amendment of Flood Control Act
• Amendment of Act on Promotion of Sediment Disaster Countermeasures for Sediment Disaster Prone Areas
1964 Niigata Earthquake (M7.5) : 26
→ 1966 • Act on Earthquake Insurance Insurance
1978 Miyagi-ken-oki Earthquake (M7.4) : 28
→ 1981 • Amendment of Building Standard LawInsurance
1995 Great Hanshin-AwajiEarthquake
2004 Niigata-ken-ChuetsuEarthquake
1888
Meiji Sanriku Earthquake Tsunami (M7.1) : 21,959
1896
Great Kanto Earthquake (M7.9) :
1923
Mt. Tokachi Eruption : 144
1926
Showa Sanriku Earthquake Tsunami (M8.3) : 3,064
1933 Mikawa Earthquake (M6.8) : 2,306 1945 Typhoon Kathleen : 1,930 1947 1948 Tokachi-oki Earthquake (M8.2) : 33 1952 Torrential Rains : 1,124 1953 Typhoon Kanogawa : 1,269 1958 Typhoon Ise-wan : 5,098 1959 Tonankai Earthquake (M7.9) : 1,223 1944 Tokachi-oki Earthquake (M7.9) : 52 1968 Izu-hanto-oki Earthquake (M6.9) : 30 1974 Izu-Oshima-kinkai Earthquake (M7.0) : 25 1978
Torrential Rains and Typhoon 10 : 439
1982
Miyake Is. Eruption : —
1983
Izu-Oshima Is. Eruption : —
1986
Miyake Is. Eruption and Niijima and Kozushima Is. Earthquake : 1
2000
Deaths and Missing Persons by Disasters (1945 - 2010)
Earthquake (epicenters marked), Tsunami
Volcanic disaster
Windstorm (landed places marked), Flood Heavy snowfall
(places with highest seasonal total marked)
Iwate-Miyagi Inland Earthquake (M7.2) : 23
2008
→ 1960 • Soil Conservation and Flood Control Urgent Measures Act
→ 1961 • Disaster Countermeasures Basic Act → 1962 • Act on Special Financial Support to Deal with Extremely Severe Disasters
Chile Earthquake Tsunami (M9.5) : 142
1960
Disaster (Magnitude) :
Year Number ofDeaths and Missing
approx. 105,000 Mt. Bandai Eruption : 461 Typhoon Ion : 838 (M6.8) : 67 (M7.3) : 6,437
(Image from Wikimedia Commons)
Tochigi
Prefecture
Ibaraki Prefecture
Chiba Prefecture
Tokyo
Metropolis
Saitama
Prefecture
Yamagata
Prefecture
Gunma
Prefecture
Kanagawa
Prefecture
5m 10m 15m Ofunato 16.7m Hachinohe 6.2m Erimo 4.1m Sendai 7.2m Kamisu 6.6m Susaki 3.2mData Source: Fire and Disaster Management Agency, (as of March 26, 2013)
4. Damage due to
2011 Great East Japan Earthquake and Tsunami
Hakodate City 1 0 Erimo Town 0 1 Sanami Town 0 3 Misawa City 2 41 Oirase Town 0 69 Hachinohe City 2 878 Hashikami Town 0 21
Iwate
Prefecture
Hokkaido
Aomori Prefecture
Yamagata
Prefecture
Miyagi
Prefecture
5m 10m 15m Ofunato 16.7m Hachinohe 6.2m Erimo 4.1m Sendai 7.2m Kamisu 6.6m Susaki 3.2mFukushima
Prefecture
City, Town, Village Number ofDeaths and Missing Number ofCompletely and Partially Damaged Houses
Data Source: Japan Meteorological Agency JMA Seismic Intensity 7 6+ 6-5+ 5-4 3 2 1
2011 Tsunami Height Estimated by JMA Survey Epicenter 38° 6'12'' N, 142°51'36'' E Magnitude 9.0 Depth of hypocenter: 24km 2011-03-11 14:46 (2011-03-11 05:46 UTC) 7
5. Various Post-tsunami Recovery Plans for the Coastal Areas
affected by 2011 Great East Japan Earthquake and Tsunami
野田村土地利用構想図 体育館 第1堤防 第2堤防
Data Source:
▪Fire and Disaster Management Agency (as of March 26, 2013) ▪Ministry of Land, Infrastructure, Transport and Tourism (MLIT,) Housing Bureau (as of April 1, 2013)
▪Ministry of Land, Infrastructure, Transport and Tourism (MLIT,) City Bureau, “Archive of Recovery Support Survey”Data ▪Reconstruction Agency (as of August 12, 2013) ▪Municipalities’ Websites
6. 2011 Great East Japan Earthquake Review
HFA Priority for Action 1:
and vice ministers are responsible for the section, and the Director-General and the staff of this section draw up basic disaster management policies in response to large-scale disasters by coordinating with ministries relevant to disaster management.1
National ministries in charge of disaster management have prepared countermeasures for disasters based on various acts that they hold jurisdiction over.
Ensure that disaster risk reduction is a national and a local priority with a strong institutional basis for implementation.
Keywords:
institutional structure, disaster management acts, disaster management plans
Context:
Japan’s national institutional and legislative frameworks for disaster management, originating in the 1880s, are well developed and have been refined after each large-scale disaster, in order to function at all national, regional, and local levels. The current disaster management framework is specified by the Disaster Countermeasures Basic Act of 1961, enacted after Typhoon Isewan in 1951, which caused severe damage. In the wake of the Great East Japan Earthquake (hereinafter GEJE) in 2011, new laws and amend laws have been enacted to introduce a new countermeasure framework against major earthquakes and other serious incidents to ensure the resiliency of Japan. Institutional structure 1: Key national players for disaster management: Central Disaster Management Council, Cabinet Office and national ministries
Before:
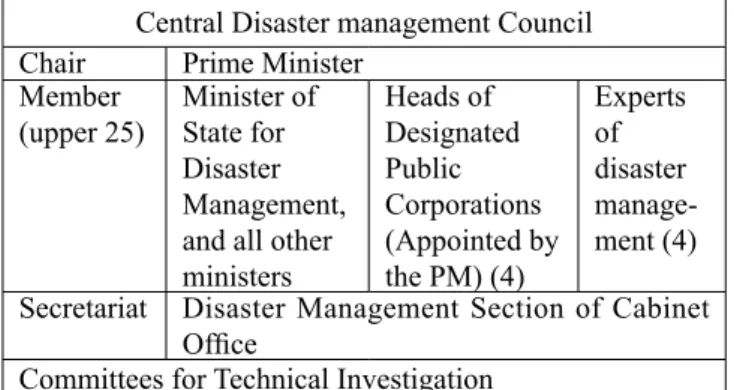
A basic disaster management system was introduced at the national level in 1961, and several national key players have taken central roles since then. The Central Disaster Management Council (established in 1962) discusses, evaluates and decides upon crucial disaster management policy. The Prime Minister chairs the council, and its members include all cabinet ministers (representing all ministries and agencies), four heads of important public organizations and four disaster management experts. This council has Committees for Technical Investigation, which investigate topics that require further research and assessment for scientific and administrative inputs (Table 1.1)
The Disaster Management Section of the Cabinet Office centrally manages coordination and collaboration among ministries and other relevant national organizations, and is in charge of the secretariat of the Central Disaster Management Council. A cabinet minister, deputy ministers
After:
The devastation wrought by the GEJE in the Tohoku region on March 11, 2011, led to the creation of a new reconstruction agency (See Figure 1.1). The Reconstruction Agency officially debuted on February 10, 2012, following the previous Headquarters of Reconstruction, which was set up in June 2011. The Reconstruction Agency was created under the Act Establishing the Reconstruction Agency and is planned to operate for 10 years. This agency is primarily responsible for coordinating various ministries’ budgetary and reconstruction procedures so that reconstruction efforts in all localities can proceed in a timely manner.
Central Disaster management Council Chair Prime Minister
Member
(upper 25) Minister of State for Disaster Management, and all other ministers Heads of Designated Public Corporations (Appointed by the PM) (4) Experts of disaster manage-ment (4) Secretariat Disaster Management Section of Cabinet
Office
Committees for Technical Investigation
Source: recreated from the Prime Minister and the Cabinet, available at: http://www.kantei.go.jp/fukkou/organization/reconstructiongrant.html
Fig. 1.1 Role of the National Reconstruction Agency
1 Ministries of Internal Affairs and Communications; Justice; Foreign Affairs; Finance; Education, Culture, Sports, Science and Technology; Health, labor and Welfare;
Agriculture, Forestry and Fisheries; Economy, Trade and Industry; Land, Infrastructure, Transport and Tourism; Environment; and Defense.
Table 1.1 Organization of the Central Disaster Management Council
HFA Core Indicator 1.1:
National policy and legal frameworks for disaster risk reduction exist and include decentralized responsibilities and capacities at all levels.
National Policy and Legal Framework for Disaster Risk Reduction
1
The Central Disaster Management Council created some committees for technical investigation following the GEJE. In April 2011, a committee on earthquake and tsunami countermeasures was set up to scientifically assess and integrate the lessons learned from the GEJE. Later in October of the same year, the Committee for Policy Planning on Disaster Management was established, followed by two new working groups for detailed analysis of countermeasures for the Nankai Trough Earthquake and Tokyo Inland Earthquakes. After the final reports by these committees were published, the Committee for Execution of Disaster Management Policy was established in March 2013.
Institutional structure 2: Managing disasters with plans Before:
Disaster management plans are basic tools for disaster preparedness in Japan. There are three types of such plans based on the Disaster Countermeasures Basic Act: 1) Basic Disaster Management Plan of the central government, 2) Disaster Management Operation Plans of ministries and quasi-governmental agencies, and 3) Local Disaster Management Plans of prefectures and municipalities. Plan 1) was first adopted in 1963 and has since been guiding the country’s disaster management. Plans 2) and 3) are drawn up based on the content of plan 1). These plans cover three disaster phases: i) mitigation and preparation, ii) response and iii) recovery and reconstruction, and are organized by disaster type, for example, earthquake, winds and floods, volcanoes, and snowstorms in the natural disaster category. Their content is revised as needed, and revisions have been more frequent in recent years.
After:
The first revision after the GEJE in the Basic Disaster Management Plan was the response to a large-scale tsunami. Previously, the response to tsunamis had not been emphasized enough and was included in the chapter on earthquakes in this plan. Furthermore, several fundamental revisions of the plan have been executed to reflect additional countermeasures, prescribe new acts and amend acts. Plans 2) and 3) have also been revised accordingly.
Legislative structure: Disaster Management Acts Before:
Since the Disaster Relief Act of 1947, one of the oldest disaster-related acts in modern legislation, Japan has passed various laws and acts on the management of and response to disasters. The content of these laws varies depending on the targets. The Flood Control Act (1949) and the Building Standards Act (1950) were drawn up to reduce damage from floods and earthquakes and/or fires, respectively. The Disaster Countermeasures Basic Act (1961) established the present framework of Japanese disaster management. It was drastically revised based on the lessons learned from the 1995 Great Hanshin-Awaji Earthquake. More recently, the Act on Support for Reconstructing the Livelihoods of Disaster Victims (1998) was established to secure the basic livelihoods of families affected by disasters.
After:
After the GEJE, the Japanese government actively established the new acts and amended existing acts.
- Two new acts for tsunami disaster management (June and December 2011)
- A revision of the Act on Special Measures concerning Urban Regeneration (April 2012)
- A revision of the Disaster Countermeasures Basic Act (June 2012 and June 2013)
- A new act concerning the reconstruction from major disasters (June 2013)
- A new act of countermeasures for the Tokyo Inland Earthquake (November 2013)
-A fundamental revision of an act for promotion of countermeasures for the Nankai Trough Earthquake (November 2013)
- A new basic act of national resilience for disaster management and mitigation (December 2013)
All of these acts were drafted by utilizing the precious lessons learned from the GEJE, and enacted to prepare for major disasters predicted to affect Japan in the near future.
After the Fukushima Daiichi nuclear accident, hospitalized patients who could not be evacuated easily were left behind in an area within a 20 km radius of the nuclear plant. On March 13, 2011, the Cabinet Office ordered the local government to assist with the evacuation of the hospitals inside the Restricted Area. In a situation where communication was limited and sufficient information could not be obtained, the evacuation of hospitalized patients was extremely difficult, resulting in at least 60 deaths by the end of March 2011 2.
Good practices:
There are seven hospitals within the 20 km radius around the Fukushima Daiichi Nuclear Power Plant. At the time of the accident, approximately 850 patients were hospitalized at these seven hospitals. Among these patients, about 400 were seriously ill. Futaba Hospital was one of these hospitals, and is located within a 5 km radius of the nuclear plant. In the case of Futaba Hospital, slightly ill hospitalized patients were transported out of the hospital on March 12, 2011. Seriously ill patients were left in the hospital, and there was no assistance for the seriously ill patients from the town office. Japan Self-Defense Forces and the local police arrived at the Futaba Hospital on March 14 and 15, and they transported the patients to the Sousou Healthcare Center, which was where surface contamination measurements of the evacuees were conducted at that time 2 (Fig. 1.2).
Problems:
Before the Fukushima Daiichi nuclear disaster, it was assumed that the possibility of a severe accident was extremely low and that complex disasters were highly unlikely. The Nuclear Regulation Authority (NRA) was established in 2012 to learn lessons from the Fukushima Daiichi nuclear disaster. The NRA postulates tremendous natural disasters, intentional airplane crashes and terrorist attacks. In order for regulations to reflect the lessons learned from the Fukushima Daiichi nuclear disaster and other international nuclear accidents, organizational independence of the NRA is important.
Fig. 1.2 Surface contamination measurements at the Sousou Healthcare Center on March 14, 2011
HFA Core Indicator 1.1:
National policy and legal frameworks for disaster risk reduction exist and include decentralized responsibilities and capacities at all levels.
Evacuation System for “Persons with Special Needs*” in Nuclear Disasters
*Elderly, Infants, Expectant and Nursing Mothers, Injured or Sick Persons, Persons (Children) with Disabilities, and Foreign Nationals, etc.
2
Keywords:
nuclear disasters, person requiring support under disaster situation, evacuation, hospitalized patients, Fukushima Daiichi nuclear disaster
Context:
The current Emergency Preparedness Guide was established in 1980 after the Three Mile Island nuclear accident in the US. Revisions were made after the Tokaimura nuclear accident. However, a drastic review of the Emergency Preparedness Guide was not carried out after the Chernobyl nuclear disaster because of the belief that a Chernobyl-type nuclear accident could not occur in Japan. After the occurrence of the Niigata-ken Chuetsu-oki Earthquake in 2007, many local governments hosting nuclear power plants requested that the national government prepare for complex disasters (including situations where a nuclear power plant could be affected by a large-scale natural disaster). However, the Guide was not revised drastically after the Niigata-ken Chuetsu-oki Earthquake on the assumption that severe nuclear accidents could never occur in principle since extremely stringent safety examinations were conducted during the design phase of nuclear power plant construction, and because local residents should not be misled or confused 2.
Before:
The Prefecture Regional Disaster Prevention Plan stipulates that the evacuation of hospitalized patients shall basically be implemented by the hospitals on their own. Evacuations of entire hospitals were not expected before the Fukushima Daiichi nuclear disaster.
2 Main report. The National Diet of Japan Fukushima Nuclear Accident Independent Investigation Commission. 2012.
HFA Core Indicator 1.2:
Dedicated and adequate resources are available to implement disaster risk reduction activities at all administrative levels.
Dedicated and Adequate Resources for Disaster Management in Japan
3
Keywords:
budgetary resources, human resources, informational resources
Context:
Japan is a unique country in that it invests ample resources in disaster management. The budget for disaster management is annually secured, and abundant supplemental budgets have been provided for rebuilding in the aftermath of the GEJE disaster. Additionally, given that Japan is aging and losing population, new forms of collaboration have been emerging to secure adequate human resources from the decreasing pool to fill the gap. Such collaboration efforts have accelerated further after the GEJE. Disaster white papers since 1963 are another form of useful resource for the national, regional, and local administrations, as well as private citizens.
Budgetary resources Before:
Although the proportion of the budget allocated for disaster management in the general account budget was decreasing prior to the GEJE, from 8% in 1997 to 3.5% in 2010, 1.24 trillion yen were appropriated for disaster management in 20103. In addition, abundant supplemental budgets have
often been provided for rebuilding public infrastructures after significant disasters.
After:
The GEJE’s direct economic damage is calculated as 16.9 trillion yen. As of July 2013, budgets for rebuilding post-GEJE are calculated to cover around 23.5 trillion yen for total direct losses4.
Human resources Before:
Inter-prefecture and -locality partnerships for mutual help, including objectives to share human resources, have been encouraged since 1995. Such partnerships have largely involved exchanging agreements. More recently, as a goal of decentralized governance, the Kansai Large-Area Coalition (Kansai Koiki Rengo) was formed on October 27, 2010, the first such organization in modern government administrations. This coalition comprises seven participating prefectures of the Kansai region. One of the seven administrative goals of this coalition is to establish a large-area disaster management system so that participating prefectures can provide or receive support for emergencies
After:
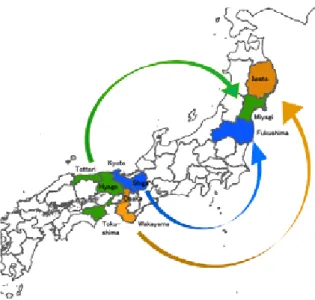
For the first time in disaster management history, the area administrative coalition is supporting the affected large-area regions. As part of the “counterpart system approach,” Osaka and Wakayama Prefectures partner with Iwate; Hyogo, Tottori, and Tokushima partner with Miyagi; and Shiga and Kyoto partner with Fukushima, each partnership including the dispatching of volunteers and specialists for short-term response and long-term rebuilding (Fig. 1.3). As of August 30, 2013, 136,000 man days in total have been dispatched. Additionally, the prefectures temporarily host evacuees from other prefectures5.
Informational resources
Since 1963, the Cabinet has published an annual disaster white paper structured to report significant disaster data for damages, responses, and changes affecting disaster management. This paper is a useful resource for national, regional, and local administrations as it reports the relevant statistics on disasters and their management, budget, and related laws and institutions. Administrations refer this paper for updating disaster management plans that they need to review annually. Since the GEJE, statistics and revised laws and regulations have been updated annually.
Source: http://blog.kahoku.co.jp/saisei/2012/03/post-33.html
Fig. 1.3: Counterpart Support by the Kansai Large-area Coalition
3 Cabinet Office, Government of Japan, 2011. “Disaster Management in Japan.” 4 Reconstruction Agency, 2013. “Reconstruction progress and issues.”
5 Kansai Large-Area Coalition. “Response of Kansai Large-Area Coalition on the Great East Japan Earthquake of 2011. Retrieved September 3, 2013, from
http://www.kouiki-kansai.jp/contents.php?id=219.
resulting from disasters beyond their own control. This coalition also strives to secure sufficient human and other resources for potential disasters.
National government supported the formulation of recovery plans for the affected municipalities in the first year after the disaster by organizing planning committees comprising prefectural and national government bureaucrats, consultants and individuals from the academic community. The Ishinomaki City government uniquely organized a recovery planning conference regularly from the second year; the chairman of which was a university professor. Four working groups, which were reorganized into three one year later, were organized under this council to change information, adjust each project and to share a common recognition of problems (Fig.1.4). Faculty members of the universities also support the reconstruction activities at the community level.
Good practices:
- Experts in architecture, civil engineering and urban planning working together as a team exceed the framework of their specialized field.
- Local governments and experts forge a long-term relationship with each other, which makes it possible to engage in a frank exchange of views.
- The experts contribute to consensus building in the local community through technical support.
- The experts function as an intermediary between the city administration and the local community.
Problems:
- Some of the advice was not accepted by the local government because it was impractical or because of limited administrative capacity.
- Similar cooperation between the local governments and faculty members is not widely observed in other regions.
Fig. 1.4 Role of university teachers in the public and private sectors
HFA Core Indicator 1.2:
Dedicated and adequate resources are available to implement disaster risk reduction activities at all administrative levels.
University Faculty as a Non-Governmental Resource to Support Disaster Risk Reduction in Recovery Planning with Local Government
4
Keywords:
planning aid, recovery planning, university teacher, community, local government
Context:
One of the characteristics of the Great East Japan Earthquake is that the damage caused by it and the following tsunami was overwhelmingly beyond the response capabilities of the affected local governments, which should be in charge of recovery planning, both quantitatively and qualitatively. Moreover, most of the local communities in the affected areas did not have sufficient experience in community planning for both hard and soft aspects. It was, therefore, expected that experts should support these planning activities.
Before:
Local governments were to formulate their own recovery plan by themselves because of the decentralization of power. However, it was very hard for them to do so by themselves because of a lack of experience. Local communities also faced a similar problem.
HFA Core Indicator 1.3:
Community participation and decentralization are ensured by delegating authority and resources to local levels.
Community Participation in Japan
5
Keywords:
voluntary community organization, business communities
Context:
Japan has a long history of community participation in disaster reduction activities. The notions of “self-help,” “mutual-help,” and “public-help” have been widely shared, especially after the 1995 Hyogoken-Nanbu Earthquake. The voluntary community organization for disaster management, represented by firefighting activities, is considered especially important for self-help and mutual help actions. Business communities have also begun preparing business continuity plans since 2005, when the Central Disaster Management Council prepared a guideline on this topic. Voluntary community organization for disaster management
Before:
Voluntary community organizations for disaster management are regulated in the Disaster Countermeasures Basic Act of 1961, number 5, article 2. According to the statistics of the Fire and Disaster Management Agency, 139,000 voluntary community organizations existed in 1,658 localities in 2009, and their activities covered 73.5% of all households across the nation6.
After:
Various communities that were significantly affected by the GEJE and had practiced their volunteer activities during normal periods in preparation for emergency response found their preparedness functional and effective. For example, creating a list of the population needing help (handicapped and elderly) was useful when evacuating them. Rules adopted prior to the GEJE to inform the community about individuals’ safety during significant disasters have also helped community members to identify those who were missing. Nevertheless, various issues emerged: for example, in the relationship between local governments and voluntary community organizations, some were unofficial and inhibited direct work, such as when goods and supplies for temporary evacuees were available only to those in designated evacuation shelters, whereas, in reality, evacuation shelters existed in many other places as demand was high after the GEJE’s unexpected size7. Currently, many activities led by
voluntary community organizations are being reviewed and assessed for better operations in the future.
Business communities preparing for disaster Before:
The Special Committee of the Central Disaster Management Council in 2005 developed and began promoting Business Continuity Plans (BCPs), which enable private corporations to prepare for disasters to mitigate damages and to continue operations during the response and recovery stage. Targeting large and medium enterprises in particular, this effort was expected to enable sustained business operations even in emergencies.
After:
The business community has researched the effectiveness of BCPs during and immediately after the GEJE. According to web-based research led by NTT data (the national telecom company)8, 44.7% of corporations either had or were
developing a BCP when the GEJE struck, among which 45% of large corporations already had BCPs. Regarding BCP operation, 65.7% of 263 corporations reported that the BCP either had problems in functioning, partially or completely, with the GEJE’s impact to the global supply chain, which extended beyond the size of “expected” disasters. A complete review is currently on-going in business communities to revise the contents of BCPs to operate more efficiently in future disasters.
6 Fire and Disaster Management Agency, 2009. “Chapter 4 Disaster management activities by self-help and regional resilience creation to disasters.” Firefighting White Paper,
retrieved September 29, 2013, from http://www.fdma.go.jp/html/hakusho/h21/h21/index2.html#dai4.
7 Fire and Disaster Management Agency, 2009. “Chapter 4 Disaster management activities by self-help and regional resilience to disasters.” Firefighting White Paper.
Retrieved September 29, 2013, from http://www.fdma.go.jp/html/hakusho/h21/h21/index2.html#dai4.
8 Ohashi, K., 2011. “How do we reflect lessons learned from the earthquake? Findings from the survey results of business continuity by corporations affected by the GEJE.”
Fig. 1.5 Volunteers Camping in a School Field, Six Months after the GEJE
9 Fire and Disaster Management Agency, 2007. “Enhancing mutual-supporting system between municipalities.” Retrieved August 28, 2013,from
http://www.fdma.go.jp/neuter/about/shingi_kento/h24/tikoutai/01/shiryo_02.pdf.
10 National Institute for Educational Policy Research, 2012. Activities by NPOs and volunteers following the Great East Japan Earthquake. Retrieved on September 28, 2013, from
http://www.nier.go.jp/jissen/chosa/rejime/2011/02_npo_vol/05_chapter3.pdf.
11 Fukumoto, H., 2013. Supporting affected areas by municipalities during emergency – assessing effectiveness of inter-governmental mutual-support agreements –.
Keywords:
Disaster Countermeasures Basic Act, volunteer activities, wide-area response and mutual support between
municipalities
Context:
Japan’s multi-sector platform for disaster risk reduction is functioning under the 1961 Disaster Countermeasures Basic Act. However, the GEJE and Tsunami have proven that there is no perfect system resilient to all types and sizes of disaster, regardless of how well the platform is established and operated. The national government response was limited, incapable of quickly responding to the needs of the affected local government as it was difficult for them to investigate the overall damage. Meanwhile, having a multi-sector platform has also proven that support from non-structured segments, such as volunteer efforts, could be quite useful. The platform then incorporates these lessons via modification of the Disaster Countermeasures Basic Act, in order to improve response capacity against future mega-disasters.
Before:
Under the 1961 Disaster Countermeasures Basic Act, the national government, local governments, Japan Red Cross, other key semi-governmental and humanitarian organizations and communities were prepared to function under emergency conditions throughout the response stage. The Act was significantly revised to further strengthen functions of emergency response headquarters and traffic regulations for better emergency management after the 1995 earthquake. At this time, the word “volunteer” was first included in the Act and in national law. Since 2005, the Cabinet office has established the Committee for Disaster-related Volunteer Activities to encourage citizens’ greater participation in disaster reduction activities. Various committees were established and meetings held in several cities nationwide, including topics related to wide-area response and networking on disaster management. Encouragement to reach agreements on mutual support during emergencies between neighboring local governments has increased during this period, and in 2010, 90% of local governments across Japan had reached such agreements9.
Problems:
Although local governments are technically mandated to act centrally for disaster response and management, prefectural and national governments are also required to step in and take the lead in responding to mega-disasters like the GEJE by creating emergency headquarters in their administrations.
and Tsunami, national and prefectural government provision of the necessary support to local governments was delayed because local governments’ help requests encountered complications resulting from the devastating damage to the usual means of reaching the national government.
Good practices:
Despite the initial difficulties in reaching the affected areas because of an insufficient volume of damage information and avoiding secondary disasters, numerous volunteers and organizations, including international and domestic NGOs, NPOs, and student groups, joined in to provide support in the affected areas (see Fig. 1.5 for volunteer participation six months later in Ishinomaki City). So far, 936,900 people in total have volunteered to support the affected region within the two years after the GEJE10. Furthermore, various
inter-governmental agreements have effectively supported the affected region by, for example, hosting disaster-affected populations who lost their houses in disasters. After:
In response to the GEJE disaster, the Disaster Countermeasures Basic Act was amended, effective April 12, 2013. Major revisions include i) strengthening response capacity for large-scale disasters; ii) providing residents with smooth and safe evacuation routes; iii) improving response capacity, and iv) enhancing learning of disaster management procedures in normal periods— all of which emphasize improvement in response to large-scale disasters. Another major focus for change has been public volunteer coalitions for better response capacity for mega-disasters. A unit called the “Coalition Group of Volunteers and Corporations for the Public Interest” was established in the Reconstruction Agency on February 10, 2012, replacing an existing volunteer management unit in the Cabinet office. In addition, the proportion of local governments’ mutual support extending beyond prefectural boundaries is increasing. For instance, there were 46.9% extra-prefectural agreements but in 2012, it has increased to 55.1%11.
HFA Core Indicator 1.4:
A national multi-sectoral platform for disaster risk reduction is functioning.
Japan’s Multi-sectoral Platform for Disaster Risk Reduction
6
HFA Priority for Action 2:
Identify, assess and monitor disaster risks and enhance early warning.Improvement in Risk Assessment and Early Warning Systems with Real-time Monitoring: Lessons from the 2011 Tohoku Earthquake and Tsunami
7
HFA Core Indicator 2.1:
National policy and local risk assessments based on hazard data and vulnerability information are available and include risk assessments for key sectors.
HFA Core Indicator 2.2:
Systems are in place to monitor, archive and disseminate data on key hazards and vulnerabilities.
HFA Core Indicator 2.3:
Early warning systems are in place for all major hazards, with outreach to communities.
Keywords:
hazard map, tsunami early warning, real-time monitoring, earthquake early warning, long-term earthquake forecast
Before:
Tsunami inundation maps produced from the risk evaluation based on historical events over 400 years have been distributed among the residents in coastal communities for utilization in developing their evacuation plans and preparedness procedures. Nevertheless, previous inundations were much smaller than the 2011 Tohoku Earthquake and Tsunami, which caused more casualties without evacuation. Earthquakes followed by tsunamis recurred throughout history in each coastal area. Japan’s Cabinet Office Central Disaster Mitigation Council evaluated the earthquakes and tsunamis for the target regions’ safety levels, and the Ministry of Education, Culture, Sports, Science and Technology (MEXT) Headquarters for Earthquake Research Promotion (HERP) evaluated seismic activities, which are updated every year. Those results are available for creating hazard maps, conducting disaster response drills, and increasing awareness through the mitigation plan. However, the gap between the estimated and observed inundations was so large that it allowed people to take insufficient action. Although the tsunami warning was issued roughly 3 min after the earthquake, about 19,000 people (90% of casualties) were killed by the 2011 Tohoku Tsunami within 20–30 min of its arrival at Sanriku and roughly 1 h of its arrival at Sendai bay; only two people were killed by the tsunami on the Pacific Ocean. The warning from the PTWC and Japanese media should have led to immediate Pacific coastal evacuation. Japan’s tsunami warning system began in 1952, providing information on the estimated tsunami arrival time and height, which is divided into two categories, depending on the arrival time lesser or greater than 1 h, that is, near or far field, respectively. The first tsunami warning in the 2011 Tohoku Earthquake was underestimated because
of the lower earthquake magnitude estimation, and the second was updated using the tsunami data observed by a GPS buoy in real time offshore from Sanriku, Tohoku. Reasons for the large number of casualties due to the tsunami remain under investigation and discussion. Not only the warning’s accuracy but also its dissemination, traffic jams on the roads, and wrong directions to safe places have been reported by eyewitnesses.
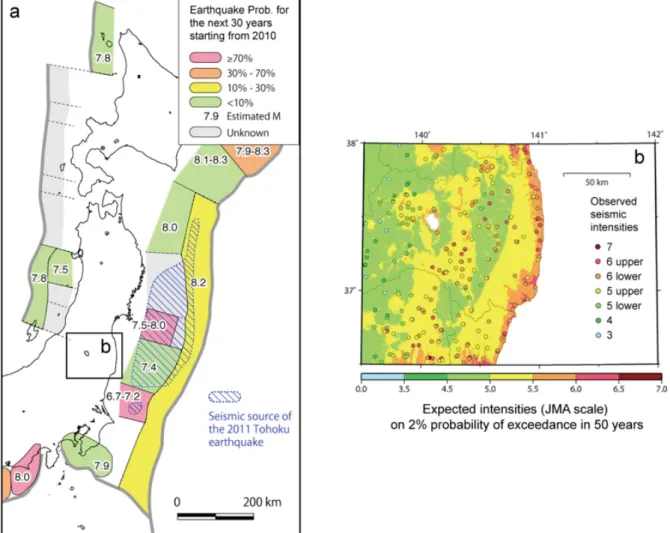
HERP, a special governmental organization attached to the Prime Minister’s office (now part of MEXT) and established in 1995, has been releasing probable seismic hazard maps annually since 2005, compiling thousands of instrumental, historical, and paleoseismological data and numerical models of plausible future earthquake sources. The map released in 2005 was the first publically available probabilistic seismic hazard map of major shaking for various purposes such as city planning and emergency local government response. In the map, the HERP expressed concern about frequent M7-8 earthquakes along the Japan trench (the Sanriku coast to the Boso Peninsula) and announced a 98% chance of an M7.4-8.0 earthquake offshore of Miyagi (Sendai) for the next 30 years, based on 37-year average inter-event time of large subduction earthquakes during the past 200–300 years. Such high probability has effectively stimulated seismic retrofits, better city planning, and disaster drills. However, the extent of the M9.0 2011 Tohoku Earthquake’s large shaking areas was much wider than the map estimates, especially in Fukushima and Ibaraki, the southern region of the 2011 source.
Despite the size of the main Tohoku shock and areas of large seismic intensity, numerous buildings collapsed (~400,000), mostly from the tsunami; the number collapsing from shaking was rather limited. Less damage was observed in the newer buildings and houses. The ratio of the death toll associated with the collapses was less than several percent of the total, demonstrating that Japan’s building code, regulated since 1981 and reflecting the 1978 Miyagi-oki earthquake, worked effectively.
After the 1995 Kobe Earthquake, the Japanese government funded an enormous budget to deploy thousands of seismometers and GPS stations to monitor seismic and crustal activity. The National Research Institute for Earth Science and Disaster Prevention (NIED) has built three seismic networks (Hi-net, F-net, and K-net) for various purposes, and the Geospatial Information Authority of Japan (GSI) has operated 1,240 permanent GPS stations to monitor near-real-time ground movement. Furthermore, the ALOS satellite launched in 2006 by the Japan Aerospace Exploration Agency (JAXA) has been providing synthetic aperture radar data associated with several devastating earthquakes, including the Tohoku Earthquake, which expanded understanding of the earthquake rupture process. Data circulation and data sharing have improved annually and now allow even foreign scientists and engineers to help us provide better models and warnings. Such dense networks and real-time monitoring systems enable the Japan Meteorological Agency (JMA) to publically announce seismic intensity distribution within 1.5 min and the activity’s detailed hypocenter and magnitude information
and operations. However, the Tohoku Earthquake’s size was so great that immediate estimate of magnitude was 7.9 because of magnitude saturation in the high-frequency domains, causing underestimates of the tsunami height. Since 2007, the JMA has been operating the earthquake early warning system, which provides immediate estimates of strong shaking within seconds to people before the actual seismic wave arrives. People can be informed of the warning via TV, radio, and mobile phone, as well as special devices, when the estimated JMA intensity reaches 5 or higher. Seventeen cases of the early warning through 2010 have proven its validity and efficacy for disaster mitigation, for example, by suggesting that students hide themselves under their desks in school. In the Tohoku Earthquake, the system provided a warning eight seconds before the primary wave arrived at the city of Sendai, and successively stopped bullet trains in the Tohoku area. However, it underestimated ground acceleration in the Tokyo metropolitan area. Furthermore, the Tohoku Earthquake’s numerous aftershocks revealed the weakness of the early warning system in that it released a number of false alarms resulting from unexpected remote simultaneous aftershocks and interruptions of data transmission.
The JMA has been announcing advisories about the probabilities of subsequent large shaking (intensities 5 or higher) due to aftershocks since the 2004 Niigata-ken-Chuetsu Earthquake (M6.8). Statistics of well-recorded early aftershocks enable us to extrapolate the subsequent three- or seven-day probability of large aftershocks. It is useful to promote public awareness of the continuing danger. The advisory worked after the Tohoku Earthquake. However, the widespread aftershocks and remotely triggered earthquakes were unprecedented because of its extent of crustal deformation. Several M6 class inland earthquakes have occurred and caused local damage in Akita, Fukushima, Nagano, and Shizuoka Prefectures, located 100 km to 300 km from the locus of high seismic slip.
After:
To overcome the problem of inadequate evacuation due to the map’s underestimated inundation, the guideline for creating a tsunami hazard map is undergoing modification and revision. For example, the scenario should include the probable maximum as well as the previous maximum, and should be expanded to several scenarios to avoid a sense of certainty, especially of unjustified safety.
A new offshore network system in the Pacific Ocean, east of Japan, is going to be installed with more than 50 seismic and tsunami monitoring sensors, covering the trough in the deep sea where earthquakes and tsunamis have repeatedly originated. The system enables monitoring them in real time and providing more accurate estimations, even for a large-scale event.
The HERP confirmed the validity of the methodology for creating the probabilistic seismic hazard map by retrospective tests beginning in 1890. The map underestimated the strong ground motion in Tohoku because of the ~200–300-year relatively short period of reliable historical and instrumental data.
We may have to consider hypothetical M9 super-cycles by
magnitude of the anticipated large earthquakes along the Nankai trough for southwest Japan has now increased to M9.0, based on the tsunami sediment and paleo-geodesy along the coastal regions.
To overcome the magnitude saturation issue that emerged from the Tohoku Earthquake, the Geospatial Information Authority of Japan (GSI) and Tohoku University have been developing a real-time magnitude determination system using continuous GPS data and a data assimilation technique. Problems:
Limitation in the deterministic evaluation for a low-frequency event such as the 2011 Tohoku disaster suggests a new approach, combining the statistical method with an inter-disciplinary approach including history, geology, sedimentrology, and physiography. A multi-scenario prediction would reduce the risk of governments and citizens having a false sense of certainty or safety.
Although the tsunami warning for a far field event is effective, the issues in a near field event remain because of having a short evacuation window. An early warning system should trigger the people to evacuate or take mitigating action. This system should be connected or cooperate with the planning of evacuations and systems/facilities in each area, which would require understanding people’s reasons for not taking action to move to safe areas despite receiving the warning in the 2011 Tohoku disaster. At the beginning of the earthquake and tsunami generation, errors or indefinite remains can be reduced by monitoring data in real time, indicating a speed–accuracy trade-off. It is important to receive the updated information timely after the event. Then the dissemination system, by combining mass media, ICT, and public information, can ensure people’s access to information at any time.
The recent destructive earthquakes including the Tohoku Earthquake raised several critical issues in the probabilistic seismic hazard map. However, the map, averaging probabilities of strong ground motion from various sources in a given place, remains useful for seismic damage mitigation. The larger issue is to avoid people’s misunderstanding: the map does not indicate “earthquake probability.”
In the Tohoku Earthquake, Japan’s recent building code demonstrated its protection against strong seismic motion. However, the domain of seismic acceleration and local intensity at a subduction earthquake is frequently different from that caused by large, shallow, inland earthquakes. Reconstructions and seismic retrofits of the old buildings are strongly recommended.
The earthquake early warning system has been steadily improving since its 2007 initiation. Frequent drills in the immediate action necessary within seconds before a seismic wave arrives have become far more important for protecting human life. Thus, we need to educate people on the warning system’s limitations, particularly for large inland earthquakes, and further promote seismic retrofits to prevent the collapse of old buildings.
Fig. 2.1 a) Earthquake Probabilities of Subduction Earthquakes for the Next 30 Years (HERP, 2010).
b) A Comparison between the Expected Seismic Intensities Calculated from the Long-term Forecast and Observed Intensities Recorded for the 2011 Tohoku Earthquake.
Fig. 2.2 Observed Seismic Intensities of the 2011 Tohoku Earthquake (left) and Intensities Estimated from the JMA Earthquake Early Warning System (right). (Yamada, 2011)
HFA Core Indicator 2.1:
National policy and local risk assessments based on hazard data and vulnerability information are available and include risk assessments for key sectors.
Importance of Quantitative Assessment of Uncertainties and their Visualization in Tsunami Hazard Assessment
8
Keywords:
tsunami hazard assessment, quantitative uncertainty assessment, visualization of uncertainty
Context:
A tsunami hazard map is an indispensable map that shows the possible tsunami inundation area in order to consider tsunami disaster prevention measures. The Japanese government and most of the local governments along coastal areas in Japan have published many tsunami hazard maps.
Before:
Before the GEJE, the Miyagi-oki earthquake and the Sanriku-oki earthquake were assumed in the tsunami hazard maps published by the Miyagi prefectural government. The tsunami hazard maps published by most of the local governments along coastal area have also adopted an earthquake scenario.
After:
In many coastal areas of the Tohoku region, the area inundated by the GEJE tsunami exceeded the area specified in the tsunami hazard maps. As a result, some residents did not evacuate because they believed the inundation hazard maps. Against this background, there is a recent proposal to categorize a tsunami hazard as one of two types: L1
damage even though they are not very high, and L2 tsunamis, which occur at an extremely low frequency but cause massive amounts of damage.
Good practices:
It is certain that tsunami hazard maps have facilitated tsunami evacuation for the residents to some degree following the GEJE and other past earthquakes.
Problems:
Many uncertainties in tsunami wave height are present in each phase of the tsunami hazard assessment: earthquake generation, tsunami propagation and tsunami inundation. A problem is that the uncertainties are not explicitly described in the tsunami hazard maps. Tsunami hazard maps that do not concretely show the uncertainties could generate a situation beyond the assumption again such as the GEJE and mislead residents about potential tsunami hazards. In the future, we need to quantify the uncertainties and clarify how much we can assure the tsunami hazard assessments. Hazard maps based on the two types of tsunamis (L1 and L2) are still insufficient for understanding the potential tsunami hazard. Some examples of visualizing uncertainties are as follows. Fig. 2.3 shows an uncertainty in the coastal tsunami wave height. Here, we defined the uncertainty as a coefficient of variation of the possible tsunami wave height. The uncertainty increases as the points pinken. We can also see regional characteristics of the uncertainty. Fig. 2.4 shows the uncertainty of the tsunami inundation around Soma port. The green area is the tsunami inundation area for a 500-years return period. The red and blue areas are inundation areas when the uncertainties are considered. Although the return period for each of the three cases is 500 years, the inundation areas factoring in the uncertainties differ. If the tsunami hazard map explicitly indicates the uncertainties of the tsunami hazard assessment as indicated above, residents who use the map can properly understand the uncertainties of the tsunami inundation area.
1 Fukutani, Yo., Suppasri, A., Abe, Y. and Imamura, F. (2014). Stochastic analysis and uncertainty assessment of tsunami wave height using a random slip source parameter model,
Stochastic Environmental Research and Risk Assessment. (submitted)
Fig. 2.3 Coefficient of variation of tsunami height
along Tohoku coastal area1 Fig. 2.4 Example of a stochastic tsunami hazard map