JAIST Repository: Study of DC-based Smart Home Energy Management System for Nanogrid
90
0
0
全文
(2) Master’s Thesis. Study of DC-based Smart Home Energy Management System for Nanogrid. HOSSAIN Md. Jakaria. Supervisor Associate Professor Yuto Lim Second Supervisor Professor Yasuo Tan. Graduate School of Advanced Science and Technology Japan Advanced Institute of Science and Technology (Information Science). March, 2020.
(3) Abstract. Nanogrid is a branch of a microgrid that distributes power to residential homes or buildings by sustainable energy sources. DC Nanogrid has characterized as the structure of DC Low voltage distribution. The residential DC home appliances user expands with advanced power electronics technology because most of the power generation produces DC energy from renewable energy sources without the effect of environmental hazards. A lot of renewable energy sources are organized into the power grid which is more popular because most of the home appliances depend on renewable energy sources for environmentally friendly. So, Home appliances are sifted to future energy. The purpose of this study is DC nanogrid is a promising trend because of home appliances in the future tend to be shifted to use DC energy. So, different kinds of loss have happened in the energy distribution system. In this case, DC Home Appliances (HA) create many conversion loss by multilevel voltage HA in DC home. In DC nanogrid, the minimize of energy conversion loss is one of the most important issues for the DC Home Energy Management which is occurred by Direct Current to Direct current conversion of multi-level voltage in residential households for the DC Home Energy Management System (DC-HEMS) that need to be concerned. So, to solve these significant issue, it is necessary to analyze energy distribution parameter residents activities, energy conversion devices, Battery energy storage system (ESS), Solar Photovoltaic (PV) System, Fuel Cell (FC) System, DC to DC converter, and Home Appliances Management System (HAMS), power distribution energy conversion loss and so on. In this i.
(4) thesis, I do a study of PV System, FC System, DC to DC converter efficiency, minimum energy conversion loss. The implementation of a novel 4-level DC Home Energy Management System (DC-HEMS) scheme has considered the DC-DC conversion loss and the efficiency of the system by adding another low voltage conversion level to reduce the conversion loss. As a result, it is more tolerant of the energy distribution system and establishes a significant impact on the residential home or building power distribution system for minimum energy conversion loss and minimum electricity cost for Nanogrid. The simulation results show that this proposed model provides 96% efficient energy conversion and 16.83% more efficient compared to another multilevel voltage conversion system.n this thesis, we do a study of PV System, FC System, DC to DC converter efficiency, minimum energy conversion loss .4 Level DC Home Energy Management System (4LDC-HEMS) scheme of home appliances for Naongrid.This study will be solved the significant problem based on DC HEMS by the Matlab simulation with human activities and real experimental data from iHouse. Keywords: Solar Photovoltaic (PV), System, Fuel Cell (FC) System, Battery energy storage system (ESS), 4 Level DC (4LDC), DC Home Energy Management System (DC-HEMS), Energy conversion loss, Nanogrid. ii.
(5) Acknowledgment Most importantly, I might want to express gratitude toward God for invigorating me and mental fortitude and furthermore for keeping me encompassed by devoted educators, adoring loved ones all through my whole life. I have been special to have Associate Professor Yuto Lim as my chief supervisor. I might want to offer my most noteworthy thanks and regard to him for his amazing direction, nonstop consolation, and backing through the most recent tow years. His scrupulousness, love for flawlessness, and devotion towards work has constantly propelled me to tenaciously put forth a strong effort. At the point when looked with challenges or predicaments, both in examine just as in my own life. I generally trusted I could depend on him for direction. I am extremely obligated to him for making my Master experience a significant one. I thankfully recognize the liberal help and collaboration of Professor Dr. Yasuo Tan, who is my second supervisor. He gave a great deal of significant remarks and scholarly endeavors to my exploration. I am pleased to have the option to work under his incredible supervision. I am profoundly appreciative to my minor research supervisor Associate Professor Kiyofumi Tanaka, who has given me the power framework steadiiii.
(6) ness and control information during my minor research work. He gave supportive rules, talks and recommendations for my minor research as well as for primary research. I am likewise appreciative to Assistance Professor Saher Javed, JAIST, for serving on my paper board. I am additionally thankful to Ministry of Education, Culture, Sports, Science and Technology, Japan for giving JASSO and Ishikawa Prefecture grant to carry on my lord research. I value all individuals from ”Tan and Lim Lab ”for their help and collaboration. I wish them achievement in their future endeavors. I am always thankful to my family for their fantastic love, gifts, motivations, backing, endeavors, and forfeits, without which not have come this far. Unique gratitude to my folks, my uncle and companion, each were there when I required them and continually ready to help when they could, and for that I am genuinely grateful. At long last, both have consistently been exceptionally rousing and adoring. Much obliged for getting me and sharing delights just as stresses. To every one of you, I devote my proposal.. iv.
(7) Contents. Abstract. i. Acknowledgment. iii. Glossary. xi. 1 Introduction. 1. 1.1. Problem Statement . . . . . . . . . . . . . . . . . . . . . . . .. 2. 1.2. Research Motivation . . . . . . . . . . . . . . . . . . . . . . .. 3. 1.3. Research Objective . . . . . . . . . . . . . . . . . . . . . . . .. 3. 1.4. Research Approach . . . . . . . . . . . . . . . . . . . . . . . .. 4. 2 Literature Review. 6. 2.1. Smart Grids . . . . . . . . . . . . . . . . . . . . . . . . . . . .. 6. 2.2. Microgrid . . . . . . . . . . . . . . . . . . . . . . . . . . . . .. 8. 2.3. Nanogrid . . . . . . . . . . . . . . . . . . . . . . . . . . . . . .. 9. 2.4. AC to DC Converter . . . . . . . . . . . . . . . . . . . . . . . 10. 2.5. DC to DC Converter . . . . . . . . . . . . . . . . . . . . . . . 11. 3 DC-Based Nanogrid. 19 v.
(8) 3.1. Intoduction . . . . . . . . . . . . . . . . . . . . . . . . . . . . 19. 3.2. DC-Based Nannogrid Structure . . . . . . . . . . . . . . . . . 20. 3.3. Generation Technology . . . . . . . . . . . . . . . . . . . . . . 22 3.3.1. Photovoltaic Array . . . . . . . . . . . . . . . . . . . . 22. 3.3.2. Fuel Cell . . . . . . . . . . . . . . . . . . . . . . . . . . 23. 3.4. Energy Storage . . . . . . . . . . . . . . . . . . . . . . . . . . 25. 3.5. Generation Backup . . . . . . . . . . . . . . . . . . . . . . . . 26 3.5.1. Load Characteristics . . . . . . . . . . . . . . . . . . . 28. 4 DC Nanogrid Model. 30. 4.1. System Model of DC-HEMS . . . . . . . . . . . . . . . . . . . 31. 4.2. Experimental House . . . . . . . . . . . . . . . . . . . . . . . 32. 4.3. Energy sources Model for DC Nanogrid . . . . . . . . . . . . . 32. 4.4. 4.3.1. Solar Potovoltaic System Model . . . . . . . . . . . . . 32. 4.3.2. Fuel Cell System Model . . . . . . . . . . . . . . . . . 34. 4.3.3. Battery energy storage System Model . . . . . . . . . . 38. Distribution System Model for iHouse . . . . . . . . . . . . . . 41 4.4.1. 4 level DC System Model . . . . . . . . . . . . . . . . . 41. 4.4.2. System Model of Daily Electric Billing . . . . . . . . . 44. 4.4.3. System Model of DC-based Nanogrid . . . . . . . . . . 46. 5 Numerical Simulation Results 5.1. 48. Result and Discussion . . . . . . . . . . . . . . . . . . . . . . 51 5.1.1. PV Module . . . . . . . . . . . . . . . . . . . . . . . . 51. 5.1.2. PV Module for Naogrid . . . . . . . . . . . . . . . . . 53. 5.1.3. FC Module for Naogrid . . . . . . . . . . . . . . . . . . 55 vi.
(9) 5.2. 5.1.4. ESS characteristic for Naogrid . . . . . . . . . . . . . . 56. 5.1.5. Power of human activities, PV and FC for Naogrid . . 57. Energy Calculation . . . . . . . . . . . . . . . . . . . . . . . . 59 5.2.1. Energy loss Calculation . . . . . . . . . . . . . . . . . . 59. 5.2.2. Energy Efficiency Calculation . . . . . . . . . . . . . . 64. 6 Conclusion. 69. 6.1. Concluding Remarks . . . . . . . . . . . . . . . . . . . . . . . 69. 6.2. Future Work . . . . . . . . . . . . . . . . . . . . . . . . . . . . 70. vii.
(10) List of Figures 2.1. Schematic of Smart Microgrid . . . . . . . . . . . . . . . . . .. 7. 2.2. Schematic of Nanogrid . . . . . . . . . . . . . . . . . . . . . .. 9. 2.3. Full Bridge Rectifier . . . . . . . . . . . . . . . . . . . . . . . 10. 2.4. Single Input Single Output Boost converter. 2.5. Single Input Multi Output Buck Boost Converter . . . . . . . 14. 2.6. General form of multi input single output converter . . . . . . 15. 2.7. Multi Input Multi Output Buck Boost Converter . . . . . . . 16. 2.8. Bidirectional DC to DC Buck Boost Converter . . . . . . . . . 18. 3.1. Structure of DC-based nanogrid. . . . . . . . . . . . . . . . . . 20. 4.1. System Model of DC-HEMS . . . . . . . . . . . . . . . . . . . 31. 4.2. iHouse . . . . . . . . . . . . . . . . . . . . . . . . . . . . . . . 32. 4.3. Solar radiation towards solar photovoltaic panel . . . . . . . . 33. 4.4. PEMFC diagram . . . . . . . . . . . . . . . . . . . . . . . . . 35. 4.5. Basic Fuel Cell system model . . . . . . . . . . . . . . . . . . 36. 4.6. JIS C 8851 standard on operation process diagram of fuel cell. . . . . . . . . . . 13. power generation unit . . . . . . . . . . . . . . . . . . . . . . . 37 4.7. Generic rechargeable ESS model . . . . . . . . . . . . . . . . . 39. viii.
(11) 4.8. Characteristic of Charging and discharging for ESS . . . . . . 40. 4.9. 3 Level DC System Model . . . . . . . . . . . . . . . . . . . . 43. 4.10 4 Level DC System Model . . . . . . . . . . . . . . . . . . . . 44 4.11 4 Level DC System Model Discretion . . . . . . . . . . . . . . 45 4.12 System Model of Daily electric billing . . . . . . . . . . . . . . 46 4.13 System Model of DC-based Nanogrid . . . . . . . . . . . . . . 47 5.1. Load operational schedule (Turn ON and OFF Mode) . . . . . 52. 5.2. Comparison of actual power and Simulation power generated from PV . . . . . . . . . . . . . . . . . . . . . . . . . . . . . . 53. 5.3. Simulation power generated from PV for Nanogrid . . . . . . . 54. 5.4. Energy conversion efficiency between PV and 400V DC Bus . 54. 5.5. Simulation power generated from FC for Nanogrid . . . . . . . 55. 5.6. Energy conversion efficiency between FC and 400V DC Bus . . 56. 5.7. PV and FC is as like power generator for ESS . . . . . . . . . 57. 5.8. Simulated Power of human activities, PV and FC . . . . . . . 58. 5.9. Energy conversion efficiency for DC to DC Converter C13 . . . 58. 5.10 Energy conversion efficiency for DC to DC Converter C14 . . . 59 5.11 Energy conversion Efficiency Comparison and Analysis for different BUS Voltage . . . . . . . . . . . . . . . . . . . . . . . . 63 5.12 Energy loss parentage of 3LDC System . . . . . . . . . . . . . 64 5.13 Energy loss parentage of 4LDC System . . . . . . . . . . . . . 64. ix.
(12) List of Tables 4.1. 400 V DC Home Appliances . . . . . . . . . . . . . . . . . . . 42. 4.2. (48-50)V DC Home Appliances . . . . . . . . . . . . . . . . . 42. 4.3. simulation parameter . . . . . . . . . . . . . . . . . . . . . . . 42. 4.4. 24-30) V DC Home Appliances . . . . . . . . . . . . . . . . . 42. 4.5. (5-12) V DC Home Appliances . . . . . . . . . . . . . . . . . . 43. 5.1. Simulation parameters and setting . . . . . . . . . . . . . . . . 49. 5.2. Simulation parameters and setting . . . . . . . . . . . . . . . . 50. 5.3. Simulation parameters and setting . . . . . . . . . . . . . . . . 50. 5.4. Improvement of 4LDC System model (Compared with 3LDC). 67. 5.5. Improvement of 4LDC System model (Compared with 3LDC). 67. 5.6. Improvement of 4LDC System Model (Compared with 3LDC). 68. x.
(13) Terms and Abbreviations HA : Home Appliances HAMS : Home Appliances Management System DC : Direct Current AC : Alternative Current DC-HEMS : Direct Current Home Energy Management System PV : Solar Photovoltaics FC : Fuel Cell SOFC :solid oxide fuel cell EV : Electric vehicle BLDC : Brush Less DC motor BMS : Battery Management PEMFC : Proton-Exchange Membrane Fuel Cells ESS : Battery Energy Storage System SOC :State of charge DOC :State of charge discharge 4LDC-HEMS :4 Level DC Home Energy Management System SISO: Single Input Single Output DC to DC Converter SIMO: Single Input Multi Output DC to DC Converter MISO: Multi Input Single Output DC DC Converter xi.
(14) MIMO: Multi Input Multi Output DC to DC Converter MOSFET: The Metal–Oxide–Semiconductor Field-Effect Transistor HVDC: High Voltage DC Bus GS : Energy Generation and Storage HHA: High Power Home Appliances FHA : Fixed Home Appliances without Battery PHA : Portable Home Appliances with Battery. xii.
(15) Chapter 1 Introduction Nanogrids can be characterized as the subcategory of microgrid which can be used for powering a Smart Home or Building which is a low voltage DC distribution system inside structures of building or home. DC power electronic burdens like LED Lights, Brush Less DC motor (BLDC) fans, Battery Management System (BMS) and Sustainable Energy Sources (SES) like Solar Photovoltaics (PV) and Fuel Cell (FC) Converters can be incorporated to the Nanogrid. All the more constructively when contrasted with typical AC that why less power change stages. DC Nanogrid is dc distribution system which means low voltage, and this is particularly reasonable for private power necessities. The sustainable power source assets like a breeze and PV and FC in the Nanogrid. The battery management system is utilized to guarantee an uninterruptible stockpile to the high need burdens and furthermore to continue the stable activity of the Nanogrid.. 1.
(16) 1.1. Problem Statement. In the energy distribution system, many problems are challenging issues for the Energy distribution. such as distribution system loss reduction, energy efficiency in the demand side, system stability and control, efficient energy storage, voltage rise problems, voltage stability problems, operation management under islanding mode, allowable penetration of variable generation and coordination with the grid. In this case I like to consider about loss reduction particularly energy conversion loss reduction for DC energy distribution system in DC home. The energy management system is the most significant topic for the energy distribution system . In the energy distribution system, many problems are challenging issues. such as distribution system loss reduction, energy efficiency in the demand side, system stability and control, efficient energy storage, voltage rise problems, voltage stability problems, operation management under islanding mode, allowable penetration of variable generation and coordination with the grid. However, our home appliances are shift AC to DC for the effect of future energy and DC home appliances raises. In DC Home, energy conversion loss is extended for multi-level voltage home appliances. So energy conversion loss stays unexpectedly [1]. In this case, many researchers focus on energy loss reduction while there are many approaches that can be applied to reduce loss. For the exam, 3 Level DC HEMS is one of them. Hence, this research will focus on implementing 4LDC HEMS which is a more efficient DC-based HEMS than 3LDC HEMS and will ensure minimum cost and loss.. 2.
(17) 1.2. Research Motivation. Nowadays, DC nanogrid is a promising trend because of home appliances in the future tend to be shifted to use DC energy. In DC nanogrid, DC-DC conversion loss of multi-level voltage conversion in residential households is one of the problems that need to be concerned. The causes of the approach and dealings of DC loads are always used because of the growing numbers of electronic devices in homes. An efficient system is a key factor for practical vitality systems. Today, The innovation of DC-based system have been generally utilized in more applications and enterprises, for example, car, aviation, telecom, or power distribution. Renewable Energy instruction sets the aim of reducing energy loss in energy distribution by means of energy conversion performance and distribution improvements. As explained effect dc system for the DC Home energy management system. However, energy consumption can be reducing the energy wasted due to the appropriate DC system. Thus, the inspiration for this research is to service minimum energy loss by the DC home energy management system for nanogrid. The capability of the system should be able to compute energy efficient algorithms strategies for nanogrid.. 1.3. Research Objective. The objective of this research is to execute a minimum loss of DC-based Smart Home Energy Management System for Nanogrid. Hence, the first aim of this research is to implement DC Home which is happened minimum. 3.
(18) energy conversion loss in DC home. The second aim of this research is to improve efficiency and minimizes electric costs by introducing a novel DC home energy management system model. This research will release a novel way to solve the problem of the controllability issues of DC-based home energy management systems for nanogrid.. 1.4. Research Approach. This research focuses on the design and modeling of minimum energy loss DC-HEMS. In this research, the system is the design of some sections as a system required. Chapter 1 is explained about research motivation DC based HEMS nanogrid and the objective of the factual problem in DC home. Furthermore, the research methodology is a mansion according to system operational activities. Chapter 2 is a introduction and survey that focuses on two key focuses. First presenting what is a smart grid at that point clarifies the various sources and loads connection characteristics, for example, a microgrid and nanogrid. Next, will be examinations of DC to DC energy conversion system which is different types are classified for input-output and direction. Ultimately the examination of DC to DC Converter is useful and will be extending nanogrid systems as an entirety. Chapter 3 presents the introduction about DC-based nanogrid. which is included PV, FC, Power grid (Pg ) as energy sources, with additional electric vechical (EV) and battery energy storage system (ESS). In addition, with the development of energy generation technology, energy storage, generation 4.
(19) backup, load characteristic the components of a smart home system are also introduced in this chapter. Chapter 4 investigates the research methodology used to lead this research. First, the necessary system is designed as required for this research. such as DC-HEMS model, PV system model, FC system model, ESS system mode land distribution system for iHouse based 4LDC system model and so on. the expected results are discussed in chapter 5. At last, the system model of DC-based nanogrid is designed which is proposed in this research. In addition, is considered protection of the DC system. Chapter 5 gives results and an investigation of the methodology that was talked about. In the methodology, the chapter contains the numerical results of the scheme to analyze the necessity of DC-HEMS, PV, FC, ESS, 4LDC and DC to DC Energy Conversion Loss just as the interconnected system. Chapter 6 is a review of the results and suggestions for future work are exhibited.. 5.
(20) Chapter 2 Literature Review 2.1. Smart Grids. Since the first electric grid was implemented in 1882, hardly any progressions have been made in perusing consumers’ electricity. A smart grid was made to help electricity distribution organizations and it so consumers adjust to the 21st century. It delivers more exact readings, which makes more proficient, solid, and secure power, and greener electric distribution locally and internationally [2]. Moreover, smart grids are characterized as one of the incredible advancements of today guiding humankind into what’s to come. It’s the capacity to control the generation and distribution of electricity places smart grids sought after. A commonplace electric grid includes the distribution of electricity on one way going from the power plants to its consumers.By joining web insight and correspondence with electric distribution arrange, a smart grid includes an extra line of correspondence which takes into account the 6.
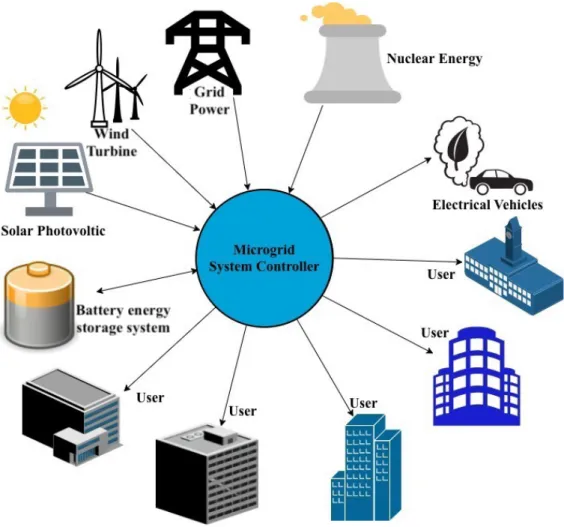
(21) execution of sun powered boards, wind energy, and others. The grid joins different instruments, for example, smart metering, censored distribution grid, and smart transmission. Fig. 2.1 displays a smart grid and the components that go into a smart grid. These devices help to additionally characterize what a smart grid is and its capacities. They additionally help coordinate and make an equalization to the renewable energy resources and their fluctuation.. Figure 2.1: Schematic of Smart Microgrid. 7.
(22) 2.2. Microgrid. At the point when micro-grids were planned, they were viewed as parts of a full scale grid [3]. However, a microgrid can work associated with a smart grid, just as work independently. This grid can be utilized as a reinforcement generator but at the same time is viewed as a component used to reduce expenses and keep on conveying different measures of power [4]. Much like a smart grid, the microgrid still uses the two path correspondence among homes and electric appropriation organizations. Additionally, these grids will still utilize ordinary incorporated energy sources. Yet, it will incorporate local consumers having a local wellspring of energy. This enables the capacity to freely oversee and circulate their power. The execution of a microgrid makes many points of interest. For instance, if a power outage happens, many consumers are left without power during this crisis, especially consumers with local energy sources that depend on the grid. A microgrid can enable consumers to receive power freely during such a crisis. The utilization of this reinforcement power is conceivable in light of the fact that the microgrid still receives energy from the local energy sources. There are numerous points of interest started from the usage of a microgrid are Enhanced a blend of scattered maintainable power source assets, a dynamically capable way for buyers to get power and control vitality scattering, Contributes to a greener area by including low or no carbon vitality sources, Cuts costs, Increases control adequacy, Provides a strong power source.. 8.
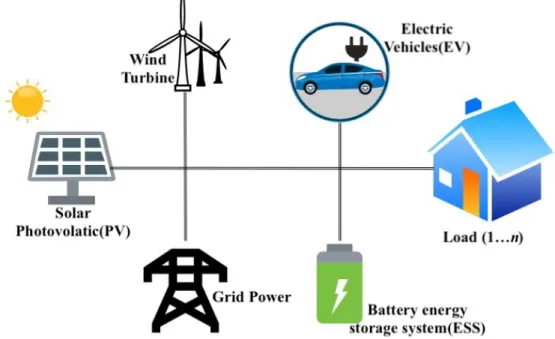
(23) 2.3. Nanogrid. At the local level, Nanogrid utilize to arbitrate between generation and consumer for improving electricity supply and demand. The integration of local generation and storage energy is simplified by Nanogrid. From local sources, Low voltage DC system is gained more efficiency. [5]. The nano lattice was. Figure 2.2: Schematic of Nanogrid made as an answer to this issue. Nanogrid is considered components of a microgrid and are likewise alluded to as little microgrids, this implies they can be interconnected to frame a bigger microgrid. Nanogrid can likewise be isolated from a small scale network and capacity freely with their own voltage, stage, and recurrence from dc to kilohertz. Interconnecting these matrices gives them the capacity to build their range and power supply. A nano framework can cover a range of under 100 meters, and furthermore. 9.
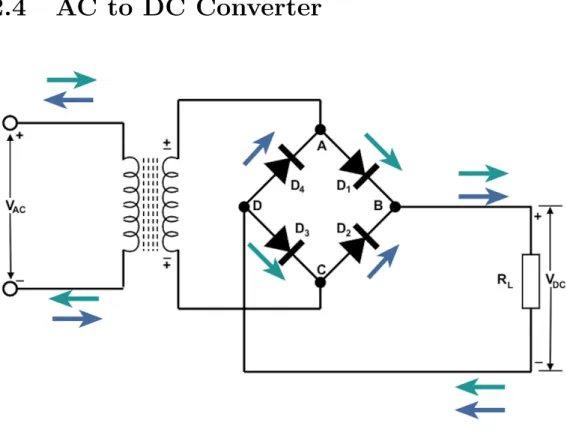
(24) power up to 50 family units. Despite the fact that it has a wide range, it’s ordinarily used to serve single buildings or loads. When attached to a microgrid, a nanogrid delivers as much as 100 kilowatts of power [2]. When associated, it delivers as much as 5 kilowatts of power.. 2.4. AC to DC Converter. Figure 2.3: Full Bridge Rectifier The simple way of working principle is a full-wave bridge rectifier. Fig. 2.3 has represented to batter understand about the operation of a bridge rectifier completely. In the circuit, 4 diodes and 1 transformer are used to implement it [6]. The bridge circuit is arranged by diodes. The first part of the transformer is connected with the input source and the second part. 10.
(25) of the transformer is connected with the diodes bridge at points A C. The points B and D of the bridge of diodes are connected with a load resistance RL .. 2.5. DC to DC Converter. The parts of the nano-lattice comprise of a controller, passage, load, and discretionary storage. The run of the mill load size is 100 watts and, on occasion can pursue under 1 watt. The controller is considered the center of authority. It controls the load just as deals with the storage. Storage can be introduced inside or through as a second nano framework. Exclusively to ease the essential nanogrid and go about as storage explicitly. Doors can be considered one way or two way, with a limit. These portals comprise two parts including correspondence and power exchange. The correspondence segment ought to be considered nonexclusive enabling it to stumble into physical layers. The power exchange is a segment that spotlights on characterizing the different measures of voltages and limits. Fig. 2.2 shows a schematic of a nanogrid and its parts. A direct current to direct current DC to DC converter is utilized in relation to power electronics or power conversion. It’s considered to be energy proficient for higher power conversion, provides a more adaptable plan, and presents a lower temperature rise in its segments. This converter works by utilizing a transistor as a switch alternating on and off. The operation of the switch changes the progression of the current, which at that point alters the voltage driving from the input to output [6]. There are numerous sorts 11.
(26) of topology while including DC to DC converters which can be broken down into two kinds: secluding, and non-segregating. A converter is considered the most widely recognized and differs from a segregated since it has an electrical barrier between the input and output. An advantage of this form of the DC to DC converter is its ease and easy to plan. Disadvantages incorporate the way that it has an electrical barrier which isn’t perfect since the majority of these converters are user open and this creates a security hazard. A disengaged converter has a transformer going about as a barrier between the input and output. Which gives the advantage of having the option to withstand high measures of voltage. Another advantage would incorporate that the output voltage can be either positive or negative. In these categories exist converters, for example, buck, help, buck-lift, and zeta just to give some examples. Each independently alternating between increasing and decreasing the output voltage of a heap. Yet, all converting one DC source to another. In practice, this converter provides 100 percent effectiveness, preferably, in any case in practice acquires between 70 percent and 95 percent productivity.. Single Input Single Output DC to DC Converter (SISO) A SISO converters are considered the most straightforward of the converters. Created for the most part straightforward applications including single burdens. Its advantages remember the capacity to concentrate exclusively for one burden which does exclude or include complex circuitry. These straightforward circuits take into account the concentration on just increasing or decreasing a voltage a respectively [7] The capacity of a buck-help converter 12.
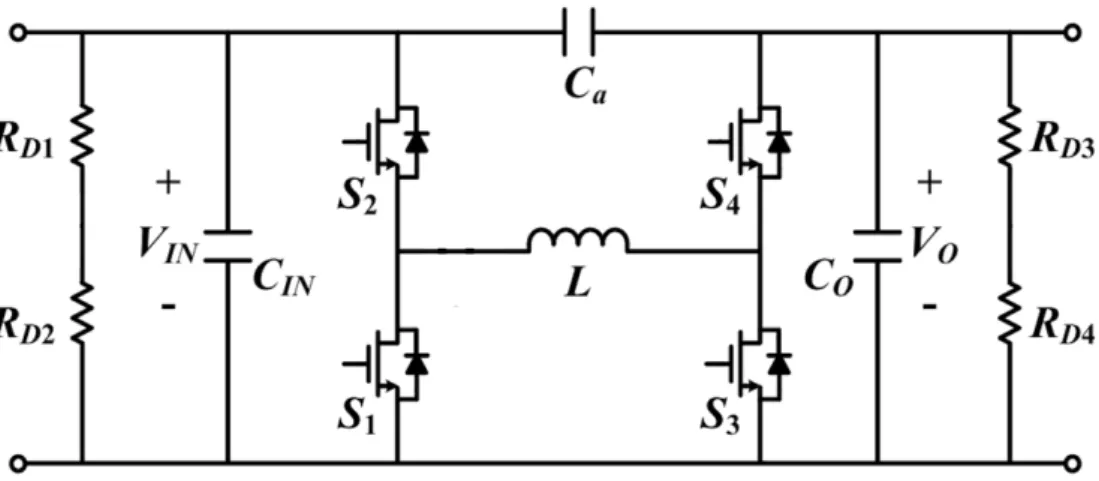
(27) is material too however requires the MOSFET to go about as a switch accordingly separating the buck or increase in the circuit. Other normal topologies for this converter explicitly incorporate the cuk, zeta and sepic as examined previously. Which additionally incorporate assigning various part of the circuit to influence the heap voltage. Fig. 2.4 shows a SISO support converter where a solitary input will be input in this way increasing the output voltage or burden.. Figure 2.4: Single Input Single Output Boost converter. Single Input Multi Output DC to DC Converter (SIMO) A SIMO converter takes a solitary input and can either lower or raise the voltage of numerous heaps. The number of outputs can vary dependent upon the number of burdens required for the application. This converter is additionally considered a staggering voltage source [8]. This present converter’s advantages incorporate the production of top notch wave forms, utilizing lower voltage ratings, just as lower exchanging misfortunes. In spite of the fact that this converter is considered one to 13.
(28) cut cost, it has a couple of disadvantages too. Given a solitary input, the staggered configuration circuity radiates unpredictability, requiring a high number of DC sources just as requiring a high number of power switches [9]. SIMO converters have various typologies including help, buck, bucksupport converters. These typologies can take a solitary input, and vary between increasing the voltage of one or more loads. Or likewise, increase, and decrease a heap simultaneously [8]. Fig. 2.5 shows a case of SIMO buck-help converter. Where load Vo1 is being increased and Vo2 is being decreased.. Figure 2.5: Single Input Multi Output Buck Boost Converter. Multi Input Single Output DC DC Converter (MISO) In many converters, the objective is to plan a converter with great input just as output. These requirements with single input are hard to reach because 14.
(29) of the reality the one input can be troublesome when endeavoring to reach proficiency [10] A converter with multi-input-single-output MISO is intended to reach productivity. By joining numerous voltage sources it increases the odds of giving an output voltage with great maintainability just as reliability [11]. Furthermore, the MISO converter includes a less number of segments, straightforward control, and lower misfortunes in the framework. This converter works proficiently with renewable energy resources consolidating solar, wind, and energy components to power a heap. These sources can deliver power respectively to the heap with no disturbing the operation of the other sources. A normal MISO appeared in Fig. 2.6 shows 2 inputs being delivered into a heap and converted into one single output [12]. In spite of the fact that. Figure 2.6: General form of multi input single output converter this converter can work at the same time, it likewise can enable a solitary 15.
(30) input to work in the circuit. However, doing so decreases the proficiency of the circuit. The general topology of this circuit is utilized to support a certain voltage subsequently the input much varies between being both higher and lower than the necessary output voltage or burden. In spite of the fact that it likewise can join numerous measures of low voltage to consolidate for one high voltage. Multi Input Multi Output DC to DC Converter (MIMO) MIMO converters are considered before anything financially savvy. Compared to a SISO a MIMO is a better decision being that it wouldn’t need to interface with a DC transport system [13]. Other advantages of this circuit incorporate fewer segments, higher power thickness, and area of centralized control. Much of the time MIMO is considered an augmentation of (SISO) which includes the rearranging and brushing of parts to give the result of a solitary complex circuit. As expected to numerous measures of basic single circuits. This converter much like the MISO consolidates various power. Figure 2.7: Multi Input Multi Output Buck Boost Converter sources and gives an output. In spite of the fact that the output for this 16.
(31) converter differs. It takes the input and sends them to a different individual burden, in this way giving each heap its own voltage. This perplexing converter can likewise twofold and triple the ratio of inputs to outputs [14]. In Fig. 2.7 a MIMO buck-support converter is shown demonstrating two inputs and three outputs. The last output voltage reads Voutn, which is shown to demonstrate a MIMO’s capacity to power an unbounded measure of burdens dependent upon the inputs.. Bidirectional DC to DC Buck Boost Converter (BDCDC) This converter is constrained by pulse width modulation (PWM) signals (S1 S4 ) which are created by the voltage-mode control. Two voltages (VI N and VO ) are detected to actualize the voltage-mode control and secure the over voltage. VO is utilized as a yield voltage for producing the PWM control sign of the primary switch in the vitality move course from VI N to VO and VI N is utilized as a yield voltage the other way. The current of inductor is detected to secure against over current. Another BDCDC was proposed [15]. The proposed converter viably had lower yield current wave than the regular other converter, which was accomplished by giving a detour way to the yield current. The decreased yield current wave empowered lower yield voltage swell and higher force change productivity contrasted with the traditional converter. This converter had the greatest productivity of 98% at VI N = 160 V, VO = 80 320 V, PO = 16 160 W. These outcomes show that the proposed converter is reasonable for PV, EV and ESS in a keen lattice, which requires a BDCDC with high productivity and low wages in the yield voltage and current [16]. 17.
(32) Figure 2.8: Bidirectional DC to DC Buck Boost Converter. 18.
(33) Chapter 3 DC-Based Nanogrid 3.1. Intoduction. A nanogrid is a half and half framework which contains a blend of sustainable and non-inexhaustible age. Power hardware is the empowering innovation of this framework, being utilized to interface the two sources and loads to the transmission organize. This section shows the nanogrid idea in more detail, starting with a portrayal of the structure of the framework. Specialty applications for the framework are featured on the grounds that in the flow power showcase, little inexhaustible based frameworks are not cost-focused with the regular air conditioning framework. The qualities of the sources and loads present in the nanogrid are likewise clarified since these effect the decision of working recurrence and control topology [17].. 19.
(34) 3.2. DC-Based Nannogrid Structure. The structure of a nanogrid is appeared in Fig. 3.1. The essential structure squares of a nanogrid are control electronic interface converters. Venture up converters permit voltage sources to supply capacity to the nanogrid, and venture down converters enable the heaps to draw control from the nanogrid. Bidirectional converters enable stockpiling hubs to charge from and release into the nanogrid [18]. Beside the interface converters, a nanogrid includes. Figure 3.1: Structure of DC-based nanogrid. inexhaustible sources, stockpiling, non-sustainable reinforcement age, loads, and a transmission arrange. Variable inexhaustible sources supply the normal burden request, and since the pinnacle yield of these sources is unequipped for being controlled, vitality stockpiling gadgets are incorporated into the framework to go about as a vitality cushion, adjusting contrasts between the source and burden powers. Reinforcement age might be incorporated to 20.
(35) improve the framework’s unwavering quality in case of a long haul deficiency of sustainable power source [19]. Being an appropriated framework, a nanogrid has the upsides of expanded excess and simplicity of development contrasted with an incorporated power framework. Generator disappointment in a concentrated power framework majorly affects the framework; be that as it may, in a dispersed framework, the framework isn’t totally injured by supply disappointment as extra supply hubs are as yet working. The appropriated structure of the nanogrid likewise loans itself well to particular development and simple extension. The requirement for beginning venture is therefore decreased since the framework can be made little at first, at that point extended as the heap request develops. While there is no physical limitation on the size of a nanogrid in principle, effectiveness and financial matters will to a great extent direct the size of a nanogrid by and by. For instance, expanding the size of a nanogrid by including far off burdens may improve the suitability of the nanogrid because of the economies of scale that are picked up in utilizing bigger generators. Other variable factors, for example, government sponsorships, innovative advances, and large scale manufacturing will likewise influence the financial attainability and thus size of a nanogrid. For the reasons for this proposition in any case, the size of a nanogrid that is considered is a group of 2-10 nearby loads that are situated inside 5 km of the sources. Expecting these heaps are private sort stacks, the power rating of such a framework would be roughly 2-20 kW. High voltage transmission isn’t required for an arrangement of this scale. Transmission voltages of a few hundred volts are adequate to give productive transmission of electrical vitality in a confined framework with 21.
(36) these details.. 3.3. Generation Technology. Power in the ordinary air conditioning framework will in general originate from huge hydro or warm power stations evaluated at 100 MW to 2 GW. At the core of the power station is the synchronous generator which pivots at a fixed speed to create 50/60 Hz air conditioning, and has a controllable yield control. In a nanogrid be that as it may, age is essentially founded on static sustainable sources that produce a dc yield. The pinnacle yield of the inexhaustible sources is wild because of the stochastic idea of the sustainable type of vitality. Thus, stockpiling and reinforcement age are required to keep up the power balance in the framework within the sight of the fluctuating sustainable sources.. 3.3.1. Photovoltaic Array. Photovoltaic(PV) exhibits are another potential wellspring of vitality for nanogrids. They are dependable, produce no emanations, and require insignificant upkeep. The disadvantage of sunlight based exhibits is their high starting expense. For instance, the normal expense of the PV modules in 625 private framework associated PV frameworks that were introduced in United States somewhere in the range of 1994 and 2000 was US dolor 4.20/W, [19]. Anyway expenses have been relentlessly diminishing since the commencement of this innovation because of progressing examination and large scale manufacturing. The feasibility of photovoltaic frameworks can be improved 22.
(37) by utilizing the boards as building cladding [20], since this viably lessens the introduced expense of the boards. The most extreme hypothetical productivity of a silicon sun powered cell is 25 rate; in any case, the genuine introduced effectiveness of modules ranges from 14-17 rate [19]. The most extreme power point (MPP) of a PV exhibit and its relating yield voltage are variable, being a component of the sun’s radiation and the temperature. It very well may be seen that expanding the temperature diminishes the MPP, while expanded radiation has the contrary impact. The pinnacle control accessible from a PV exhibit is variable, being exceptionally reliant on the sun’s radiation. The radiation level changes as indicated by the hour of day and the season. Power is just created during the sunlight hours, and the pinnacle power yield is around early afternoon. Throughout the winter months, the point of occurrence between the sun and the earth adequately weakens the force of the sun’s beams arriving at the exhibit. Momentary vacillations, for example, overcast spread additionally influence the yield of the exhibit.. 3.3.2. Fuel Cell. Power devices are appropriate for nanogrid applications as they give a perfect, controllable wellspring of power. The significant kinds of energy units are proton trade layer (PEMFC), direct methanol, strong oxide, phosphoric corrosive, and antacid [21]. Despite the fact that these energy units utilize various materials and types of hydrogen fuel, they all work as indicated by a. 23.
(38) similar standard. They convert hydrogen and oxygen into an electrical flow through electrochemical oxidation and decrease. The main side-effect of the response is water and warmth. In light of the working temperature of an energy unit, there are two general classes of power devices: high temperature and low temperature. High temperature energy components work at around 600 1000C and are normally utilized for bigger frameworks in the request for 200 kW. High temperature activity permits quicker response rates and allows productive age of power by utilizing the fumes gas to drive turbines Low temperature energy units work at temperatures from 50200C and are ordinarily utilized for littler frameworks up to a few kW in size since there are cost focal points in diminishing the working temperature for littler frameworks [21]. The energy components well on the way to be utilized in a nanogrid are low temperature power devices. Energy components produce a variable voltage dc yield that is subject to the working temperature and current provided by the power device. The yield voltage of a solitary energy unit is little, commonly running from 0.7 to 1.2 V as indicated by the working conditions. To create a progressively helpful yield voltage, various cells are associated in arrangement to shape a stack. The yield voltage of a normal power module stack is 22 to 41 Vdc [22]. The electrical effectiveness of a power module is around 40 rate, in spite of the fact that the productivity of the energy unit framework can be multiplied by using the fumes heat in cogeneration applications, for example, space and water warming [19]. A case of a power module unit utilized for such cogeneration applications is the 1 kW NetGen unit delivered by Ceramic Fuel 24.
(39) Cells Limited [23]. The reaction time of an energy component relies upon its development. Low temperature power devices will in general have a quick reaction, while high temperature energy components utilized for baseload applications will in general react all the more gradually [21], [24], [25], [26], [27], [28], [29].. 3.4. Energy Storage. Building a nanogrid dependent on inexhaustible sources alone is laden with trouble as the sustainable sources must be estimated to such an extent that their base yield is equipped for providing the pinnacle burden request. Since this goal is expensive to accomplish, the inexhaustible sources are measured to such an extent that their normal yield can supply the normal burden request, and capacity is incorporated into the framework to cushion the contrasts among market interest. The consideration of capacity improves the use of the sustainable power sources [30]. The capacity gadget goes about as a vitality cradle, putting away abundance sustainable power source during times of overabundance, and discharging the vitality when the heap surpasses the power accessible from the inexhaustible sources. Vitality stockpiling frameworks can be given utilizing a scope of advances are Supercapacitors,Flywheel,Superconducting magnetic energy storage, Batteries (old and new technologies) These types of capacity normally produce a variable voltage dc yield, and power electronic converters are required to permit bidirectional power stream between the capacity gadget and the framework. Another type of capacity that is deserving of notice in this segment is 25.
(40) optional space warming or water siphoning. If an overabundance of intensity from the sustainable sources exists in the framework and the customary stockpiling hubs are completely energized, the abundance power can be taken care of to use as such to expand utilization of the inexhaustible sources. Capacity can be delegated present moment or long haul. Transient stockpiling has a full power time span in the request for seconds to minutes, while long haul stockpiling can give capacity to the framework from hours to days. All things considered, a nanogrid will include a blend of both short and long haul stockpiling. Momentary stockpiling will be utilized to make up for transient marvels, for example, engine beginning and the impacts of wind choppiness, while long haul stockpiling will be utilized to smooth changes in the yield of the inexhaustible age. Anyway there is a point of confinement to the measure of each type of capacity that can be incorporated into the framework before the advantages it gives are exceeded by the gradual expense of expanding the size of the capacity. For instance, the expense of capacity per kW-hr for most normally utilized battery advances increments fundamentally when the bank is estimated to give over ten hours of save [30]. To give reinforcement to time spans longer than this, reinforcement age is regularly increasingly conservative.. 3.5. Generation Backup. Despite the fact that it is conceivable to give a ceaseless stockpile of intensity in an inexhaustible based framework with the expansion of capacity alone, including reinforcement age diminishes the long term stockpiling prerequi26.
(41) sites in the framework. The capacity bank doesn’t need to be estimated to adapt for the most pessimistic scenario calm in sustainable power source. It has likewise been demonstrated that the consideration of reinforcement age in sustainable based frameworks improves the inventory dependability [31]. Albeit inexhaustible sources have a lower working cost, alone they can not give a satisfactory degree of dependability because of their stochastic nature. The most well-known type of reinforcement age is the diesel generator. Most reinforcement diesel generators work at a fixed speed to enable the alternator to be straightforwardly associated with the 50/60 Hz control framework. Anyway at low loads, fixed-speed generators are compelled to work outside their ideal fuel utilization envelope. Consequently, makers of diesel generators commonly stipulate a base stacking of 40 percent to guarantee monetary activity and anticipate ignition related upkeep issues [31]. Be that as it may, working the motor at a variable speed and utilizing power hardware to interface the generator to the framework can permit progressively proficient activity of the diesel generator [31]. Variable-speed activity enables the generator to keep running at its most productive working point as the heap and encompassing temperature change. It is likewise important that like energy components, reinforcement generators may fill in as consolidated warmth and power (CHP) generators in an offer to expand their general productivity. A case of a diesel generator that has been explicitly intended for a CHP application is the Stirling motor based generator delivered by Whisper Tech, which has a general proficiency of up to 90 percent [27]. Such units are obviously appropriate for use in a nanogrid since the age of warmth is frequently dealt with by power, an 27.
(42) important product in a little sustainable based framework.. 3.5.1. Load Characteristics. Not exclusively do the sustainable sources in a nanogrid vary, yet the heaps are likewise factor in nature. Fig. 3.1 shows the heap attributes of an ordinary private burden in a country area in New Zealand during the long stretch of May.1 The momentary burden request, inspected at five-minute interims, changes fundamentally, and has a pinnacle of about multiple times the normal burden request. There are advantages to be picked up in consolidating loads, as appeared by the total burden request of three private loads in Fig. 3.1. Contrasted and the quick burden request of an individual house, the joined prompt burden request is smoother, and the heap factor, the proportion of top to average burden request, is somewhat littler. The heaps present in a nanogrid display consistent power attributes since they are associated with the framework utilizing power electronic burden interface converters. The yield intensity of each heap interface converter is steady because of guideline of the yield voltage, subsequently the power drawn by the heap interface converter from the framework is additionally consistent. This consistent power trademark causes the heap interface converters to go about as a negative information impedance on the framework as appeared in Fig. 3.1. With the heap interface converter working at point An, its ostensible info voltage is Vi and its ostensible current is Ii. The consistent state input. 28.
(43) impedance of the converter is in this manner positive. At the point when the information voltage diminishes with the end goal that the framework works at point B, the info current increments so as to keep the heap control consistent. Hence it very well may be seen that the little sign impedance of the heap interface converter, V/ I, is negative.. 29.
(44) Chapter 4 DC Nanogrid Model The idea of DC-based nanogrid operation expresses up new scope for fancy conceptual, software and hardware options for the energy management system. The impact of the DC system creates a big change for energy generation, distribution and storage devices. However, the software and hardware experiment noticed the performance and influence of nanogrid [32]. The ideas are a challenging issue. It is underneath exclusive normal and failure which demands precise research infrastructure however at equal time promises to attain precious effects inside the energy management system. Even, mathematical modeling based totally on software simulations affords cost high quality and environment-friendly results, physical modeling with real electricity hardware remains a dependable approach for lookup studies and testing.. 30.
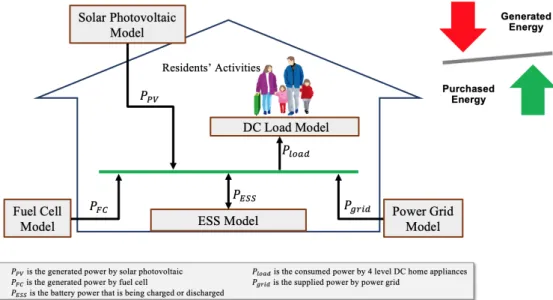
(45) 4.1. System Model of DC-HEMS. The objective of DC-HEMS system mode is designed for reducing the consumption of the power grid regardless of residential activities inside the house by using renewable power sources and minimizing power conversion loss. In this model has considered five system model which has interfaced by the 400 DC Voltage Bus. In this system are considered three types of system models. Fuel cell (FC) and Solar Photovoltaic (PV) are source types, Battery energy storage system (ESS) model is as the energy storage type. DC load model is 4LDC based consumer type. The power grid model is a source type that is used on the power demand, weather and resident’s activities. most of the time considered cut off condition.. Figure 4.1: System Model of DC-HEMS. 31.
(46) 4.2. Experimental House. In this experiment, the iHouse is utilized for DC-HEMS as showed Fig. 4.2 which is an advanced experimental environment for this research and is located in Nomi, Ishikawa, Japan. It is the best application environment because all advanced residential devices have there. In the iHouse, 300 more than sensors, home appliances and advanced electronic devices have and those are connected by ECHONET version 3.6. In this research, the experimental data are acquired from iHouse.. Figure 4.2: iHouse. 4.3 4.3.1. Energy sources Model for DC Nanogrid Solar Potovoltaic System Model. In the solar photovoltaic(PV)system, sunlight is an important fact. In this case, the conversion of solar radiation into electricity has happened by the 32.
(47) effect of sunlight. The PV panel always accepts radiation from the sunlight. The radiation is three types, direct radiation, reflected radiation and diffuse radiation Fig. 4.3. When the sunlight is direct radiation on the PV panel, it called direct radiation. At the same time, the sunlight is reflected by the ground and diffused by the cloud in the atmosphere on the PV panel. Accordingly, they are the radiation of reflection and radiation of diffusion. The power generated PV is proposed by Sandia National Laboratories [33]. and the unit of PV is Watt. The equation of PV is defined as bellow.. PP V = εRAP V µsoil (1 − εthermal (Tpanel − 25)/100)). Figure 4.3: Solar radiation towards solar photovoltaic panel. 33. (4.1).
(48) Where, the PV panel efficiency is defined by ε (not unit), the PV panel area is AP V (unit is m2 ), the soiling coefficient is µsoil , the solar irradiance 2. 1. is R (unit is Wm ), the thermal efficiency of PV panel εthermal (C ) and the temperature of PV is Tpanel . Surrounding objects affect the temperature of solar panel and the reflected radiation can fluctuate over the electricity generated from the PV. Thus, a fourth-order Butterworth low pass filter with a cutoff frequency of 50 Hz is used to filter the frequency of power produced, which is higher than 50 Hz. Therefore, it is necessary to usage the filter.. 4.3.2. Fuel Cell System Model. Fuel cell(FC) is one kind of energy source which can convert the chemical energy into heat and electrical energy at the same time. The most popular fuel cell is a solid oxide fuel cell(SOFC) and Proton exchange membrane fuel cell(PEMFC). In this case, it was considered a PEMFC for in this system because, at present, it can generate a power maximum of up to 100 kW. Anode and Cathode are two electrodes that are used to construct PEMFC [29] Hydrogen gas and air are fed incessantly to anode and cathode. The chemical reaction has occurred and heat and electricity are generated. The energy produced from FC is given by. EF C = Mgas LHV.. (4.2). EF C = Mgas LHV. where, the mass of hydrogen gas considered Mgas and unit is define kg, the low heat value(LHV) of hydrogen gas unit is kWh/kg, the. 34.
(49) heat loss of FC is considered by this equatuion.. Ploss = U AF C Tdif f. (4.3). where, the heat transfer coefficient is U for hot water tank and the unit is Wm−1 C−1 , the surface area is AF C for the how water tank and the unit is m2 and the temperature difference is Tdif f and unit is ◦ C.. Figure 4.4: PEMFC diagram 35.
(50) The charge of hot water temperature due to the heat loss is given by. 4TF C = 60Ploss /Mwate cr. (4.4). where, the water mass is Mwater (kg) and the specific water heat capacity is considered c(Wkg −1 c−1 ). Figure 4.5: Basic Fuel Cell system model The basic system model of FC is considered as illustrated in Fig. 4.5 consists of six components. It is a fuel cell, power Converter (DC to DC), heat recovery machine, power rectifier (AC to DC), hot water heating machine, what water tank. The main operation of the FC is considered on JIS C 8851 standard see Fig. 4.6, which explains the energy efficiency for resident’s activities on stationary fuel cell power systems and the estimation based on this model pattern. This model is considered to simulate the power consumption 36.
(51) 37. Figure 4.6: JIS C 8851 standard on operation process diagram of fuel cell power generation unit.
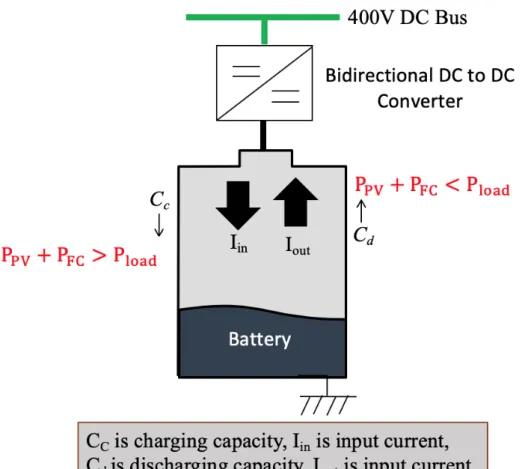
(52) of emblematic Japanese houses inclouding starting time to end time in the experimental process of measuring the yearly energy consumption. At the time of the stationary FC installation, emblematic Japanese residence is also comprised. The JSI C 8851 standard is implantation in our FC model to compute the energy and heating consumption and energy-generating hours/day that is based on Japanese residents’ activities.. 4.3.3. Battery energy storage System Model. The operation of the battery energy system(ESS) model is a system to store electric energy. It can carry a maximum efficiently model. The battery storage model is used in the ESS model which is based on the generic rechargeable battery storage model. showing Fig. 4.7 is a non-linear ESS model. The rechargeable non-linear ESS depends on the load time that can be charged and also discharged in unlimited. In this model, For one time constant, an equivalent circuit model(7) is utilized to calculate the state of charge (SOC) and discharge (SOD) of the battery. when the capacity of a battery is charging which is represented by. Cc = Cin + Closs. (4.5). Where, The capacity of actual battery input Cin (unit’s mAh) and the capacity of battery loss is Closs at the time of battery charging and discharging(unit’s mAh). similarly, the capacity of the battery is discharging is represented by Cd = Cout + Closs 38. (4.6).
(53) Figure 4.7: Generic rechargeable ESS model Since, The time of elapsed the charging and discharging are Tc and Td . So, Cin = Iin * Tc and Cout = Iout * Td respectively. the actual input current of the battery is represented by I. if Cin ≤ Copt. α(1 − ρc )Vo /Rint. if Cin > Copt. Iin = . o. 39. (4.7).
(54) Figure 4.8: Characteristic of Charging and discharging for ESS where the operating current of battery is Io (unit’s mA), arbitrary constant is α that is expressed materials and chemicals type battery(no unit), the ratio of charging is ρc (no unit), the battery operating voltage is Vo of a battery(unit is V), and the battery internal impedance is Rint (unit’s Ohm). Also, the 40.
(55) actual battery output current is represented by. Iout =. I. if Cout > Copt. α(1 − ρd )Vo /Rint. if Cout ≥ Copt. o. (4.8). where the discharge ratio is ρd (no unit). At the peak hours during, the capacity of the battery is schematized to supply the decisive load on the cloudy or rainy weather.. 4.4. Distribution System Model for iHouse. Increasing electricity demand to generate will be a rising challenge in the future. The electricity demand is increasing day by day that why it is needed to focus and generate more renewable sources and a minimum loss distribution system for future DC-Nangrid. In this approach, A power distribution system is distributed to different voltage levels by the rectifier(AC to DC), convertor(DC to DC), Inverter(DC to AC) into the power distribution system. In this case, varies types of appliances are constructed and interconnected into nanogrid. The main objectives of this energy loss reduction by the novelty power distribution system in response to maximizing electricity from a renewable source.. 4.4.1. 4 level DC System Model. In this model, we classify home appliances 4 categories based on the voltage level. Those are 400 V DC, (48-50) V DC, (24-30) V DC and (5-12) V DC. In the Implemented system, using home appliances are represented by tables 41.
(56) List A B C D E F EV ESS PV FC. Table 4.1: 400 V DC Home Appliances Generic Name Current [A] Induction Hub (LG LSE4617ST) 7 Rice Cooker (Toshiba RC18MSLW) 2.3 Conditioner (Toshiba BUOU BO-01) 6.3 Water Heater (Toshiba DSK38S5KW) 9.5 Vacuum Cleaner (LG VK53181NNTM 4 Washing Machine (LG WT1501CW) 9.5 Mini Cooper SE, 16.1 kWh) 16 Toshiba (FP01101MCB02A x 2) 11.5 Solar Panel (HIT-N225A01) 7.29 Fuel Cell(Proton Exchange Membrane) 4.17. Power [kW] 2.5 0.9 2.5 3.8 1.6 3.7 11 4.6 12.92 13.90. Table 4.2: (48-50)V DC Home Appliances List G H I J. Table 4.3: simulation parameter Generic Name Current [A] Power [kW] TV (Sony 55” class XBR-55A9G) 7.46 27.3 LED Light (Medium Edison E26/27) 7.00 70.0 CCTV Camera (AUGIENB 4C NVR) 4.00 200.0 Refrigerator (OEM DC Solar Refrigerator) 1.50 71.0. [34]. In this table, the configuration data of 400 V DC Home Appliances are gathered. The HA are given in Table The home DC-based energy distribution system shown in Fig4.11 is described as a 4 level DC home energy management system. In this system, the voltage level is defined as 400 voltage direct current, 48 to 50 voltage direct current 24 to 30 voltage direct current and 5 to 12 voltage direct current. List K L M N. Table 4.4: 24-30) V DC Home Appliances Generic Name Current [A] Power [kW] Tablet (12.9 inch iPad Pro) 0.75 20 PC (MacBook Air) x 2 units 2.00 60 Extractor Fan (SOK MOTOR DC Small) 5.20 100 Auto Electric Door, Window (CSD400) 2.00 60 42.
(57) List O P Q R S T. Table 4.5: (5-12) V DC Home Appliances Generic Name Current [A] Home Gateway (IO Data) 0.5 Router (Buffalo WSR 1166HP3 BK) 0.2 Home Security (Jikaida JKD501) 1.5 Telephone 0.8 Smart Speaker (Sony LF-S50G) 1.5 Smart Phone (iPhone 11) x 2 units 3.0. Power [kW] 2.50 8.19 4.50 5.00 18.00 23.34. Bus according to various home appliances. Basically, this system is considered over voltage protection, energy conversion loss different voltage level in the home energy distribution system and is serviced the best optimization scheme for DC-based home.. 3-Level Model. Source: Home DC Distribution System. [Available] https://ggpah.org. AC/DC. Pgrid. DC/DC 300-400V. Distribution Board. AC Loads. DC/DC 48-50V. DC Sources and Loads (GS, HHA). DC Loads (FHA). Figure 4.9: 3 Level DC System Model. 43. 12-30V. DC Loads (PHA).
(58) My Proposed Idea. 4-Level Model AC/DC 300-400V. Distribution Board. Pgrid. DC/DC. AC Loads. AC Bus DC Bus. DC Sources and Loads (GS, HHA). DC/DC 48-50V. DC Loads (FHA). GS = Category of Energy Generation and Storage HHA = Category of High Power Home Appliances. DC/DC 24-30V. DC Loads (PHA). 5-12V. DC Loads (PHA). FHA = Category of Fixed Home Appliances without Battery PHA = Category of Portable Home Appliances with Battery. Figure 4.10: 4 Level DC System Model In this Fig. 4.11 is shown the Alternative Current and Direct current home appliances separately. 400 voltage DC Bus has connected with home appliances (high Power types) directly but Electic Vehicle(EV)is used DC to DC converter, energy storage device(ESS) by a bi-directional converter and generation types devices are PV FC those are connected by DC to DC Converter. Specifically, this bus is a high voltage DC Bus (HVDC-Bus). This bus can be covered DC to DC and AC to DC and DC to AC to power existing devices with outside voltage input and inside voltage output on load distribution characteristics [35].. 4.4.2. System Model of Daily Electric Billing. In this section the Fig4.12 is shown the daily electric billing mode which is a design based on the Tokyo Electric Power Company (TEPCO) energy cost. 44.
(59) 45. CP1. 2.50 0.90 2.50 3.80 1.60 3.70 11.00 4.60 12.92 13.90. J. H. K L M N. FHA. I. IF 2. J. TV (Sony 55" Class XBR-55A9G) LED Light (Medium Edison E26/27) CCTV Camera (AUGIENB 4C NVR) Refrigerator (OEM DC Solar Refrigerator). M. PHA. L. (A). 0.75 2.00 5.20 2.00. 20 60 100 60. (W). N. O. Figure 4.11: 4 Level DC System Model Discretion. Q. R. IF 1B. T PHA. S. 0.5 2.50 0.2 8.19 1.5 4.50 0.8 5.00 1.5 18.00 3.0 23.34. Current Power (A) (W). 100V AC Bus 400V DC Bus 400V DC Bidirectional Bus 48-50V DC Bus 24-30V DC Bus 5-12V DC Bus Communication Link. Home Gateway (IO Data) Router (Buffalo WSR 1166HP3 BK) Home Security (Jikaida JKD501) Telephone Smart Speaker (Sony LF-S50G) Smart Phone (iPhone 11) x 2 units. FHA. P. C34. My Proposed Idea. 5-12V DC Bus. O P Q R S Current Power T. 7.46 27.3 7.00 70.0 4.00 200.0 1.50 71.0. Current Power (A) (W). K. IF 1A. C13. FHA = Fixed Home Appliances without Battery PHA = Portable Home Appliances with Battery. Tablet (12.9 inch iPad Pro) PC (MacBook Air) x 2 units Extractor Fan (SOK MOTOR DC Small) Auto Electric Door, Window (CSD400). 24-30V DC Bus. G H I J. 48-50V DC Bus. F. C12. DC/DC. IF = Interface GS = Energy Generation and Storage HHA = High Power Home Appliances. 7.00 2.30 6.30 9.50 4.00 9.50 16.00 11.50 7.29 4.17. Current (A). E. Power (kW). IF 3. D. HHA. C. Induction Hub (LG LSE4617ST) Rice Cooker (Toshiba RC18MSLW) Air Conditioner (Toshiba BUOU BO-01) Water Heater (Toshiba DSK38S5KW) Vacuum Cleaner (LG VK53181NNTM) Washing Machine (LG WT1501CW) Electric Car (Mini Cooper SE) Energy Storage (Toshiba FP01101MCB02A) Solar Panel (HIT-N225A01) Fuel Cell (Proton Exchange Membrane type). B. CA1. AC/DC. where AC to DC Rectifier is CA1 DC to DC Converter is C12, C13, C34, C1E, CP1, CF1. A B C D E F EV ESS PV FC. 400V DC Bus. GS. A. AC Loads. Distribution Board. CF1. Energy Meter. out. 88888 8. In. ESS PV FC EV. C1E. Pgrid. 4-Level Model.
(60) rate scheme particularly daily time-based. Fig4.12.. 10 PM. Night time 7.77 Yen/kWh Evening time 21.15 Yen/kWh. 24 Hours. 21.15 Yen/kWh Morning time. 5 PM. 8 AM. Day time 30.32 Yen/kWh. 10 AM. Figure 4.12: System Model of Daily electric billing. 4.4.3. System Model of DC-based Nanogrid. DC-based nanogrid contracted the various components inside it with many renewable energy sources and sinks. The system model architecture is showed by Fig4.13.. 46.
(61) Pgrid PV. DC/DC DC- based Home Appliances . . . ESS DC/DC. FC. House 2. House n. DC/DC House 1. 100V AC Bus (5-400V) DC Bus. Figure 4.13: System Model of DC-based Nanogrid The fundamental framework level capacities are DC voltage control, DC current control, DC Energy management. DC voltage control is battery charging from renewable sources. Current current control is multiple voltage levels of source and appliances connected by wired association switches and breakers between a voltage converter and DC Bus. Energy management controls the ESS and implements the state of charge of the batteries and discharge. DC distribution Bus has connected all sources and load current rating is defined as the current rating of Bus is equal to the sum of all sources’ current rating.. 47.
(62) Chapter 5 Numerical Simulation Results In this section, we inspect the performances of the simulation energy performance of DC to DC converter, PV system model and FC system model. Then we investigate and examine how to layout the most beneficial battery potential via maximizing. The power consumption of electricity is based at the generated of electricity sources. Sence, we can obtain directly the real solar radiation of iHouse, the simulation of the generated electricity from the PV model is compared and analyzed with the aid of the use of R-squared, which is statically outcomes of how near the simulated statistics are to the actual records. Considering an real data set has n values indicated as X1 ,...,Xn , each of the statistics is associated with the simulated n values marked as S1 ,...,Sn . R-squared is defined by (Xi , ..., Si )2. P 2. i. R =1− P (Xi , ..., X)2 i. 48. (5.1).
(63) where the means of the actual data is as bellow: n 1X X= Xi n i=1. (5.2). In this research, the configuration data of solar panels are gathered from the history data of iHouse. The parameters of PV are given in Table Table 5.1: Simulation parameters and setting Parameter Value [unit] Average room tempareture of a house 25◦ C Simulation time 24 hour Date of simulation time 17 December 2019 Mode HIT-N225A01 Panel type Monocrystalline Surface area of solar cell 1.4482 m2 Temperature Coefficient -0.336% Temperature D-coefficient 5 Celsius m2 W −1 Soiling factor 0.051% Module Efficient 0.202% Maximum voltage 43.4 voltage Open circuit voltage 53.0 voltage. In this section, the configuration data of Fuel Cell are gathered for the simulation. The parameters of FC are given in Table.. 49.
(64) Table 5.2: Simulation parameters and setting Parameter Value [unit] Simulation time 24 hour Date of simulation time 19 December 2019 Electrical efficiency 0.39 Exhaust heat recovery 0.56 Rated power 7 kW Average fuel pressure 2.5 kPa Average atmospheric pressure 101.3 kPa Average fuel temperature 25◦ C LHV 33.32 kWh/m3 Size of hot water tank 200 liters Water density 1000 kg/m3 Heat transfer coefficient 0.1 kW/m2 K Surface area of hot water tank 4.8488 m2 Storage mode temperature 35◦ C Desired temperature of hot water tank 20◦ C. In this section, the configuration data of ESS are gathered for the simulation. The parameters of ESS are given in Table. Table 5.3: Simulation parameters and setting Parameter Value [unit] Average room tempareture of a house 25◦ C Simulation time 24 hour Date of simulation time 20 December 2019 Battery usable capacity 4.6kWh Charging efficient 92% Discharging efficient 90% Max. SOC 94% Min. SOC 20% Initial SOC 21%. In this simulation Load operational schedule(LOC) has been considered by four persons(i.e., father, mother, son and daughter) in a home, the home. 50.
(65) appliances’ operational schedule based on the NHK survey with the daily schedule about the time habit of Japanese(25) which is showed Fig. ??. It also mansion time duration with loss cost electricity. In a day, the power company is divided based on cost. The functional objective of this scheme is finding the best optimization scheme with maximum power consumption and minimum power supply. The expected goal is a more efficient system, consumer satisfaction, and electricity cost reduction.. 5.1 5.1.1. Result and Discussion PV Module. Using the R -squared, the observation result of the shown in Fig. 5.2 is so close to the actual generated PV power and simulation PV power. The record R-squired value is 95.53% at the time the actual generated PV power on 17th December 2019 is compared. Throughout the year 2019, the R-squared value has more than 80% above 57.3%. Those results express that the performance of the PV system model is moderately good-fitted.. 51.
(66) 52. ESS PV FC A B C D E F G H I J K L M N O P Q R S T U. 12 AM. 3 AM 6 AM. 10 AM. Turn ON Time. 9 AM. 8 AM Morning Time. 3 AM. Turn OFF Time. 12 PM. Day Time. 5 PM. 10 PM. 6 PM. 9 PM. Evening Time. Figure 5.1: Load operational schedule (Turn ON and OFF Mode). Night Time. 12 AM. Night Time.
(67) 2,000. Photovoltaic Power Simulation iHouse, JAIST. Power [W]. 1,500. Actual generated power Simulated power. R2 = 95.53% (17th December 2019). PV panel size 1.58 m ´ 0.79 m 1,000. 500. 0 3 AM. 6 AM. 9 AM. 12 PM. 3 PM. 6 PM. 9 PM. Time [hour]. Figure 5.2: Comparison of actual power and Simulation power generated from PV. 5.1.2. PV Module for Naogrid. In this Fig. 5.3 is showed, the simulation power is generated from PV system model for Nanogrid. In this section, we consider the solar panel size is 11.2338 m2 and it is generated power from 6 AM to until 6 PM based the weather condition. In this time duration generated total power is 60 kW.. 53.
(68) Photovoltaic Solar Power Simulation 15. 17th December 2019. Power generated by PV. PV panel size 11.2338 m2 Total Power generated by PV : 70 kW. Power [kW]. 10. 5. 0 12 AM. 2 AM. 4 AM. 7 AM. 9 AM. 12 PM. 2 PM. 4 PM. 7 PM. 9 PM. 12 AM. Time [hour]. Figure 5.3: Simulation power generated from PV for Nanogrid In this Fig. 5.4 is showed by the simulation which is generated from DC to DC energy conversion efficiency between PV and 400V DC Bus. DC Bus Interfacing Efficiency 100. PV Power. Efficiency [%]. 80. 60. 40. 20. 0 0. 2. 4. 6. 8. 10. 12. 14. Output Current [A]. Figure 5.4: Energy conversion efficiency between PV and 400V DC Bus. 54.
(69) 5.1.3. FC Module for Naogrid. In this Fig. 5.5 is represented, the simulation power is generated from FC system model for Nanogrid. In this model, Fuel Cell has implemented Proton Exchange Membrane which was constructed based on Hydrogen and oxygen utilization, fuel and air consumption. The maximum fuel flow rate is 85 lpm. At the time,2 AM to 8 AM is activated for generated power considering fuel cost duration. In this time duration generated total power is 40 kW. In this Fig. 5.5 is showed, the simulation power is generated from FC system model for Nanogrid. Fuel Cell Power Simulation 8 Power generated by FC. (17th December 2019). 7. Power [kW]. 6 Nominal Fuel Cell Stack voltage: 45 Voltage Total Power : 40 kW. The hydrogen is constant(Uf_H2 = 99.56%). 5. 4. LHV: 33.32 kWh/m3 Size of hot water tank:200 liters. 3. 2. 1. 0 1 AM. 2 AM. 3 AM. 4 AM. 6 AM. 7 AM. 8 AM. Time [hour]. Figure 5.5: Simulation power generated from FC for Nanogrid In this Fig. 5.6 is showed by the simulation which is generated from DC to DC energy conversion efficiency between FC and 400V DC Bus.. 55.
(70) FC Energy Conversion Efficiency. 100 FC Power. Efficiency [%]. 80. 60. 40. 20. 0. 0. 2. 4. 6. 8. 10. 12. 14. Output Current [A]. Figure 5.6: Energy conversion efficiency between FC and 400V DC Bus. 5.1.4. ESS characteristic for Naogrid. The charging amount of ESS depends upon the generated power sources PV and FC is showed Fig. 5.7. The total energy storage capability is about 11.5 Ah as located in the determining of ESS. This is cause of the required most ESS ability both PV and FC as strength generator. At midnight, the electricity intake via human activities is mainly consumed via initializing the operation of the FC system model. The energy intake value is ready 110 kW. The charging amount of battery is dependent on the generated strength sources. With each PV and FC, the full charging battery capability is set 11.5 Ah as observed in Fig. 5.7.. 56.
(71) 700. ESS Simulation Result 95%. 12. 600. 80%. 500. 10. 65%. 400. 8. 50%. 300. 35%. 200. 4. 20%. 100. 2. 0%. Total ESS Charging Capacity = 11.5 Ah. 6. ESS Capacity [Ah]. SOC[%]. ESS. 0. 0. 12 AM. 2 AM. 4 AM. 7 AM. 9 AM. 12 PM. 2 PM. 4 PM. 7 PM. 9 PM. 12 AM. Time [hour]. Figure 5.7: PV and FC is as like power generator for ESS. 5.1.5. Power of human activities, PV and FC for Naogrid. As shown in Fig. 5.8, the simulation power consumption by human activities is obtained and compared with the generated power from both PV system and FC system for Nanogrid.. 57.
(72) 40 Power generated by PV Power Consumption by human activities Power generated by FC. Total Power Consumption by human activities : 110 kW Total Power generated by PV : 70 kW Total Power generated by FC : 40. kW. (17th December 2019). Power [kW]. 30. LHV: 33.32 kWh/m3 Size of hot water tank:200 liters. PV panel size 11.2338 m2. 20. 10. 0 12 AM. 2 AM. 4 AM. 7 AM. 9 AM. 12 PM. 2 PM. 4 PM. 7 PM. 9 PM. 12 AM. Time [hour]. Figure 5.8: Simulated Power of human activities, PV and FC In this Fig. 5.9 is showed by the simulation which is generated from DC to DC energy conversion efficiency between (48-50)V DC and (24-30)V DC Bus [36]. 100. Energy Conversion Efficiency for Converter C13. Efficiency [%]. 80. 60. 40. 20. 0 0. 3. 6. Output Current[A]. 9. 12. Figure 5.9: Energy conversion efficiency for DC to DC Converter C13 58. 15.
(73) In this Fig. 5.10 is showed by the simulation which is generated from DC to DC energy conversion efficiency between (24-30)V DC and (5-12)V DC Bus [36]. 100. Energy Conversion Efficiency for Converter C14. Efficiency [%]. 80. 60. 40. 20. 0 0. 3. 6. Output Current[A]. 9. 12. 15. Figure 5.10: Energy conversion efficiency for DC to DC Converter C14. 5.2 5.2.1. Energy Calculation Energy loss Calculation. Energy loss happened when energy moved from one to another for the utilization of energy. This methodology we are called energy conversion. In my case, we considered energy conversion loss. In the energy management system, energy loss, Eloss is defined as. Eloss = EC able + EC onversion + ET hermal. 59. (5.3).
図

+7


関連したドキュメント
Moreover, to obtain the time-decay rate in L q norm of solutions in Theorem 1.1, we first find the Green’s matrix for the linear system using the Fourier transform and then obtain
Furthermore, computing the energy efficiency of all servers by the proposed algorithm and Hadoop MapReduce scheduling according to the objective function in our model, we will get
An easy-to-use procedure is presented for improving the ε-constraint method for computing the efficient frontier of the portfolio selection problem endowed with additional cardinality
We proposed an additive Schwarz method based on an overlapping domain decomposition for total variation minimization.. Contrary to the existing work [10], we showed that our method
In section 3 all mathematical notations are stated and global in time existence results are established in the two following cases: the confined case with sharp-diffuse
A monotone iteration scheme for traveling waves based on ordered upper and lower solutions is derived for a class of nonlocal dispersal system with delay.. Such system can be used
Merle; Global wellposedness, scattering and blow up for the energy critical, focusing, nonlinear Schr¨ odinger equation in the radial case, Invent.. Strauss; Time decay for
Specifically, using compartmental dynamical system theory, we develop energy flow mod- els possessing energy conservation, energy equipartition, temperature equipartition, and
