Japan Advanced Institute of Science and Technology
JAIST Repository
https://dspace.jaist.ac.jp/
Title A Method of Indirect Measuring of Implicit
Knowledge for Enterprises Author(s) Li, Tong; Wang, Zhongtuo Citation
Issue Date 2005-11
Type Conference Paper
Text version publisher
URL http://hdl.handle.net/10119/3920
Rights ⓒ2005 JAIST Press
Description
The original publication is available at JAIST Press http://www.jaist.ac.jp/library/jaist-press/index.html, IFSR 2005 : Proceedings of the First World Congress of the International
Federation for Systems Research : The New Roles of Systems Sciences For a Knowledge-based Society : Nov. 14-17, 2130, Kobe, Japan, Symposium 6, Session 3 : Vision of Knowledge Civilization Integrating Knowledge
A Method of Indirect Measuring of Implicit Knowledge for Enterprises
Li Tong1,2 Wang Zhongtuo1
1 Institute of Systems Engineering, Dalian University of Technology, Dalian 116024, China; [email protected]
2College of Business Administration, Dalian University, Dalian 116622, China [email protected]
Abstract: The residual value ratio method is proposed herein to measure the implicit knowledge. The implicit knowledge is the key factor of output increase ratio (Solow’s residual value) caused by general technology progress. Based on that, the method n gets the indirect measurement of the implicit knowledge’s function in enterprises. Firstly cluster analysis of the various enterprises in an industry is made according to the systematic cluster method. The Solow’s residual value of different categories of enterprises will be worked out. Then the unbiased estimation of population mean of technology progress in the residual value will be calculated. The ratio between the residual value and the estimation is the relative measurement amount of the implicit knowledge’s function in the enterprises.
Keywords: implicit knowledge, the residual value ratio method, technology progress,Solow’s residual value
1 Introduction
The economy of the world is developing rapidly with the deepening of technology and modern management continually. The global scholars have provided many kinds of theories to explain the reason for the rapid development of the economy. But some theories didn’t get the real reason for the economy development, because they limit the resources of the enterprises, the areas and the nations to the natural resources and the capital resources. OECD published the report titled ‘Economy based on Knowledge’ in 1996, which caused the wide interest of the knowledge economy research all over the world. People realized gradually that knowledge
is a type of resources and will become the key factor of promoting the economy to develop[1]. Being a kind of producing factors and a kind of capitals, knowledge not only includes the explicit knowledge that can be expressed by languages and words, but also includes the implicit knowledge that are can not be expressed and only can be understood by sense. In the research of knowledge metrology, the more research is about the measurement of the explicit knowledge. For example, the founder of the science metrology Price regarded the science literatures and journals as his research objects[2]. However there has no scientific theory system about the method of the measurement of the implicit knowledge until now.
In economics the producing factors is called the resource, which can be devoted into production to create fortunes. Being a special resource the implicit knowledge is different from the common natural resource. It is not a passive producing factor but an active one. How to combine the implicit knowledge with the economic math model in order to analyze the implicit knowledge is seldom studied by the scholars all over the world. The thinking is just like using the producing function to analyze the quantity of the capital and the labor factors to the contribution of the economic increase. Because it is so difficult to measure the quantity of the implicit knowledge, we begin with the factors that accelerate the economy increase, then analyze the meaning and applied area of the economy increase model in detail in next section.
2 the research retrospection for the factors accelerating the economy increase
There was an understanding process for the factors resulting to the economy increase. The traditional economy theories emphasize particularly to capital and labor these two factors. With the development of science and technology, the technology progress reacts more and more on the economy increase. In 1951 American economist R.M.Solow provided “Solow’s residual value method” to measure the contribution of technology progress to economy increase. Thus the factors that accelerate the economy increase become three, which are capital, labor and technology progress. In recent years knowledge plays more important roles to the economy increase as an asset with the coming of economy knowledge. Aiming at this, a method for measuring the implicit knowledge is provided herein. Thus the factors that accelerate the economy increase become four, which are capital, labor, technology progress and implicit knowledge. With the deepening of the global economy integration, all kinds of resources can be obtained from the market easily. So in this case the implicit knowledge can determine the enterprise performance in some degree, even can be the key factor of the enterprise’s success and failure.
How to measure the function of “the implicit knowledge” is the objective of this paper.
What should be explained is that the function of the implicit knowledge should be brought into the technology progress category. The following first studies the measurable factors that can accelerate the economy increase, then finds out the measurement method of the implicit knowledge.
2.1 Production function
The production function is an important concept in economics. It is also the foundation of measuring the
technology progress quantificationally with the model method. What is called the production function is a technology relationship, which is used to indicate the maximal output caused by the combination of a certain number of the input (production factor)---the definition from American economist P.A.Samuelsen. There are some forms of the production function. Among them the most famous one is Cobb-Douglas function, which is called C-D production function for short. Its form is as follows
Y=AKαLβ (α+β=1)
Because the C-D production function is confined with “invariableness of the technology level”, J.Tinbergen improved it greatly in 1942. He changed the constant A to a variable A t that is changed with time. That is
Y=A t KαLβ
On above, A t represents the technology level of a certain period. α+β=1 shows that when the capital and the labor add n times, the output also add n times, which is called “scale returns fixing” in economics. Meanwhile α+β<1 is called “scale returns diminishing”, and that α+β>1 is called “scale returns increasing”.
2.2 Solow’s Residual Value Method
It is not comprehensive for Cobb-Douglas production function to ascribe the reason of economy increase to two factors: capital and labor. So the research on other influencing factors is an important work. Among that the technology progress is a factor that can not be ignored. What Solow’s Residual Value Method mainly studies is how the function of the technology progress expressed in the increase models.
When R.M.Solow deduced Solow’s Residual Value Method, he assumed the input and the output of the factors in the units satisfied the production function above, and the output charactered with “maximal output”. The units were participated to measure the function of the technology progress.
R.M. also assumed that the technology progress is the neutral one defined by J.R.Hicks. The production function can be expressed as the following given formula.
Y=A(t)F(K, L) =A t KαLβ (2-1)
In the formula multiplier A(t) represents the technology level.
Then the marginal output of the capital is β α αK L t A K Y K MP = ( ) −1 ∂ ∂ = (2-2) The marginal output of the labor MPL is
1 ) ( − = ∂ ∂ = At βKαLβ K Y L MP (2-3) Assume during that period the total increased output of the unit is A L L MP K K MP Y = ⋅Δ + ⋅Δ +Δ Δ
In the formula above, L L MP K K
MP ⋅Δ + ⋅Δ is the increase of the output caused by the increase of the input;
A
Δ
is the increase of the output caused by the technology progress.After deducing, we get
Define Y K K Y ∂ ∂ =
α is the output elasticity of the capital,
Y L L Y ∂ ∂ =
β
is the output elasticity of the labor.(2-4) is called the increasing speed equation. The left is the relative increasing speed of the output. The first item of the right is the relative increasing speed of the technology progress. The second item is the product of the parameter α and the relative increasing speed of the capital. The third item is the product of the parameter β and the relative increasing speed of the labor.
To simplify (2-4), let Then (2-4) changes to
l
k
a
y
=
+
α
+
β
Ora
=
y
−
(
α
k
+
β
l
)
(2-5)The meaning of (2-5) is: the output increase is brought from the increase of production element capital and labor input, and technology progress. Because y、k、l can be got from the analysis of the history resources, the relatively increasing speed of the technology progress a can be worked out as a “residual value” by calculation after estimating the parameter α and β. The name of “residual value” comes from it.
3 “The Residual Value Ratio Method” to Measure the Implicit Knowledge Indirectly of Enterprises
According to the analysis and the recall above, we know that the factors accelerating economy increase mainly focus on capital, labor and technology progress. It behinds the theory that the implicit knowledge causes the economy increase in this paper.
According to the Residual Value Ratio Method, the output increase is y=a+αk+βl, in which the residual value
a includes all output increase factors besides the capital
and the labor generally. So the residual value a should be comprehended as the increasing speed of the relative general technology progress. In industry economic times, the capital, the labor and the technology progress could represent the main reasons of economic increasing basically. But with the knowledge economic coming, it will become more and more unrealistic and unscientific
) 4 2 ( − + + = L dt dL K dt dK Y dt dA Y dt dY β α Y dt dA a L dt dL l K dt dK k Y dt dY y = , = , = , =
if we still look a as “all the output increase factors besides the capital and the labor”. The reason is that the function of the implicit knowledge has become the important factor after the capital, the labor and the technology progress. That is, the residual value a is no longer to include the technology progress only, but is the combination of the technology progress and the contribution of the output from the implicit knowledge. Thus, how to express the contribution from the implicit knowledge in enterprises indirectly is the key theme of this paper.
3.1 The Systematic Cluster of Enterprises
The systematic cluster of enterprises is based upon the thinking as follows. Even in the same industry, the function of the technology progress and the implicit knowledge to the output is different on the whole structure in the enterprises with different characters. So first we should select some key indexes in order to cluster the enterprises with different characters in the same industry. Then we confirm the sorts and levels. The functions of the implicit knowledge may show themselves in different distributions among the enterprise colonies of different levels.
According to the cluster objectives in this paper, if we make the cluster analysis to n enterprises in an industry, we should select the cluster indexes as follows and set up the data matrix as Table 4-1.
3.2 The Output Elasticity Estimate of the Capital and Labor (Non-linear Regression Analysis)
The capital output elasticity α and the labor output elasticity β satisfy
Y=A(t)KαLβ
After processing the output Yi, the capital input Ki and the
labor input Li (calculate the lg value), we get the
following data in Table 3-1.
Table 3-1 Data after processing
No Y’(lgY) K’(lgK) L’(lgL) Enterprise 1 Enterprise 2 M Enterprise n Y1’ Y2’ M Yn’ K1’ K2’ M Kn’ L1’ L2’ M Ln’
We use the duality linear progression analysis method to find the solution of the matrix.
In the matrix
3.3 The Residual Value Ratio Method
After the cluster analysis of n enterprises in an industry in section 3.1, assume there are j clusters and n1,n2,…,
nj enterprises for each cluster. Firstly we calculate the capital output elasticity αj and the labor output elasticity
βj for each enterprise cluster according to the method in
section 3.2, then we work out each residual value by using “the residual value method” respectively. That is
aj=yj-αjkj-βjlj ⎥ ⎥ ⎥ ⎥ ⎥ ⎥ ⎥ ⎥ ⎦ ⎤ ⎢ ⎢ ⎢ ⎢ ⎢ ⎢ ⎢ ⎢ ⎣ ⎡ =
∑
∑
∑
∑
∑
∑
∑
∑
= = = = = = = = n i i i n i i n i i n i i n i i n i i n i i n i i L K L Li L K K K L K n A 1 2 1 1 1 1 2 1 1 1 ' ' ' ' ' ' ' ' ' ' M M M ⎥ ⎥ ⎥ ⎥ ⎥ ⎥ ⎥ ⎦ ⎤ ⎢ ⎢ ⎢ ⎢ ⎢ ⎢ ⎢ ⎣ ⎡ =∑
∑
∑
= = = n i i i n i i i n i i L Y K Y Y B 1 1 1 ' ' ' ' ' B A A b 1 ' − = ⎥ ⎥ ⎥ ⎦ ⎤ ⎢ ⎢ ⎢ ⎣ ⎡ = β αAssume the population mean of the contribution ratio of the output increase caused by the technology progress isμj in jth enterprise, the expected value of the mean a
j in njth enterprise is j j n j n j n j j j n j a j n j E j n j n j j a E j n j n j j a j n E j a E jμ μ μ = = ∑ = = ∑ = = ⎟ ⎟ ⎟ ⎠ ⎞ ⎜ ⎜ ⎜ ⎝ ⎛ ∑ = = ⎟ ⎟ ⎟ ⎠ ⎞ ⎜ ⎜ ⎜ ⎝ ⎛ ∑ = = 1 1 1 ) 1( 1 1 1 1 1 ) (
So the estimation value ∑ = = j n j aj j n j a 1 1 is the
unbiased estimation of the output increase ratio caused by the technology progress. When the sample is large enough, the estimation value is the standard value of the output increase contribution ratio caused by the technology progress in jth enterprise. The “residual value” aj of each enterprise fluctuates around the
standard value. Though the reasons for the fluctuation are complex, in this paper we are sure the implicit knowledge plays an important role among them. This is mainly because the explicit knowledge such as the production equipments, the operation regulations, the technique patents and management pattern can be obtained easily from the international market with the deepening of the global economy integration. This makes the function of the technology progress in the same industry converges to
a
j
gradually. But this whole convergence tendency can not eliminate the fluctuation because the same resource can not play the same role in different enterprises, which has the similar mechanism of “the shadow price” in Operation Research. So there are only the implicit knowledge and other random factors left besides capital, labor and technology progress (including the explicit knowledge) etc. We believe the main reason must be the implicit knowledge in this paper,which causes aj fluctuating around
a
j
.We select
γ
to be the measurement for weighing the implicit knowledge indirectly. That is) 1 3 ( % 100 1 1 % 100 × − ∑ = = × = j n j j a j n j a j a j a γ
In (3-1),
γ
≥
0
. The ratioγ
can measure the function of the implicit knowledge in the enterprises.4 Calculation Example
According to the main financial indexes of the USA large scale companies in 1999, which were promulgated on April 17th, 2000 on the journal FORTUNE, we choose 11 companies from the electric and machine industries to analyze according to the index design of the cluster analysis of enterprises. The relative data provided is shown in Table 4-1.
The 11 companies in Table 4-1 place in the competition within 50th of the largest companies in USA in 1999. Meanwhile they are all in electric and machine industry. So we omit the process of the cluster analysis in the calculation example, estimate the capital output elasticity α and the labor output elasticity β directly. The relative data are in Table 4-2. We don’t list the company names because the capital increasing ratio k is the estimated value.
Using the nonlinear multi-regression analysis, we get the data as follows
α=0.2346, β=0.4097
We work out the Solow residual value
a=y-αk-βl
We can work out ai(i=1,2,…,11)for 11 companies
respectively. From the result we can see a8 has great difference with the other 10 calculating results. So we analyze a8 as the special data. Taking out No. 8th company, the result for redesign is as follows.
α=0.2757,β=0.3437
a1=3. 57% a2=3.28% a3=2. 73% a4=34.14%
a5=1.59% a6=13.86% a7=12.95% a8=—
a9=2.52% a10=2.03% a11=6.98%
The result above is the output increasing ratio caused by technology progress (broad sense). Because the output differs from different company, what we should do is to work out the proportion of the technology progress (broad sense) function for the total increase in companies.
y
i
a
i
a
′
=
In the formula, y is the output increase ratio. The data are shown in Table 4-2. After calculating we get the result as follows.
1
a′ =32.45%
a′
2 =46.86%a′
3 =17.06%4
a′
=47.42%a′
5 =53.00%a′
6 =57.75%7
a′
=47.96%a′
9 =50.40%a′
10 =40.60%11
a′ =58.17%
Thus the standard ratio is as the followings, which reflect technology progress function among the total increase in this sort of the company.
) 11 9 7 1 ( 10 1 ∑ = + ∑ = = ′ i ai i ai a =45.16%
We can obtain the
γ
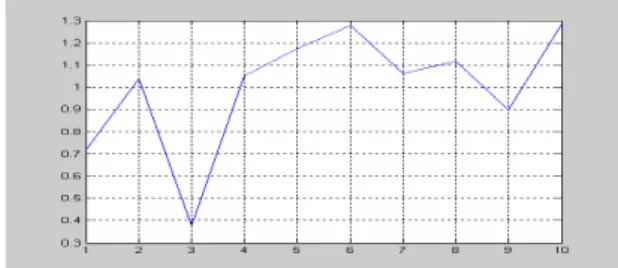
respectively for each company by using the comparatively measurement method in formula (3-1). 1 γ =71.86% γ =103.76% 2 γ =37.78% 3 4 γ =105.00% γ =117.36% 5 γ =127.88% 6 7 γ =106.20% γ =111.60% 9 γ =89.90% 10 11 γ =128.81%The fluctuation curve of the
γ
for each company is shown in Figure 4-1.The implicit knowledge is a dynamic concept. So we can solve the problem of measuring the implicit knowledge dynamically with the indirect measurement method. Because of the different samples, the fluctuation of the output contribution ratio from the implicit knowledge can be considered as follows. In a certain industry, the implicit knowledge can make the contribution of the output weaken or strengthen that is caused by the technology progress, thus the technology progress will
Figure 4-1 The fluctuation curve of the comparative
measurement value γ for the implicit
make below or above the output contributions than the essential one. From the calculation result, we can see this method proves that the measure precision of the implicit knowledge has strong relativity with the stability of the technology progress in a certain age. So we believe the
method proposed herein can be applied in a certain range.
Table 4-1 The relative financial indexes of part electric and machine industry in USA during 1999 Company Names Total Assets (dollars in hundred million) Income (dollars in hundred million) Income Profit Rate (%) Total Invest Benefit Rate (%) Employee Number (ten thousands)
1.General Electric Company
2.IBM Company
3.AT&T Company
4.SBC Communication Company
5.HP Company
6.COMPAK Computer Company
7.Lucent Technologies Company
8.MCI World Communication Company
9. Bell Atlantic Company
10. Motorola Company 11.Intel Company 3573.33 856.67 1715.00 816.00 349.00 285.00 397.50 1002.50 600.00 410.00 430.00 1116 875 624 495 483 385 383 371 332 309 294 10 9 5 16 7 1 12 11 13 3 25 54 18 — -7 68 -35 37 11 17 143 39 34.0 30.7 14.8 20.5 8.4 7.6 15.3 7.7 14.5 12.1 7.0
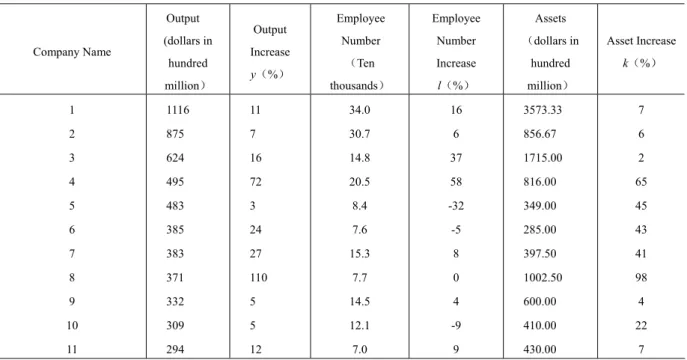
Table 4-2 Data about capital, labor output elasticity and the residual value estimation Company Name Output (dollars in hundred million) Output Increase y(%) Employee Number (Ten thousands) Employee Number Increase l(%) Assets (dollars in hundred million) Asset Increase k(%) 1 2 3 4 5 6 7 8 9 10 11 1116 875 624 495 483 385 383 371 332 309 294 11 7 16 72 3 24 27 110 5 5 12 34.0 30.7 14.8 20.5 8.4 7.6 15.3 7.7 14.5 12.1 7.0 16 6 37 58 -32 -5 8 0 4 -9 9 3573.33 856.67 1715.00 816.00 349.00 285.00 397.50 1002.50 600.00 410.00 430.00 7 6 2 65 45 43 41 98 4 22 7 5 Conclusion
If the contribution of the output caused by the technology progress is looked as the objective result of the technology development during a certain period, the function of the implicit knowledge is similar to an uncertain result like “the Shadow Price” in the company. But both the two consist the majority of the contribution besides the capital and the labor. That is, they compose the main body of the contribution caused by broad sense technology progress. A new “residual value ratio method” is tested in this paper, which tries to indicate indirectly the implicit knowledge’s function by the ratio form from the output increase contribution caused by broad sense technology progress. Thereby a new research method for the implicit knowledge measuring is provided
herein.
REFERENCES
[1] Wang Zhongtuo. Knowledge System Engineering. Science Press. 2004, 2:1-2
[2] Liu Zeyuan,Liu Fengchao. On the Methodology of Knowmetrics Study. 46th International System Science Conference. 2002, 6
[3] Yang Kaifeng. Knowledge Management. China People's University Press. 2004,9: 9-10
[4] Wang Zhongtuo. The Discussion on some issues of Knowledge Management. Management Journal. 2004, 1(1):18-24
[5] Roberts.Pindyck. Microeconomics. Beijing: China Renmin University Press, 1997