TUMSAT-OACIS Repository - Tokyo University of Marine Science and Technology (東京海洋大学)
第一部 海鷹丸航海調査報告 平成19年度(2007年度)
Survey Report Survey report of The
Collaborative East Antarctic Marine Census
(CEAMARC) for the Census of Antarctic Marine
Life (CAML)
journal or
publication title
航海調査報告
volume
17
page range
120-168
year
2009-03-27
URL
http://id.nii.ac.jp/1342/00000326/
4.5 Survey Report
4.5.2 Survey report of The Collaborative East Antarctic Marine Census (CEAMARC) for the Census of Antarctic Marine Life (CAML)(Leg.2)
The Collaborative East Antarctic Marine Census (CEAMARC) for the Census of Antarctic Marine Life (CAML)
Dr Graham Hosie, CEAMARC Leader1) & Prof. Takashi Ishimaru2), Voyage Leader
1) Department of the Environment, Water, Heritage and the Arts, Australian Government Antarctic Division, 203 Channel Highway, Kingston, Tasmania 7050, Australia [email protected]
2) Tokyo University of Marine Science and Technology, 4-5-7 Konan, Minato-ku, Tokyo 108-8477, Japan. [email protected]
Abstract
The Census for Antarctic Marine Life (CAML, IPY Project 53) is investigating the distribution and abundance of Antarctic marine biodiversity and how it will be affected by climate change. It is a major ship-based research programme mainly in the austral summer of 2007-2008 involving scientists from 30 countries and 14 vessels. CEAMARC is the Australian, French and Japanese contribution to CAML involving ships, scientists and students from all three nations, as well as representatives from Belgium, Argentian/Spain, Canada/USA. This collaboration is a highly coordinated and comprehensive survey of the plankton, fish, benthos and oceanography of the waters north of Terre Adélie and George V Land of Eastern Antarctica. CEAMARC aims to provide a robust benchmark of the marine
-biota of East Antarctica against which the effects of future change can be measured. It seeks to understand the processes that have lead to the evolution and survival of the current biota may respond to future change.
Introduction
The Census of Antarctic Marine Life (CAML, IPY Project 53) is the lead marine biodiversity project for IPY in the Antarctic. It is also a major project for SCAR (Scientific Committee on Antarctic Research) and is sponsored by the Alfred P Sloan Foundation. CAML is studying the evolution of life in Antarctic waters to determine how this has influenced the diversity of the present biota and to use these observations to predict how it might respond to future change. It is a five year project with the main research activity during the International Polar Year (IPY) in the austral summer 2007-08 and some voyages in 2008-09 (www.caml.aq). It is investigating the distribution and abundance of Antarctica’s marine biodiversity, how it is affected by climate change, and how change will alter the nature of the ecosystem services currently provided by the Southern Ocean for the benefit of humankind, e.g. food, biological products, atmospheric carbon absorption, bio-climate feedback though dimethyl sulphide production. CAML aims to show what is known, unknown and probably unknowable about the Southern Ocean. The project will integrate knowledge across all regions, biomes, habitats and fields of study to strengthen our knowledge of ecosystem dynamics in this high latitude, ocean system, and only through a multi-scale level of investigation will a better understanding of the diversity and status of Antarctica’s marine life be obtained. CAML will be potentially the largest survey of the Antarctic marine biodiversity ever conducted. Scientists from about 30 countries and 50 institutions on 14 research vessels will conduct various surveys around Antarctica in support of CAML, either as individual national projects or through consortia of nations. The largest and most comprehensive of these is the multi-national and multi-ship CEAMARC survey.
-CEAMARC
CEAMARC involved three ships from Australia (RSV Aurora Australis), France (l’Astrolabe) and Japan (TS Umitaka Maru) studying the plankton, fish, benthos and oceanography of the waters north of Terre Adélie and George V Land, the CEAMARC Survey area. This is a region where all collaborators have previously conducted research. The area corresponds with Area C of Japanese Antarctic Research Expedition Studies on the Antarctic Ocean and Global Environment (STAGE) program. Australia and Japan worked together in a 4 ship time-series study of the sea-ice ecology of this area in 2001/02. France and Belgium have conducted inshore studies of the plankton, fish and larvae in the coastal waters north and to the east of their station Dumont d’Urville. The survey area has been identified by these nations as a region that has been poorly studied compared to the Atlantic and Indian Ocean (Prydz Bay region) sectors, yet offers some of the best conditions to study the effects of sea ice dynamics on the biota of the region, and flow on effects through the pelagic food web and to the benthos. CEAMARC provided an opportunity to combine the resources of Australia, France and Japan to conduct a more coordinated and comprehensive survey of the region using ships, scientists and students from each nation, and supported by scientists from Belgium, Argentina/Spain and Canada/Alaska for the Umitaka Maru cruise. CEAMARC aimed to provide a robust benchmark for tracking future change in the Antarctic marine environment. The CEAMARC survey are is expected to be one of the legacy CAML survey areas for future research and monitoring. The Aurora Australis survey focused mainly on the benthic, demersal sampling, plus a physical-chemical oceanographic survey in December 2007 to January 2008. L’Astrolabe conducted an inshore plankton and oceanographic survey in January 2008. Umitaka Maru conducted a comprehensive survey of the epi-, meso- and bathypelagic zones in February 2008 on and north of the continental shelf.
The voyage comprised numerous individual projects looking at phytoplankton and primary
-production, zooplankton, krill and fish, water chemistry and physical oceanography. Various traditional plankton nets and midwater trawl nets were used, as well as a visual plankton recorder, electronic equipment for measuring the optical properties of the water and primary production, a suite of hydrocoustics to survey krill, and CTD-bottle casts. Mesozooplankton, gelatinous zooplankton, and the meso- and bathypelagic plankton and fish fauna were target groups in CEAMARC as they have not been as well studied as krill and plankton in the epipelagic zone. A continuous plankton recorder (CPR) was towed on route to and from the survey area in support of the SCAR Southern Ocean CPR Survey. This report is a compilation of individual reports from each project group attached as appendices. Each report describes the basic purpose of each project, the activities conducted and preliminary results if available.
List of Reports and Lead Authors • Continuous Plankton Recorder – Kunio Takahashi • Copepod – WP2 Net – Jean-Henri Hecq
• CTD Oceanography Report – Daisuke Hirano • Fish – IYGPT net – Philippe Koubbi
• Gelatinous Zooplankton – Dhugal Lindsay • Krill – Hydroacoustics – Kazuo Amakasu • Optical systems – Toru Hirawake
• Phytoplankton Community and Primary Production – Naho Horimoto • Visual Plankton Recorder – Dhugal Lindsay
• Zooplankton – Multinet and Barcoding Report – Russ Hopcroft • Zooplankton – Norpac Net – Yuko Watanabe
• Zooplankton and Fish Larvae – RMT 1+8M – Masato Moteki
-• Zooplankton metabolism – Salp Net – Atsushi Ono • l’Astrolabe report – for reference – Anne Goffart
Sampling Schedule
TS Umitaka Maru departed Fremantle at 0900 local time (GMT + 9) on 23 January 2008. The first CPR tow commenced on 25 January at 0129Z at position 42° 47.7’S 121° 05.3’E. Four tows were completed on route, finishing just before the first CEAMARC sampling site a 61° 59.3'S 139° 59.4'E at 1948Z on 28 January (0548 LT 29 January). Three stations S6, S7 and S* were also sampled on route during the change over of the CPR recording mechanisms. This provided an opportunity to test equipment and conduct CTD casts. CEAMARC sample commenced at Station UM14 at 0601 LT (GMT +10) on 29 January. The last station UM08 was completed at 2158 LT on 12 February. During the CEAMARC Survey 24 stations were sampled. In summary the following activities were achieved in the CEAMARC Area and on route:
• 47 International Young Gadoid Pelagic Trawl (IYGPT) trawls
• 35 hauls with the multiple Rectangular Midwater Trawl (RMT 1+8M) net producing 82 net samples each from the RMT 1 nets and RMT 8 nets
• 26 Norpac net casts • 26 WP2 net casts • 20 salp net casts • 9 multinet deployments
• 1 Ocean Research Institute (ORI) net
• 35 conductivity-temperature-depth (CTD) casts with sampling bottles • 11 Visual Plankton Recorder (VPR) deployments
-• 19 absorption and attenuation (ac-s) meter casts • 22 Fast Repetition Rate Fluorometer (FRRF) casts • 12 Profiling Radiometer (PRR-800) casts
• 10 Volume Scattering Function (VSF) meter casts
We made a visit to Dumont d’Urville, 5 to 6 February, to conduct a cold water calibration of the ship’s hydroacoustic sounders. Despite the weather and difficulty in setting a secure anchor, the calibrations were successful.
The CPR was towed again on route from the CEAMARC Survey area to Hobart commencing at 2222 LT on 12 February at 65° 26.1’S 142° 59.4’E. Four tows were completed on the return route, the last tow finishing at1929 LT (GMT + 11) 16 February at 44° 44.7’S 147° 19.8’E, giving eight tows for this leg of Umitaka Maru. Leg 1 of Umitaka Maru (Cape Town-Syowa-Fremantle) produced another 10 tows.
Significant Results and Achievements
Typically the shelf break represented a marked change in assemblages. The inshore region was dominated by Pleuragramma fish, the ice krill Euphausia crystallorophias generally dominated over the Antarctic krill E. superba, and phytoplankton were more abundant inshore, especially along the 66° 20’S transect. This was evident in both the net samples and satellite imagery. The larvae of ice fish were the next most abundant on the shelf particularly in depressions on the shelf and the Adelie Basin. The smaller copepods such as Oithona,
Ctenocalanus, Microcalanus and Oncaea were more abundant than the more conspicuous and
well studied bigger copepods, i.e Rhincalanus gigas, Calanoides acutus, Calanus propinquus and Metridia gerlachei. The biomass of the smaller copepods probably equal that of the larger copepods. Antarctic krill were most abundant along the shelf edge, especially in the
-sill linking the Adelie Basin and the shelf slope. Stations in this area had notably higher abundances and diversity of plankton and fish and warrants further attention.
North of the shelf edge, the dominant fish group was myctophids in the surface to 500m zone. Deeper at 1000m, bathylagid fish typically dominated. Gelatinous zooplankton, including very large medusae of several kilos dominated the zooplankton biomass. Several new distribution records were made for a number of species, and there is a reasonable expectation that some of these may be undescribed. Past survey records need to be compared in detail, but the preliminary assessment is that the medusae are more abundant than previous surveys.
One thing particularly noticeable in this survey was the almost complete absence of any salps Salpa thompsoni. Previous voyages in this region by Australia and Japan in 1996 and 2002, have shown very high numbers of salps in the area and few krill. The opposite was observed during CEAMARC.
Data
The data collected during CEAMARC will be shared by all participants. Copies of the data will be stored in Australia, France and Japan. Initially, the main data location for CEAMARC will be the Australian Antarctic Data Centre (AADC) where the data and results will be collated and then copied to Japan and France. All participants are encouraged to use this facility to exchange data, notes, logbooks, results and manuscripts. Eventually, all data collected during CAML and CEAMARC will be made available through the SCAR Marine Biodiversity Information Network (SCAR-MarBIN), another IPY initiative. SCAR-MarBIN provides a single, easy access point to marine biodiversity. It compiles and manages existing and new information on Antarctic marine biodiversity by coordinating, supporting, completing and optimizing database networking. The network is also linked to larger
-biodiversity initiatives such as Ocean Biogeographical Information System (OBIS, www.iobis.org) - the information component of the Census of Marine Life (CoML, www.coml.org). Details are at www.scarmarbin.be.
Acknowledgements
Everyone involved with this cruise is congratulated for their participation and contribution to the voyage. The officers, crew and researchers worked very well together to carry out the safe execution of the research programme. Special thanks go to the graduate students and the cadets who played an extremely important role in assisting the senior researchers with their work, as well as attending to their own work and studies. arigatou gozaimasu.
-Appendices - Individual Project Reports
CONTINUOUS PLANKTON RECORDER (CPR) SURVEY
Kunio T. Takahashi (AAD, JSPS Research Fellow) & Graham W. Hosie (AAD)
The Southern Ocean Continuous Plankton Recorder (SO-CPR) Survey commenced in 1991 with the purposes of mapping the spatial and temporal variation in zooplankton patterns, and then to use the sensitivity of plankton to environmental change as early warning indicators of the health of the Southern Ocean. The CPR survey provided finer scale resolution in spatial expansion compared with the net samplings, and has demonstrated clear changes in zooplankton patterns in relation to the various fronts across the Indian sector of the Southern Ocean.
Collaborative marine biological studies in the Indian Sector of the Antarctic Ocean will be conducted during IPY on board the RTV Umitaka Maru of the Tokyo University of Marine Science and Technology (TUMSAT). Investigations area were also conducted in 2002/03 and 2004/05 austral summer. Therefore, inter-annual variations of micro/meso-zooplankton distribution will be compared with previous results. We will focus on the dynamics of micro- and mesozooplankton, such as the small cyclopoid copepod Oithona spp., foraminiferans and larvaceans.
-Sampling
Eight CPR tows were successively conducted southward (#1-4), and northward (#5-8) cruise (Table 1). Fifth and seventh CPR tows were interrupted for the purpose of the work in the deck. The CPR was towed at 10m depth and towing speed was between 10 to 17 knots. After sampling, zooplankton samples retained between silk gauzes were preserved in a 10% v/v buffered formalin solution.
CPR Date Time Date Time
Run # (GMT) (GMT) Latitude Longitude (GMT) (GMT) Latitude Longitude 1 25-Jan-2008 01:29 42-47.7'S 121-05.3'E 25-Jan-2008 23:56 47-54.4'S 125-22.5'E 2 26-Jan-2008 00:02 47-54.4'S 125-22.5'E 26-Jan-2008 23:28 53-08.0'S 130-08.5'E 3 27-Jan-2008 00:49 53-08.4'S 130-10.8'E 27-Jan-2008 22:58 57-56.7'S 135-07.6'E 4 28-Jan-2008 00:23 57-57.1'S 135-10.3'E 28-Jan-2008 19:48 61-59.3'S 139-59.4'E 5a 12-Feb-2008 12:22 65-26.1'S 142-59.4'E 12-Feb-2008 22:59 62-47.4'S 143-33.7'E 5b 13-Feb-2008 00:18 62-47.7'S 143-35.1'E 13-Feb-2008 09:32 60-31.2'S 144-14.9'E 6 13-Feb-2008 09:37 60-31.1'S 144-15.1'E 14-Feb-2008 09:31 55-01.7'S 145-18.9'E 7a 14-Feb-2008 09:38 55-01.4'S 145-19.1'E 15-Feb-2008 02:36 51-03.1'S 146-10.4'E 7b 15-Feb-2008 03:33 51-03.1'S 146-10.5'E 15-Feb-2008 08:59 49-43.9'S 146-29.7'E 8 15-Feb-2008 09:06 49-43.5'S 146-30.0'E 16-Feb-2008 08:29 44-44.7'S 147-19.8'E Table 1. Details of CPR tows conducted on Umitaka-Maru in January to February 2008.
Position
Start End
Position
-COPEPODS – WP2 NET
Determination of planktonic Copepods key- species and assemblages of the East Antarctic Shelf and Slope , their spatial distribution and links with the habitats during CEAMARC Cruise.
Jean-Henri Hecq ([email protected]) Oceanology, University of Liege, Belgium
State of the Art: The role of small copepods in the pelagic ecosystem of the East Antarctic Shelf
Previous plankton investigations in the Ross Sea and East Antarctic shelf have emphasized the fair diversity of Copepods but a large variety of assemblages, linked to the multiple habitats imposed by shelf and Ice.
Concerning the small copepods, it is suggested that they can have an important impact on the community structure in most parts of the Southern Ocean . Mass specific ingestion rates, for instance of Oncaea curvata were found to be 10 times higher than those of large
calanoids in the Southern Ocean. The cosmopolitan genus Oithona is the smallest and most ubiquitous exerting high grazing pressure on primary production during the summer season. Its feeding apparatus indicates that it selects food items in the microplankton range, although its small size will set an upper limit to the particles it can handle and the frustules it can crack and therefore excludes feeding on larger diatoms . Although Oithona feeds on a wide range of particles, it prefers small nanoplankton or dinoflagellates and ciliates, but they have been shown to also feed on fecal pellets of larger copepods . The intense feeding on phytoplankton, detrital material and metazoan feces by small copepod species within the euphotic zone
might result in high turnover of material and thus retard vertical flux from the mixed layer
-and contribute to the recycling nutrient system. Since larger diatoms, such as Thalassiothrix and Corethron, but also chain-forming diatoms as Pseudo-nitzschia, are not effected by the grazing of these small copepods, but can use the recycled nutrients, their activities may indirectly support the build up of the large phytoplankton blooms dominated by large diatoms .
In addition small copepods are a major food source for top pelagic predators such as carnivorous macrozooplankton, and dominant ichtyoplankton species : Pleuragramma antarctica.
Therefore small copepods are suggested to be an important component in the above mentioned retention community of the Southern Ocean and might also be a key element in the transfer of organic matter (i.e. energy) from the regenerating pelagic community to the higher trophic food levels.
Objectives
The specific objectives of the research are (i) data collection and data banking to determine the distribution of East Antarctic mesozooplankton key-species in relation to the biotic and abiotic factors of the environment; (ii) analysis of the pelagic diversity at the species and assemblages levels; (iii) development and application of a conceptual and numerical ecohydrodynamical model to the Antarctic Shelf Pelagic Ecosystem in view of determining the stability of biotic assemblages, their sensitivity to environmental constraints and
especially the response to climate changes.
-Mesozooplankton sampling
A twin WP2 net (Working Party 2., Fraser, 1966), with mesh size 200 µm and 600 mm diameter (260 cm length) was used to collect meso-zooplankton. Double vertical hauls from 200 m or close to the seafloor for shallower waters were taken from 26 stations. A flowmeter (Hydrobios) at the entrance of the net allowed the filtered volume of water to be calculated. The first net was used to select living organisms for bar-coding, photography and
identification (Dugal Lindsay, Veronica Fuentes, Margaret Lindsay and Russ Hopcroft). The rest of the sample was fixed in alcohol 75% for ulterior stable isotope analyses (Eric
Tavernier).
The second net sample have been used for fixation in 5% formalin in filtered sea water buffered with sodium tetra borate at sea water pH, for ulterior copepod species sorting, counting and measuring. On board, a binocular was used to have a preliminary look on the samples. In the laboratory, samples will be split with a Folsom Splitter in the laboratory so that at least 1000 animals will be counted per sample. Animals will be identified, counted and measured to the lowest taxon possible and, in the case of most copepods, to sex and stage. Copepod nauplii could not be identified to species and were pooled as cyclopoid or calanoid nauplii. The other groups will be identified to the lowest level and counted. Data banking and elaboration of a reference collection will realised. A GIS method will be used for mapping the data (Philippe Koubbi). An ordination method, Redundancy Analysis (RDA), will be used to assess the influence of environmental factors on the distribution of zooplankton
(Collaboration with Ishimaru collaborators). A 1D coupled physical biological model will be used to simulate the dynamics of copepods key-species.
In the aim to determine the vertical distribution, the copepods of 40 Multinet samples, collected on 7 stations (See Russ Hopkroft) have been preserved in formaline 5% for further species identifications and counting in the laboratory.
-Preliminary observations
During the cruise 26 stations have been sampled from open ocean to the Antarctic shelf. Preliminary observations on WP2 samples, have mainly identified the medium sized to large, biomass dominant copepod species, e.g. Calanoides acutus, Calanus simillimus, Rhincalanus
gigas , Metridia gerlachei and Calanus propinquus with a maximum in the shelf brake
stations. However, in the Antarctic Shelf stations, appendicularians (Fritillaria sp.) and smaller copepods such as Oithona similis, Oithona glacialis, Ctenocalanus, Microcalanus
pygmaeus and Oncaea are undoubtedly more abundant than their larger counterparts, and
their population biomass is suggested to equal that of large calanoids.
Large quantities of the appendicularian Fritillaria sp. were observed on the shelf at the level of Dumont D'Urville and Pleuragramma antarcticum larvae occurred in the Mertz glacier. Euphausia suberba were generally absent in the shelf samples and replaced by
Euphausia crystallarophias .
A large zonal concentration gradient with lower abundances in the warmest and coldest water to the north and south respectively, increasing across Southern Ocean towards the vicinity of the Antarctic Shelf where maximum numbers seem to be recurrent in comparison of previous cruises.
-Temporary list of encounterd taxa Calanoides acutus, Calanus simillimus, Rhincalanus gigas , Metridia gerlachei, Calanus propinquus, Stephos longipes, Oithona similis, Oithona glacialis, Ctenocalanus, Microcalanus pygmaeus, Oncaea curvata, Euphausia crystallarophias, Limacina helecina, Clione sp. Fritillaria borealis,
Pleuragramma antarcticum (larva)
Ostracods, Annelids Echinoderm larvae Hydromedusae, Siphonophora, Salpa thompsoni 134
-CTD REPORT
Daisuke Hirano
Tokyo University of Marine Science and Technology
In order to clarify the water mass structure and the strength of turbulent mixing near the boundary associated with Antarctic Bottom Water (AABW) formation, we carried out hydrographic observations off Adelie Land by the TR/V Umitaka-Maru of Tokyo University of Marine Science and Technology. Temperature and salinity were measured by using the conductivity-temperature-depth profilers (CTDs; Sea-Bird Electronics SBE911plus). Accuracies of temperature and conductivity are 1.0×10⁻³ degrees and 3.0×10⁻⁴ Sm-1 (2.0×10⁻³ psu in terms of salinity), respectively. Salinity of water sample was measured for calibration of conductivity (salinity) by using a Guidline AUTOSAL. Ocean current velocity was measured by using Lowered Acoustic Doppler Current Profiler (LADCP, 300kHz), produced by RD instruments, placed in the frame of CTD.
Note
Salinity and DO data will be revised after this cruise. DO data after Sta.29 (Sta.13, 12, 10, 09 and 08) may not be available (even if DO data is calibrated) because DO sensor could not work well.
-FISH – IYGPT NET
Preliminary report on the Fish samples taken by IYGPT onboard the R/V « Umitaka Maru » in January-February 2008.
Philippe Koubbi1, Masato Moteki2, Patrice Pruvost3, Eric Tavernier4 , Andrea Walters5 and Graham Hosie6
1 Laboratoire d’Océanographie de Villefranche. Université Paris VI. UMR CNRS 7093. Station Zoologique. La Darse. BP 28. 06230 Villefranche sur mer – France. [email protected]
2 Faculty of Marine Science, Tokyo University of Marine Science and Technology. 4-5-7, Konan, Minato-ku, Tokyo, 108-8477 - Japan. [email protected]
3 Muséum national d’histoire naturelle. Collection d'ichtyologie CP26 – MNHN. 43, rue Cuvier. 75231 Paris cedex 05 – France. [email protected]
4 IUT Calais - Boulogne - Dpt Génie biologique. Quai Masset - Bassin Napoléon. BP 120. 62327 Boulogne-sur-mer – France. [email protected]
5 Antarctic Wildlife Research Unit. School of Zoology. University of Tasmania. Private Bag 05. Hobart, Tasmania 7001 - Australia. [email protected]
6 Department of the Environment, Water, Heritage and the Arts, Australian Government Antarctic Division, 203 Channel Highway, Kingston, Tasmania 7050 -Australia.
-The first aim of the fish samples taken by IYGPT is to estimate the species diversity from offshore to the coastal zone, including banks and innershelf depression such as the Adelie depression near the Mertz Glacier Tongue where Antarctic Bottom Waters are observed. Mesopelagic and bathypelagic fish assemblages will be compared with previous surveys of the R/V “Umitaka Maru” and “Aurora Australis” even if IYGPT was not used previously in these surveys.
The second aim is to gather all possible informations on Pleuragramma antarcticum, its ecology, development and survival conditions and to compare it with data obtained with the R/V “Astrolabe” in January 2008 and from previous researches held by the ICOTA programme (Ichtyologie côtière en Terre Adélie) from IPEV from 2003 to 2008.
The final aim is to generate habitat models which will take into accounts presence-absence of species in relation with environmental parameters (in-situ hydrology but also remote sensing datas). These models can be input into the bioregionalisation programme of CCAMLR.
Material and Methods
Gear
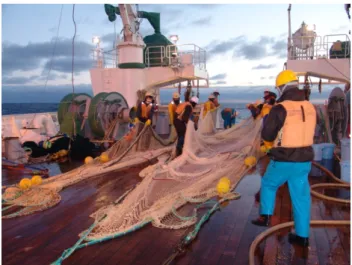
International Young Gadoid Pelagic Trawl IYGPT net (Figure 1) is a midwater trawl net designed to catch young cod. The IYGPT we used was from the Australian Antarctic Division. It has also proved useful for sampling Antarctic fish that live in the pelagic zone such as the Antarctic Silverfish Pleuragramma antarcticum and myctophids. The IYGPT net has an approximate mouth dimensions of 5.5m high x 12m wide when fishing, with mesh of 100mm in the front, then tapering through 80mm-40mm-20mm to 10mm mesh in the cod end. The unit effort is 20 minutes at each standard depth (50, 200, 500 and 1000 metres).
-Figure 1: IYGPT
Stations
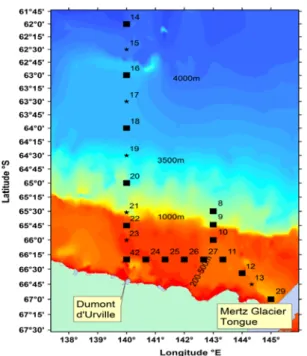
The final sampling network is made of three transects, two are along longitudes 140°E and 143°E and one is longitudinal from 140°E to the Mertz glacier Tongue (Figure 2).
-IYGPT was used on 16 stations at different depths (50, 200, 500 and 1000 metres). 46 trawling operations were achieved in total (Table 2).
Tables 2: depths of sampling of IYGPT
Stations/ Depth 50 m 200 m 500 m 1000 m 8 1 1 9 1 1 1 1 10 1 1 1 11 1 1 1 12 1 1 1 13 14 1 1 1 1 15 16 1 1 1 1 17 18 1 1 1 1 19 20 1 1 1 1 21 22 1 1 23 24 1 1 25 1 1 26 1 1 27 1 1 29 1 1 1 1 42 1 1 Total 15 15 10 7 139
-Figure 2: positions of IYGPT samples (square).
Samplings
During the survey, all fish were sorted and counted except for few trawling operations when time was limited and species abundant. Figures in Table 3 gives an approximation of specimens which were kept for each type of study. Meanwhile, Fish will all be sorted and identified at the species level when returning to the laboratory at Villefranche-sur-mer. Some specimens were given to Masato Moteki (some larvae and Bathylagidae) to study them at the Australian Antarctic Division and TUMSAT.
After identification and measurements on fish, fish preserved in formalin will be separated into different collections for the Museum national d’histoire naturelle in Paris, the Natural History Museum in Hobart, TUMSAT, the Laboratoire d’Océanographie de Villefranche and some will be given at the Musée Océanographique of Monaco.
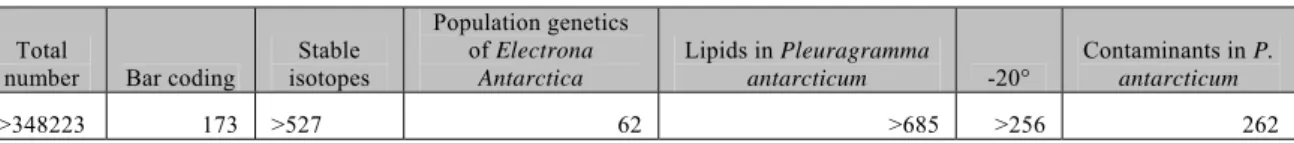
-Some specimens of Pleuragramma antarcticum and larvae of different species will be used to study their diet contents, their condition or accumulation of contaminants. Samples were also done on various species for barcoding and stable isotopes analysis.
Table 3: number of specimens Total
number Bar coding
Stable isotopes Population genetics of Electrona Antarctica Lipids in Pleuragramma antarcticum -20° Contaminants in P. antarcticum >348223 173 >527 62 >685 >256 262 Preliminary results
Preliminary list of species collected in IYGPT
IYGPT worked perfectly for collecting fish from juveniles to adults. Larvae were also caught but even if they are sometimes abundant in this net, the evaluation of abundances of young Pleuragramma antarcticum larvae should be only estimated with RMT catches because of inappropriate mesh of IYGPT for collecting larvae. However, for this report all life stages are considered in the following list (Table 4). At least 34 species were observed during the survey belonging to 17 families. The highest number of species are observed for Myctophidae. Some rare species or life stages were collected such as Anotopterus pharao,
Mancopsetta maculata and Oneirodes notius.
-Table 4: Preliminary list of species collected in January-February onboard the R/V“Umitaka Maru”
family Species
Achiropsettidae Mancopsetta maculate
Anotopteridae Anotopterus pharaoh Artedidraco sp Artedidraconidae Pogonophryne sp Bathydraco antarcticus Bathydraconidae other species
Bathylagidae Bathylagus antarcticus Chaenodraco wilsoni Chionodraco hamatus Cryodraco antarcticus Dacodraco hunter Neopagetopsis ionah Channichthyidae Pagetopsis sp Gonostomatidae Cyclothone sp
Liparidae one species
Macrouridae Cynomacrurus pirei
Melamphaidae Poromitra crassiceps
Moridae one species
Electrona antarctica Electrona paucirastra Electrona subaspera Gymnoscopelus bolini Gymnoscopelus braueri Kreffichthys anderssoni Lampanyctus achirus Protmyctophum bolini Myctophidae Protomyctophum sp
Notosudidae Scopelosaurus hamiltoni Pleuragramma antarcticum Trematomus newnesi
Nototheniidae
Trematomus spp
Oneirodidae Oneirodes notius
Paralepididae Notolepis coatsi
Zoarcidae one species
-Family diversity and spatial distribution
Because of its high dominance over the neritic zone, P. antarcticum was the most dominant species during the survey, followed by Channichthyidae (figure 3). If all life stages were observed for P. antarcticum, larval stages were mainly observed for icefish. % of icefish and P. antarcticum are underestimated in this graph as larvae has to be recounted.
The other families are meso- and bathypelagic families with mainly Myctophidae and Bathylagidae as you can expect in the oceanic zone.
Figure 3: k-dominance curve of families.
The spatial distribution of families (figure 4) show that on the neritic province, all stages of P. antarcticum and mainly larvae of other species of Notothenioids are dominant such as Channichthyidae, Trematomus spp, Artedidraconidae and Bathydraconidae. However, Channichthyidae show an interesting pattern with significant presence in innershelf depressions like in the Adelie depression and sometimes out of the shelf over canyons of the continental shelf break. The fish assemblage over the oceanic zone is very different showing that the diversity and presence are more important in deeper layers than at surface. We confirm that the Adelie bank is the preferred habitat of P. antarcticum, life stages segregation seems to occur and we observed evidence of the importance of bank slopes on this species ecology.
-Myctophidae are dominant from surface to 500 m whereas Bathylagidae become significant in samples in 1000m which confirms the vertical distribution of this family. Finally, two stations needs more attention, there are stations 9 and 10 which are located on the sill of the Adelie depression. There the diversity and abundances were quite high.
Mixing the Fish data with euphausiids, jellyfish and other macrozooplankton species, will be relevant to see if they co-occur at same stations or depths. For larvae, cross-analysis with mesozooplankton data will help us to identify the prey presence in the area.
50m
200m
500m
1000m
Artedidraconidae Bathydraconidae Bathylagidae Channichthyidae Macrouridae Melamphaidae Myctophidae Nototheniidae ParalepididaeFigure 4: Proportions of the main families observed during the CEAMARC survey onboard R/V “ Umitaka Maru”.
-Further analysis
Species / Families Analysis Researcher Institution
Standard
measurements and life stages
Philippe Koubbi LOV
Larvae diet contents Carole Vallet LOG –IUFM Nord pas
de Calais, Univ. Artois.
Lipids: condition index and trophic markers
Eric Tavernier and Patrick Mayzaud
ULCO and LOV
Ontogeny Masato Moteki TUMSAT
Contaminants (Hg and PCB)
Philippe Koubbi and Ifremer
LOV
Ifremer Toulon and Nantes
Stable isotopes Eric Tavernier ULCO
Pleuragramma antarcticum
Otoliths Philippe Koubbi and
Ifremer
LOV and
Ifremer Boulogne sur mer
Standard measurements
Masato Moteki TUMSAT
Ontogeny Masato Moteki TUMSAT
Stable isotopes Philippe Koubbi LOV
Bathylagidae
Bar coding Guillaume Lecointre MNHN
Standard
measurements and life stages identification
Patrice Pruvost and Philippe Koubbi
MNHN LOV Stable isotopes Philippe Koubbi and
Andrea Walters
LOV UTAS
Ontogeny Masato Moteki TUMSAT
Bar coding Guillaume Lecointre MNHN
Myctophidae
Population genetics of
Electrona antarctica
Anton Vandeputte Univ. Leuven
Standard
measurements and life stages identification
Philippe Koubbi and Patrice Pruvost
LOV and MNHN
Stable isotopes Philippe Koubbi LOV
Other families
Bar coding Guillaume Lecointre MNHN
Squids Identification, bar
coding and stable isotopes
Andrea Walters UTAS
Identification and standard measurements
Masato Moteki TUMSAT
Euphausiids
Stable isotopes Andrea Walters UTAS
Other plankton Identification Masato Moteki TUMSAT
Fish database Patrice Pruvost MNHN
Fish collection Patrice Pruvost MNHN
GIS Philippe Koubbi LOV
-GELATINOUS ZOOPLANKTON - Dhugal Lindsay, Veronica Fuentes, Russ Hopcroft
-KRILL – HYDROACOUSTICS Acoustic Observation
Kazuo Amakasu and Tomoki Ogawa
Tokyo University of Marine Science and Technology
1. Observation using scientific echosounder 1.1 Overview
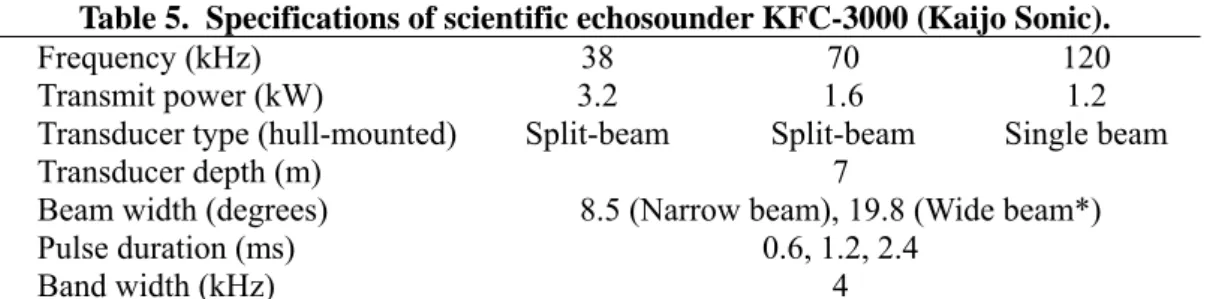
Acoustic observation using a scientific echo sounder was conducted to estimate the density of Antarctic krill (Euphausia superba). The scientific echosounder used was a KFC-3000 (Kaijo Sonic) installed on the Umitaka Maru. The specifications were shown in Table 5. Raw acoustic data for each ping and frequency from 0 to 300 m were recorded. The pulse duration of 0.6 ms was transmitted at all frequencies and the ping interval was 1.2 seconds. Ship’s speed between stations was a constant speed of 10 knots. When the vessel departed for next station, noise measurements were performed for three minutes (0.5 n.mi.) after ship’s speed reached 10 knots.
In situ target strength measurements of krill were performed during some net tows. Raw acoustic data from 0 to 50 m were recorded. The pulse duration of 0.6 ms was transmitted at all frequencies and the ping interval was 0.2 seconds.
Table 5. Specifications of scientific echosounder KFC-3000 (Kaijo Sonic).
Frequency (kHz) 38 70 120
Transmit power (kW) 3.2 1.6 1.2
Transducer type (hull-mounted) Split-beam Split-beam Single beam
Transducer depth (m) 7
Beam width (degrees) 8.5 (Narrow beam), 19.8 (Wide beam*)
Pulse duration (ms) 0.6, 1.2, 2.4
Band width (kHz) 4
* Acoustic pulses are transmitted by narrow beam and received by wide beam (except for 120 kHz).
1.2 System calibration
System calibrations were performed at all frequencies using the 38.1 mm WC standard sphere. The
-results of calibration were shown in Table 6.
Table 6. Results of calibration
Date 07-February-2008 Location 66o 39.20’ S, 140o 00.70’ E
(off Dumont d’Urville French base)
Water depth (m) 36
Sound speed (m/s) 1444.6
Frequency (kHz) 38 70 120
Table 2 (continued) Target strength of sphere −42.0 −40.5 −39.9
Sphere depth (m) 27.7 Absorption coefficient (dB/km) 10.1 17.4 25.2 Pulse duration (ms) 0.6 Narrow 58.4 59.6 40.7 TR factor (dB)* Wide** 59.0 61.2 - Narrow −19.1
Equiv. beam width (dB)
Wide** −17.1 −17.1 -
* TR factor is the sum of source level, receiving sensitivity, and gain for the system. ** Acoustic pulses are transmitted by narrow beam and received by wide beam.
2. Observation using multi-frequency acoustic system
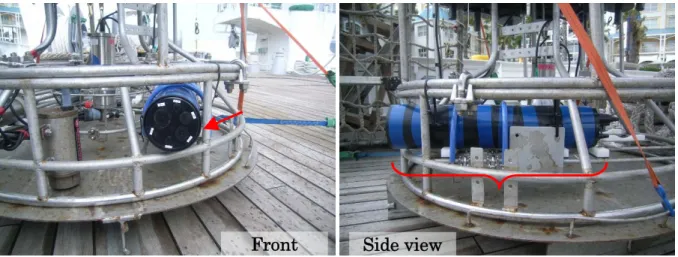
Acoustic observation using a multi-frequency acoustic system (265, 420, 700, 1100, 1850, 3000 kHz) was conducted to estimate size-abundance spectra of small zooplankton. The system was horizontally mounted on CTD frame (Fig. 5) and the observation was vertically performed from surface to 200 m at ten stations.
Fig. 5. Multi-frequency acoustic system mounted on CTD frame.
Front
Side view
-Optical systems
Cruise Report on Optics
Participating organizations:
Graduate School of Fisheries Sciences, Hokkaido University (HU) Tokyo University of Marine Science and Technology (TUMSAT) Personnel:
Toru Hirawake Associate professor, HU Naho Horimoto Research associate, TUMSAT Shunsuke Oki Graduate student, TUMSAT Naoki Kondo Graduate student, HU Contact person :
Toru Hirawake Telephone/Fax: 81-138-40-8844、e-mail: [email protected]
Objectives:
The objectives during this cruise was to collect data of optical properties, spectral radiation, and primary productivity of phytoplankton for optical modeling and algorithm development to detect phytoplankton group and primary productivity in the Southern Ocean using satellite ocean color data such as the MODIS and SeaWiFS.
Summary of Operation:
Spectral radiation (Spectroradiometer, PRR-800/810, Biospherical) Light scattering (Volume scattering function meter, VSF3P, WETLabs) Light absorption (Spectral absorption and attenuation meter, ac-s, WETLabs) Aerosol optical thickness, AOT (Sunphotometer MICROTOPS II, SOLAR Light) Light flux density (Quanta meter, LI-1400, LiCor)
-Samples collected:
Chlorophyll a concentration (Chla, fluorometry)
Size fractionated pigments concentration (HPLC, after going back to Japan) Absorption coefficients of particulate matter (QFT)
Absorption coefficients of colored dissolved organic matter (CDOM)
Primary productivity (PP, simulated in-situ method, incubated for 24 hours using 13C)
Summary of cruise: (Table 7)
We were able to carry out measurements at almost all of planed stations. See pages of 'Phytoplankton' in this volume for the details of primary productivity and chlorophyll a measurements. At some stations, we successfully measured optical properties almost simultaneously with satellite passing under clear sky. These data are precious for validation of satellite data in the Southern Ocean and further progress of estimation accuracy is expected.
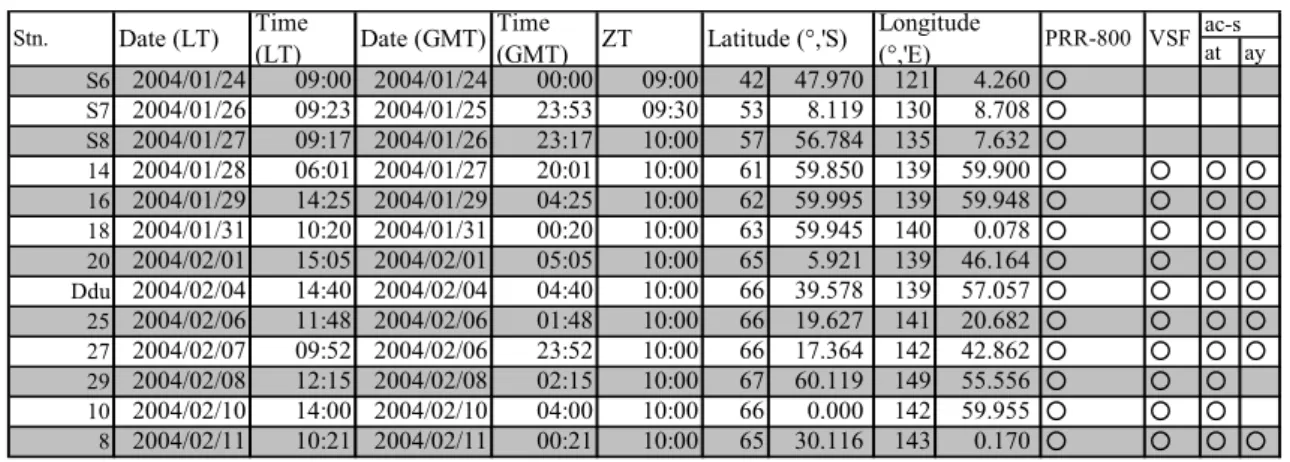
-Table 7. Summary of optical measurements during the cruise at and ay is total absorption by 1st cast and absorption of dissolved matter by 2nd cast, respectively.
at ay S6 2004/01/24 09:00 2004/01/24 00:00 09:00 42 47.970 121 4.260 ○ S7 2004/01/26 09:23 2004/01/25 23:53 09:30 53 8.119 130 8.708 ○ S8 2004/01/27 09:17 2004/01/26 23:17 10:00 57 56.784 135 7.632 ○ 14 2004/01/28 06:01 2004/01/27 20:01 10:00 61 59.850 139 59.900 ○ ○ ○ 16 2004/01/29 14:25 2004/01/29 04:25 10:00 62 59.995 139 59.948 ○ ○ ○ 18 2004/01/31 10:20 2004/01/31 00:20 10:00 63 59.945 140 0.078 ○ ○ ○ 20 2004/02/01 15:05 2004/02/01 05:05 10:00 65 5.921 139 46.164 ○ ○ ○ Ddu 2004/02/04 14:40 2004/02/04 04:40 10:00 66 39.578 139 57.057 ○ ○ ○ 25 2004/02/06 11:48 2004/02/06 01:48 10:00 66 19.627 141 20.682 ○ ○ ○ 27 2004/02/07 09:52 2004/02/06 23:52 10:00 66 17.364 142 42.862 ○ ○ ○ 29 2004/02/08 12:15 2004/02/08 02:15 10:00 67 60.119 149 55.556 ○ ○ ○ 10 2004/02/10 14:00 2004/02/10 04:00 10:00 66 0.000 142 59.955 ○ ○ ○ 8 2004/02/11 10:21 2004/02/11 00:21 10:00 65 30.116 143 0.170 ○ ○ ○ ac-s PRR-800 VSF Time ○ ○ ○ ○ ○ ○ ○ ○ (GMT) ZT Latitude (°,'S) Longitude (°,'E) Stn. Date (LT) Time (LT) Date (GMT) 152
-Phytoplankton Community and Primary Production
Measurement of phytoplankton biomass and primary productivity
Naho Horimoto*, Shunsuke Oki*, Naoki Kondo**, Toru Hirawake**, Takashi Ishimaru* (*; TUMSAT, **;Hokkaido University)
Sampling
Oceanographic observations were carried out from 29th January 2008 to 12th February 2008. Hydrographic data and water samples were collected with a CTD (Falmouth Scientific, Inc.) rosette system fitted with Teflon-coated Niskin bottles of 20L capacity. The vertical photosynthetically active radiation (PAR) profiles were measured using a CTD system attached a quantum sensor (Biospherical Instruments). The samples for determination of 13C uptake were collected from six depths corresponding to 100, 25, 12.5, 6, 3, and 1% of the surface irradiance with reference to the PAR profile. The seawater samples for Chl a concentration analysis were collected from 12 depths above 200 m depth. The surface water was collected by the bucket at almost same time of CTD cast. The incident solar radiation was monitored with a LiCor 2π sensor during the incubation experiments (see an attached file for preliminary data).
Table 8. Sampling stations and items
13C uptake FR R f S 6 2008/01/25 00:02 ○ ○ ○ S 7 2008/01/26 23:30 ○ ○ ○ S 8 2008/01/27 23:04 ○ ○ ○ 14 2008/01/28 21:52 ○ ○ ○ 16 2008/01/30 04:20 ○ ○ ○ 18 2008/02/01 00:24 ○ ○ ○ 20 2008/02/02 04:51 ○ ○ ○ 21 2008/02/02 22:51 - - -22 2008/02/03 13:43 - - -23 2008/02/04 05:29 - - -D du 2008/02/05 04:37 ○ ○ ○ 42 2008/02/06 07:34 ○ ○ -24 2008/02/06 18:43 - - -25 2008/02/07 01:48 ○ ○ ○ 27 2008/02/08 00:26 ○ ○ ○ 11 2008/02/08 10:01 - - -29 2008/02/09 02:15 ○ ○ ○ 12 2008/02/10 05:16 ○ ○ -10 2008/02/11 03:55 ○ ○ ○ 9 2008/02/11 07:28 - - -8 2008/02/12 00:21 ○ ○ ○
P rim ary P roduction P hytoplankton identification C hl a concentration D ate(G M T) S tation -○ ○ -○ ○ ○ ○ ○ ○ ○ ○ ○ ○ ○ ○ ○ ○ ○ ○ ○ 153
-Total Chl a concentrations (see an attached file for preliminary data)
Phytoplankton was collected on a Watmann GF/F glass fiber filter by filtering 200 ml seawater at < 150mm-Hg pressure for later Chl a measurement. Chl a was immediately extracted by immersing the filter in N,Ndimethylformamide (Suzuki and Ishimaru, 1990), and the samples were preserved at -20°C until on analysis. Chl a concentrations were determined using a Turner Design Model 10-AU Fluorometer calibrated with commercial chlorophyll a (Wako Pure Chemical Industries), according to the method of Parsons et al. (1984a). Photosynthetic pigments on the filter were extracted with 6ml N, N-dimethylformamide for one day at –20°C (Suzuki and Ishimaru 1990). Chl a concentration was measured by the fluorometoric method (Strickland and Parsons, 1972) using a Turner Design fluorometer with the Welshmayer filter set.
Micro-phytoplankton observation and identification
Samples of micro-phytoplankton were collected 500ml seawater and fixed by formaldehyde (1% final concentration). After the cruise, sample was settled for several days and drained off to leave about 5ml in the bottom. The water was moved to Throndsen's sedimentation/counting chamber (UNESCO 1978) and then microphytoplankton such as diatoms, dinoflagellates, and coccolithophorids were enumerated under a compound microscope with 400 x magnification.
The identification of small diatoms and coccolithophorids used scanning electron microscopy (SEM) for the each sample; small amount of sample filtered by Millipore filter (type SM, 0.45µm ø), and desalinated by MilliQ water buffered by neuter formaldehyde. And then the filter dried in the desiccator for a day, and was mounted onto an aluminum SEM specimen mount using double-side adhesive tape. The specimen samples were sputter coated with platinum-palladium at 16 Å for 3 minutes (Hitachi E-1030) and examined with a S-400 Hitachi SEM at an acceleration voltage of 15 to 35 KV and a magnitude between 3,000 and 20,000.
Estimation of phytoplankton carbon biomass
Cell abundance was transformed into phytoplankton carbon biomass directly from phytoplankton counts by determination of the cell volume (SCOR-UNESCO 1978). Cell volumes were calculated by
-measuring their longest and shortest dimension for about 20 cells per species, and then the thickness was estimated from Miyai’s equation (Miyai et al. 1986). The shapes of the various phytoplankton species were assigned simple geometric forms for estimation of cell volume. Carbon biomass of each cell was calculated from cell volume using the equations from Strathmann (1967) for the diatoms and dinoflagellates, and using that of Verity (1993) for smaller cells, and total phytoplankton carbon was estimated as the sum of micro-, nano- and picophytoplankton carbons.
Photosynthetic 13C incorporation
Seawater samples from each depth were immediately transferred into two transparent 500 ml polycarbonate bottles. Seawater in the bottle was spiked with a 13C-NaHCO
3 (99 atm% 13C, Isotec Co.) solution. The 13C enrichment was about 10% of the total inorganic carbon in the ambient water. Incubation experiments were begun within about 1 hour after sample collection. The samples were incubated for 24 h in an on-deck incubator that simulated the irradiance at the original sampling depths by use of various combinations of neutral density. Immediately following incubation, the samples were filtered directly through pre-combusted (450°C for 4 h) Whatman GF/F filter under gentle vacuum (<200mm Hg), and the particle matter on the Whatman GF/F filters was rinsed with pre-filtered seawater. The pre-filtered samples were immediately frozen and stored at -20°C until isotope analysis on land. After the cruise, those filters will be treated with HCl fumes for 4 h to remove inorganic carbon, and completely dried in a vacuum desiccator. The isotopic ratios of 13C to 12C and particulate organic carbon will be determined by a DELTA Plus (Finigan MAT, Germany) mass spectrometer. Primary productivity will be calculated according to the equation described by Hama et al. (1983).
Table 9. Sampling stations and depths for measuring of primary productivity
Date Time
GMT deg min deg min 100% 25% 12.5% 6% 3% 1%
S6 2008/01/25 00:02 42 47.909 S 121 4.213 E 0 17 28 37 47 65 S7 2008/01/26 23:30 53 8.049 S 130 8.564 E 0 30 50 70 85 115 S8 2008/01/27 23:04 57 56.706 S 135 7.539 E 0 30 50 65 80 105 14 2008/01/28 21:52 61 59.717 S 140 2.186 E 0 20 38 53 65 85 16 2008/01/30 04:20 62 59.999 S 140 0.008 E 0 24 45 62 73 93 18 2008/02/01 00:24 63 59.995 S 140 0.078 E 0 22 40 58 73 93 20 2008/02/02 04:51 65 5.921 S 139 46.146 E 0 10 25 35 45 60 DdU 2008/02/05 04:37 66 39.578 S 139 57.057 E 0 7 13 18 24 33 25 2008/02/07 01:48 66 19.627 S 141 20.743 E 0 8 15 28 42 57 27 2008/02/08 00:26 66 17.336 S 142 43.202 E 0 6 10 17 24 38 29 2008/02/09 02:15 67 0.119 S 144 59.556 E 0 12 18 28 36 55 10 2008/02/11 03:55 66 0.005 S 142 59.955 E 0 13 26 37 45 57 8 2008/02/12 00:21 65 30.116 S 143 0.170 E 0 22 41 58 74 97
Station Latitude Longitude Optical Depth
-Fast Repetition Rate Fluorometer (FRRF, Kimoto Electric Co., see an attached file for preliminary
data)
The FRR fluorometer measures in vivo Chl a fluorescence of phytoplankton and estimate rapid, real-time profile, in situ primary productivity per unit amount of Chl a. The downloaded data is analyzed with software which is provided by Kimoto Electric Co. These software can calculate photosynthetic parameters such as Fv/Fm, σPSII etc. Primary productivity is calculated from the PSII parameters and irradiance data using the equation of Kolber and Falkowski (1993) were described.
-Visual Plankton Recorder – Dhugal Lindsay, JAMSTEC
-Zooplankton – Multinet and Barcoding -Russ Hopcroft, UoAF Multinet report:
Russ Hopcroft, University of Alaska, Fairbanks
The Hydrobios 0.25m2 Midi multinet was deployed 8 times during the CEAMARC cruise, with deployment aborted at one station and cancelled at 3 others due to poor weather. Vertical multinet deployments at the first station proved problematic due to excessive vertical excursion when deployed from the stern, and deployment was shifted to oblique tows. Deployment to 2000m on 2 occasions resulted in entanglement of the cod ends, suggesting that payout of 1 m/sec was too fast and a maximum of 0.6m/sec appears to be the maximum reliable rate. At station 21 the multinet dragged along the bottom due to a miscalculation of water depth. All deployments on the shelf were successful due to the combination of more favourable weather and lower deployment speeds.
When deployed successfully, the Multinet provided better vertical resolution and sampled smaller jellies more efficiently than the RMTs. Several
species of smaller jellies were only observed in the Multinet collections, and the stations where the Multinet was employed therefore captured a higher diversity of gelatinous zooplankton. In contrast, the RMTs provided better information on medium and larger jellies due to its larger sampling volume, and being less constrained by weather than the finer-meshed Multinet.
Station Depth Comment
15 1000 Poor sample 17 2000 tangled 19 2000 aborted 21 1800 Hit bottom 23 cancelled 25 200 Successful 42 200 cancelled 27 380 Successful 11 670 Successful 13 670 cancelled 10 430 Successful 8 2000 tangled
In the future, we would recommend that a net(s) of similar area and mesh to the multinet be incorporated into the RMTs to provide more complete information on the smaller gelatinous AND crustacean zooplankton, without the commitment of additional wire time required by the Multinet.
-Imaging and barcoding report:
More than 2000 digital microscopic images of zooplankton were taken during the cruise on ~100 unique species of zooplankton. Images encompassed the majority of taxa that comprise the zooplankton communities in the sampling area (30 copepod species, 25 amphipod species, 13 forms of mollusks, 5 polychaete species, 4 euphausiid species, 4 nemertean species, and lesser numbers in several other groups). All
these taxa, plus ~70 additional cnidarians and ctenophores (see Jellies report), and 8 cephalopods were preserved in ethanol while fresh, and will be submitted to CoML’s Census of Marine Zooplankton project for barcoding of mitochondrial COI.
-ZOOPLANKTON – NORPAC NET
Preliminary report on NORPAC-net samplings in the CEAMARC cruise by TR/V Umitaka-maru in January to February, 2008
Yuko Watanabe, Shunsuke Oki, Naho Horimoto, Takashi Ishimaru and Masato Moteki
Faculty of Marine Science, Tokyo University of Marine Science and Technology. 4-5-7 Konan, Minato, Tokyo 108-8477 - Japan (TI: [email protected] )
Objectives
To evaluate distribution patterns of plankton in the euphotic layer in relation with water mass off Adelie Land and George V Land. Another aim is to take fundamental data for understanding annual fluctuation compared with previous cruise of TR/V Umitaka-Maru and other research vessels along the 140o E meridian line.
Summary of sampling
A total of twenty-three NORPAC-net casts in CEAMARC stations and three on the way to research zone (Stn. S6-S8) were conducted from 25 January to 12 February (Table 10). A twin net with 0.110 mm and 0.330 mm was used in this cruise (Figure 5). Flow meters were equipped with the mouth of each net. The net was deployed down to 150 m depth and towed vertically at 1.0 m/s using a BT winch in the bow deck. In the front of Dumont d’Urville Staion (Stn. DDU) where bottom depth was 52 m, towing was made from 45 m depth.
Samples were fixed by 5% neutralized formalin solution immediately on deck. In all, we sampled 52 lots of plankton. These will be sent to TUMSAT and examined there.
-Figure 5 NORPAC-net sampling off Dumont d’Urville Station. Table 10 Sampling record of NORPAC-net in the CEAMARC cruise by TR/V
Umitaka-maru in January to February, 2008
Location Flow meter*1
Station Date (SMT) Lat. (S) Long. (E) Depth (m) XX GG
S6 25 Jan. 08 42˚47.89' 121˚04.22' 4680 3238 3481 S7 27 Jan. 08 53˚08.07' 130˚08.61' 3901 3048 3162 S8 28 Jan. 08 57˚56.71' 135˚07.57' 5785 3468 3457 UM14 29 Jan. 08 61˚59.79' 139˚59.91' 4271 2809 2790 UM15 30 Jan. 08 62˚29.71' 140˚00.35' 3387 3057 2885 UM16 30 Jan. 08 62˚59.88' 139˚59.95' 3790 2453 2397 UM17 31 Jan. 08 63˚30.06' 139˚59.75' 3797 2253 2176 UM18 01 Feb. 08 63˚59.91' 140˚00.01' 3387 2497 2192
UM19 01 Feb. 08 64˚30.07' 139˚59.99' no data 4100 4070 UM20 02 Feb. 08 65˚07.09' 139˚50.12' 2781 2958*2 4425 UM21 02 Feb. 08 65˚28.62' 139˚51.66' 1678 2091 1910 UM22 03 Feb. 08 65˚44.45' 140˚06.26' 281 1655 1564 UM23 04 Feb. 08 65˚59.96' 140˚00.04' 197 2940 2935 DDU 05 Feb. 08 66˚39.59' 139˚57.01' 52 401 415 UM42 06 Feb. 08 66˚19.96' 139˚59.70' 491 2392 2470 UM24 07 Feb. 08 66˚20.09' 140˚40.44' 170 1493 1631 UM25 07 Feb. 08 66˚20.36' 141˚22.83' 237 1357 1553 UM26 07 Feb. 08 66˚19.87' 142˚00.06' 256 1791 1815 UM27 08 Feb. 08 66˚19.84' 142˚40.38' 383 2164 2308 UM11 08 Feb. 08 66˚19.99' 143˚19.91' 716 1334 1643 UM29 09 Feb. 08 67˚00.13' 144˚59.55' 1030 2014 2050 UM13 10 Feb. 08 66˚49.95' 144˚19.98' 918 1450 1674 UM12 10 Feb. 08 66˚34.02' 144˚00.21' 822 1327 1612 UM10 11 Feb. 08 65˚59.89' 143˚00.07' 463 1950 1890 UM9 11 Feb. 08 65˚42.77' 143˚14.05' 2115 1436 1868 UM8 12 Feb. 08 65˚29.99' 143˚00.15' 2776 1847 2458
*1 Flow meters: No.3383 and No.3232 for XX (mesh size 110 μm) and GG (330 μm) , respectively.
*2 Flow meter dropped from the ring.
-ZOOPLANKTON AND FISH LARVAE – RMT 1+8M
Preliminary report on RMT 1+8 samplings in the CEAMARC cruise by TR/V Umitaka-maru in January to February, 2008
Masato Moteki1, Phillipe Koubbi2, Patrice Pruvost3, Eric Tavernier4 and Takashi Ishimaru1
1
Faculty of Marine Science, Tokyo University of Marine Science and Technology. 4-5-7 Konan, Minato-ku, Tokyo 108-8477 – Japan ([email protected] )
2
Laboratoire d’Océanographie de Villefranche. Université Paris VI. UMR CNRS 7093. Station Zoologique. La Darse. BP 28. 06230 Villefranche sur mer – France ([email protected])
3
Muséum national d’histoire naturelle. Collection d'ichtyologie CP26 – MNHN. 43, rue Cuvier. 75231 Paris cedex 05 – France ([email protected] )
4
IUT Calais - Boulogne - Dpt Génie biologique. Quai Masset - Bassin Napoléon. BP 120. 62327 Boulogne-sur-mer – France ([email protected])
Objectives
To clarify distribution patterns of zooplankton and fish assemblages horizontally and vertically in oceanic through coastal area on the shelf off Adelie Land and George V Land.
Summary of sampling
In all, thirty-five casts in twenty-two stations were conducted from 28 January to 12 February, 2008. Study area covered oceanic to coastal zone off Adelie Land and George V Land. A multiple opening/closing net system (Rectangular mid-water trawl, RMT 1+8) that we used here is equipped with two types of nets, 1 m2 net with 0.330 mm mesh and 8 m2 net with 4.5 mm mesh (Figure 9). This net system possesses three nets for each type, and is able to open and close at arbitrary depth by direction from computer on board through cable. We made shallow casts at three layers, 0-50-100-200
-m, in 17 of 22 stations, and deep casts at 200-500-1000-2000 m layers or 500-1000 -m, or 0-200-500 m layers in seven stations (Table 11). For ten casts in six stations, we did not use open/close function, and made double-oblique tows, due to some problem in communication between computer and net system. In these casts, a depth-temperature logger and flow meter were attached to the net.
Samples collected
After net being on deck, Antarctic silverfish, Pleuragramma antarcticum, several fish species for barcoding, and good conditioned (beautiful and not damaged) zooplankton and some gelatinous animals for pictures were sorted immediately, and the rest was fixed with neutralized formalin solution. For barcoding and stable isotope studies, a small tissue was taken from right side of body and preserved in 95 degree ethanol. A total of about 200 L of samples was collected.
Further analysis
Fishes sorted and tissue samples taken on board will be sent to France (Laboratoire d’Océanographie de Villefranche. Université Paris VI., Muséum national d’histoire naturelle, or IUT Calais - Boulogne - Dpt Génie biologique) or University of Tasmania, and used for the life history, ecosystem, barcoding and stable isotope studies. A part of zooplankton sampled on board will be sent to JAMSTEC (Yokosuka, JAPAN) or University of Alaska, for further morphological examination. Other fishes and zooplankton sample will be sorted in TUMSAT, and fishes sorted there will be sent to AAD (Hobart, Australia).
In each laboratory, wet weight and individual number will be taken at each major zooplankton taxon to estimate biomass. The first author will compile all data and analyze biomass, and study about early life history of major fish group (e.g. Myctophidae, Bathylagidae,Gonostomatidae, Notothenioidae).
-Figure 6 RMT 1+8 observation during nighttime.
Table 11 Date and targeted net depth of RMT 1+8 samplings by TR/V Umitaka-Maru in CEAMARC cruise in January to February, 2008
Stn. Date (UTC) Net depth (m) Note
UM14 28 Jan. 0-50-100-200 Shallow
UM14 29 Jan. 200-500-1000-2000 Deep
UM15 29 Jan. 0-50-100-200 Shallow
UM15 29 Jan. 0-200-500-1000 Deep
UM16 30 Jan. 0-50-100-200 Shallow
UM16 31 Jan. 200-500-1000-2000 Deep
UM17 31 Jan. 0-50-100-200 Shallow
UM17 31 Jan. 0-200-500-1000 Deep
UM18 1 Feb. 0-50-100-200 Shallow
UM18 1 Feb. 200-500-1000-2000 Deep
UM19 2 Feb. 0-200-500-1000 Deep
UM20 2 Feb. 0-50-100-200 Shallow
UM20 2 Feb. 200-500-1000-2000 Deep
UM21 3 Feb. 0-50-100-200 Shallow
UM21 3 Feb. 0-200-500-1000 Deep
UM22 3 Feb. 0-50-100-200 Shallow
UM23 4 Feb. 0-50-100-200 Shallow
UM42 6 Feb. 0-50-100-200 Shallow
UM42 6 Feb. 0-200-500 Deep
UM24 6 Feb. 0-50-100-200 Shallow
UM25 7 Feb. 0-50-100-200 Shallow
UM26 7 Feb. 0-50-100-200 Shallow
UM27 8 Feb. 0-50-100-200 Shallow
UM27 8 Feb. 0-200-500 Deep
UM11 8 Feb. 0-200-500 Deep
UM29 9 Feb. 0-200-0 Double oblique tow UM13 9 Feb. 0-200-0 Double oblique tow UM12 10 Feb. 0-500-0 Double oblique tow UM10 10 Feb. 0-200-0 Double oblique tow UM10 10 Feb. 0-400-0 Double oblique tow UM09 11 Feb. 0-200-0 Double oblique tow UM09 11 Feb. 0-1000-0 Double oblique tow UM08 12 Feb. 0-200-0 Double oblique tow UM08 12 Feb. 0-500-0 Double oblique tow UM08 12 Feb. 0-1000-0 Double oblique tow
-ZOOPLANKTON METABOLISM – SALP NET
Preliminary report on Salp-net samplings in the CEAMARC cruise by TR/V Umitaka-maru in January to February, 2008
Atsushi Ono and Takashi Ishimaru
Faculty of Marine Science, Tokyo University of Marine Science and Technology. 4-5-7 Konan, Minato, Tokyo 108-8477, Japan
In order to examine metabolic rates (oxygen consumption rate, ammonia and phosphate excretion rates) of zooplankton, live animals were collected by a ring net (Salp-net, mouth diameter: 1.0 m, mesh size: 100 μm) equipped with a 12 L cod-end bucket (Fig. 7). Towing was made vertically at 0.5 m s-1 usually from 200 m depth to the surface (0 m) in ten stations, or from 100 m depth (Stns UM10, 11, 13, 22-25, 27 and 29) in nine stations where phytoplankton was abundant.
Experiments were conducted on animals taken at Stns UM15, 17, 18, 13, 09 and 08. Animals used for the experiments were the following four species, Euphausia superba, E. triacantha,
Themisto gaudichaudii and Tomopteris carpenteri (Table 12). They were kept over 24 hours under the
dark environment at −0.4 to 1.3 ˚C (mean 0.45˚C) in an incubator (EYELATRON FLI-301N). Immediately after experiments, the animals were identified and frozen (-20˚C) for analyzing elemental compositions, which will be made in TUMSAT after the present cruise.
Fig. 7 Salp-net used for this study.
-Table 12. Sampling record and experimental data during CEAMARC cruise by TR/V Umitaka-maru in 2008
Station Lat. (S) Long. (E) Depth (m) Experiment period (h) Exeriment temp. (˚C) Species used for experiment UM15 62-29.71 140-00.35 200-0 40 −0.4 to 1.0 Euphausia triacantha, Themisto gaudichaudii
UM17 63-30.06 139-59.75 200-0 50 −0.1 to 1.3 T. gaudichaudii
UM18 63-59.91 140-00.01 200-0 46 −0.3 to1.0 T. gaudichaudii, Tomopteris carpenteri
UM13 66-49.94 144-19.98 100-0 36 0.1 E. triacantha
UM09 65-42.77 143-14.05 200-0 29 0.0 E. superba
UM08 65-29.99 143-00.15 200-0 29 0.0 E. superba
-L’ASTROLABE REPORT – FOR REFERENCE
Preliminary report of the survey onboard the R/V « L’Astrolabe » in January 2008. Anne Goffart, Philippe Koubbi and Pierre Lejeune
The main aim of the Astrolabe survey was to continue the monitoring of plankton, fish larvae and euphausiids of the continental shelf and compare these results with the Survey of Umitaka Maru which was held few weeks after. This part of the project is supported by two national projects: ICOTA programme (Ichtyologie côtière en Terre Adélie) from IPEV-France and PADI (Pelagic Antarctic Diversity) from Belgium.
The final aim is to generate habitat models which will take into accounts presence-absence and abundance of fish larvae in relation with environmental parameters (in-situ hydrology but also remote sensing datas). These models can be input into the bioregionalisation programme of CCAMLR.
Material and Methods
Gears
At each stations, depending on the weather, the following gears are used :
‐ CTD to 200 metres,
‐ Niskin bottles at standard depths, ‐ Vertical haul of WP2 (200µm) to 200 m,
‐ Oblique tow of Bongo nets (500µm) from the surface to 200 metres.
‐ Continuous surface sampling of plankton with a Tubai net (500 µm) and sampling of surface waters.
Stations
The final sampling network is made of two transects, one along the longitudes 140°E from the coast to the shelf break and one longitudinal from 140°E to the Mertz glacier Tongue and along this one
-(Figure 8). Most of these stations were visited by “Aurora Australis” and “Umitaka Maru” during the CEAMARC surveys.
Figure 8: Sampling network of the R/V “L’Astrolabe” in January 2008.
Samplings
All planktonic specimens and fish larvae were preserved in formaline for future analysis in Belgium and France.
Species / Families Analysis Researcher Institution
CTD Anne Goffart and
Philippe Koubbi
ULG LOV
Nutrients and Pigments Anne Goffart ULG
Phytoplankton Identification Dorothée Vincent LOG-ULCO Copepods Identification and life
stages
Jean-Henri Hecq ULG Standard measurements
and life stages Philippe Koubbi LOV
Pleuragramma antarcticum
Larvae diet contents Carole Vallet LOG –IUFM Nord pas de Calais, Univ. Artois. Other Fish families Standard measurements
and life stages identification
Philippe Koubbi LOV
Euphausiids Identification and
standard measurements Carole Vallet LOG Other planktonic
organism
Identification Philippe Koubbi + X (to be recruited in April)
LOV
Astrolabe database Philippe Koubbi LOV
GIS Philippe Koubbi LOV