An Evaluation on Power Consumption and Performance Balancing Distributed Storage Systems
7
0
0
全文
(2) Vol.2011-DBS-152 No.6 Vol.2011-IFAT-103 No.6 2011/8/2. 情報処理学会研究報告 IPSJ SIG Technical Report. It is also concluded that RABBIT slightly overcome PARAID because of better data. be explained in Section 3. Section 4 is planned to describe and report the experiment. distribution over datanodes storing data in system.. results on actual machines. The conclusion and future works will be summarized in. However, the above paper just dealed with the relationship between system’s power. Section 5.. consumption and performance over fixed dataset. If the dataset was modified when. 2. Related Work. system contains a number of deactivate datanodes, then the original data layout policy is violated. As the result, system has to catch up with the newest status of the dataset. In this section, because PARAID and RABBIT’s data placement methods were used. through correction data layout when system moves to higher gear. In this gear, all. in experiments, these methods are described. And then, some other proposals in this. deactivate nodes at previous lower gear are reactivated. In this case, system needs to. area are also introduced briefly.. deal with both correcting the data layout according to its fixed data placement policy. 2.1 PARAID and RABBIT Data Placement. and guaranteeing the availability of its service to users. The data layout correction. Although not like RABBIT, PARAID was originally designed inside a RAID unit,. process which depends on the amount of new data written newly to system is thought. the idea can be expanded to distributed environment that contains a large number of. to have important effect to system’s performance in such scenario.. nodes connected through network. In this context, a node is defined as an normal. The contribution of this paper is as follows.. computer machine including processor, memory and hard disks. In this part, we de-. First, we decide to develop new writing modules and data layout correction. The idea. scribe the modified skewed data placement in PARAID in order to apply in distributed. here is inspired by Write Offloading technique proposing in 7) that is considered as stan-. environment.. dard technique in distributed environment allowing some datanodes to be turned down. Both of these two proposals are based from the idea of dividing the total number. to save power consumption. This technique’s idea is summarized as firstly, to write. of nodes in the system into small separated groups. Consequently, the system then. new data to any available datanodes; secondly taking logs that describe this event; and. contains a certain number of gears that include number of groups. A low gear with. finally correct the data layout later based on the log files.. small number of powered nodes is supposed to consume low power and vice versa.. Next, an evaluation of above modules is achieved through empirical experiment with. Given a dataset D with total B blocks, a total number of nodes N are divided into. PARAID and RABBIT, following the work in 3). The experiment is performed by. G groups. Each group contains a different number of nodes. In detail, each node is. using a benchmark that requires distributed Input/Output over large dataset and the. symbolized as n(g,i) , where g (1 ≤ g ≤ G) , i (1 ≤ i ≤ N ) indicate i-th of node at g-th. performance degradation when system makes a change of its operation mode from low. group. For example, nodes n(1,1) , n(1,2) belong to Group 1, while nodes n(2,3) , n(2,4). gear to high gear is reported. From the experiment result, because of better data place-. belong to Group 2 and so on.. ment which requires smaller amount of data needed to reallocate, PARAID was found. 2.1.1 PARAID. to achieved faster execution time than RABBIT.. PARAID is the first work to introduce the concept of gear-shifting based on load of. The paper is organized as follow. Section 2 gives a description of data placement. system within a RAID unit. It utilized the idea of skewed striping pattern to adapt to. methods of PARAID and RABBIT, a brief review of other approaches in balancing. the system load by varying the number of powered nodes.. performance and power consumption in distributed storage systems. New functions of. PARAID takes advantage of replicating and striping data blocks in a skewed fashion. write data at low mode and data reallocation process when system upshifts to higher. to nodes. Then, nodes could be organized into a number of groups and a number of. mode to serve a service which are newly implemented in PARAID and RABBIT will. groups forms gear.. 2. c 2011 Information Processing Society of Japan ⃝.
(3) Vol.2011-DBS-152 No.6 Vol.2011-IFAT-103 No.6 2011/8/2. 情報処理学会研究報告 IPSJ SIG Technical Report. Node Gear 3 Gear 2. Gear 1 Gear 1. 表 1 PARAID data placement Group 1 Group 2 Group 3 n(1,1) n(1,2) n(2,3) n(2,4) n(3,5) n(3,6) B1 B2 B3 B4 B5 B6 B1 B2 B3 B4 B5 ( 14 ) B5 ( 14 ) B5 ( 41 ) B5 ( 14 ) B6 ( 14 ) B6 ( 14 ) B6 ( 41 ) B6 ( 14 ) B1 B2 B3 ( 12 ) B3 ( 21 ) B3 ( 12 ) B3 ( 21 ) B3 ( 12 ) B3 ( 21 ) B3 ( 12 ) B3 ( 21 ). Node Gear 3 Gear 2 Gear 1. 表 2 RABBIT data placement Group 1 (Primary) Group 2 (Secondary) Group 3 (Secondary) n(1,1) n(1,2) n(2,3) n(2,4) n(3,5) n(3,6) n(3,7) B( 12 ) B( 13 ) B( 15 ) B( 21 ) B( 14 ) B( 61 ) B( 17 ) B( 12 ) B( 21 ) B( 13 ) B( 14 ) B( 12 ) B( 21 ) -. Here, in the constraint of keeping number of replica r small with fixed number of nodes RABBIT can guarantee that the number of blocks stored by i-th node must not be less than. B N. for all i ≤ N when N nodes are active. Obeying this constraint makes it. possible for the load to be shared equally among active nodes. Thus, the performance In PARAID, at first, all data D of B blocks are allocated evenly to all nodes. Next,. of the system is suggested to be linear with the number of powered nodes, i.e. implicitly. at lower gear that allows a number of nodes to be power off, in order to guarantee. corresponds to the power consumption of the system.. the availability, the data from nodes which are going to be deactivate will be evenly. Table 2 shows an example of data placement and corresponding number of data at. migrated to nodes that are active in next higher gear.. each node in RABBIT for a 7-node cluster with two primary nodes and 2-replica. It. Table 1 indicates a simple example of number of data at each node corresponding. is well recognized that 5 nodes in Group 2 and Group 3 store are enough for storing. to system’s operation gear through a storage cluster with six nodes, three groups and. the necessary data of second replication. Like PARAID, the system in RABBIT can. three gears. Gear 1 contains only active node in Group 1, Gear 2 needs all four nodes in. operate in multiple gears. For example, as shown in Tab. 2, Gear 1 only includes the. both Group 1 and Group 2 be active and the highest gear, Gear 3, all six nodes are set. first two nodes belonging to Group 1, Gear 2 includes active disks in Group 2 joining. to be activated. When the system move from Gear 3 to Gear 2 to save power, because. with Group 1, and Group 3 activates all nodes inside the system.. all the data in Group 3’s nodes are already replicated to active nodes in Group 1 and. 2.2 Others. Group 2, the system is able to provide all the data in the dataset to clients using it.. Like PARAID, GRAID 6) is a green storage architecture aiming for improving energy. Through the above techniques, PARAID is considered to be able to control the power. efficiency and reliability within RAID unit. In this proposal, the data mirroring redun-. consumption and performance of storage system.. dancy of RAID10 is extended by incorporating a dedicated log disk. The function of. 2.1.2 RABBIT. this log disk is to store all updates since last mirror-disk update. Using these informa-. RABBIT is a power-proportional distributed file system (PPDFS) that uses a cluster-. tion for log disk, the system only needs to update the mirroring disks only periodically,. based storage data placement to control power and performance of system.. thus being able to spin down all the mirroring disks to lower power mode most of the. Assuming that r replicas of B blocks of dataset D are desired to be stored to n nodes. time to save energy.. with G groups and G gears. At first, one replica of all B blocks are evenly stored in. Designed as a power-proportional, distributed file system as RABBIT, SIERRA 7). first primary p nodes at Group 1 (also called primary group). Consequently, each node. is a replicated object store that allows storage servers to be put into low power states. blocks. The remaining (r − 1) replicas are distributed to (N − p). when load is low. This allows servers hosting inactive replicas to be powered down. For. in Group 1 contains. B p. nodes in the way that the node n(g,i) , where g > 2 and p < i ≤ N , stores. B i. blocks.. example, in three-way replicated system like in normal Hadoop Distributed File System. 3. c 2011 Information Processing Society of Japan ⃝.
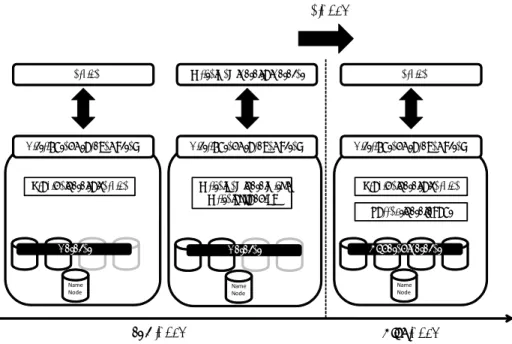
(4) Vol.2011-DBS-152 No.6 Vol.2011-IFAT-103 No.6 2011/8/2. 情報処理学会研究報告 IPSJ SIG Technical Report. (HDFS) 1) or Google File System, SIERRA allows up to. 2 3. of the storage servers to. Up Gear. be in standby. Comparing with RABBIT, SIERRA’s data placement is simpler as all storage servers keep the same amount of data. Kim et. al 5) suggest a fractional replication method in order to achieve balancing. Service. Write New Data to Dataset. Service. Distributed Storage System. Distributed Storage System. Distributed Storage System. power consumption and performance of system. In this proposal, the data placement layout is inspired by PARAID as performing fractional replication and the decision of down shift operation modes to lower gear for saving power consumption by a probabilistic prediction model based on historical observations. However, this work still does not cover with power degradation problem at versus process, a movement of storage. Provide data to service. Write new data with Write offloading. system’s operation mode from low gear to high gear.. Provide data to service Correct data layout. In 3), the authors reported an evaluation comparison between PARAID and RABBIT under similar distributed environment through empirical experiment. The idea of. Dataset. Dataset. Updated Dataset. PARAID is extended from RAID unit to HDFS, a popular and open source distributed file system. From this paper, it is said that RABBIT, because of better data distribu-. Name Node. Name Node. Name Node. tion gained better performance in read feature. However, the write modules and also the data layout correction when system restores from low gear to high gear are still not. Low Gear. covered yet.. 図1. High Gear Overview of catchup process. 3. Data Catchup Process In this section, focusing on the performance degradation occur when the system moves. written completely in case of PARAID, or replicated fully in case of RABBIT.. up from low gear to high gear with the existing of write request to dataset, the process. Next, when a service requiring new dataset to be stored and desiring higher perfor-. catchup process from the time system accepts new write request at low gear, to the time. mance, system is changed to high gear. In this step, not only providing data to this. it finishes a service requiring process over new dataset is describe. This paper follows. service, but also data layout correction is needed inside storage system.. the work done in 3) so the idea of data placement of PARAID is extended to be able. The detail operation of above two processes is described in the following parts of this. to implement in HDFS, a distributed file system.. section.. 3.1 Overview of Catchup Process. 3.2 Write New Data Using Write Offloading Technique. Figure 1 describes an overview of catchup process. At first, considering that system. When system in low gear and has to deal with requests of writing new data to dataset. operates in low gear with certain storing dataset. Then, it accepts requests that re-. which was already stored, it performs its data layout policy as defined according to its. quire writing new data to this dataset. Because in this gear, some of datanodes are. policy. Because system is operating in low gear, some of datanodes are powered off. As. in deactivate mode, in order to correspond to this write request, system is needed to. the results, certain parts of new data cannot be written to corresponding deactivated. implement write offloading technique in this step. Otherwise, new data could not be. datanodes. In such cases, system randomly chooses another node from active nodes to. 4. c 2011 Information Processing Society of Japan ⃝.
(5) Vol.2011-DBS-152 No.6 Vol.2011-IFAT-103 No.6 2011/8/2. 情報処理学会研究報告 IPSJ SIG Technical Report 1.. 2.. Locate new data E to Node 2 instead of Node 4 Save write offloading information log file. 1.. Correct data layout through Write offloading log file. 4. Experiments The purpose of the experiment is to evaluate the effect of data catchup resulting to. (Data, Temporal Node, Corresponding Node) - E, Node 2, Node 4 - …. Name Node. power degradation when system changes its operation from low gear to high gear with Name Node. Write offloading log file. the occurrence of dataset updating. 4.1 Experiment Method. Transfer data E to Node 4 E. E A C B D. C. D. A C B D. Node 3. Node 4. Node 1. A B. The functions of write offloading explained in Sec. 3 were added into HDFS source E. code. And the evaluation is achieved by using grep benchmarks accompanied with. C. D. HDFS. This benchmark is a very typical application that utilizes Map-Reduce frame-. Node 3. Node 4. E A B. work to find out from whole dataset elements that matches certain pattern. In this Node 1. Node 2. Low Gear. Node 2. frame work, the dataset is split into multiple parts for multiple workers to perform an action of seeking for appropriate results. Worker needs to read all its responsible. High Gear. dataset so, when multiple workers perform their job at the same time, it could be im-. 図 2 Data layout correction from write offloading. plied that there exits certain distributed I/O to the storage system. As the result, the serve this request. The information of data, temporally chosen node and corresponding. performance of system can be evaluated through the execution time of this benchmark.. node is saved in a log file. This in formation will be retrieved when system decides to. At first, guaranteeing original data placement policy, system is operated at high gear. change its operation mode from low gear to high gear.. and already stores certain dataset. Then we set the system to low gear and perform. The example of write offloading process is shown in Fig. 2. In this example, according. new requests that appending new data to old dataset. Next, we set the system’s oper-. to data placement policy, Node 4 should serve write request of data E. However, during. ation mode from low gear to high gear and run the benchmark. In this experiment, we. low gear, it is powered off, so the system decide to opt another node alternatively, here. designed two gears that Gear 1 contains only first three nodes to be active and Gear2. Node 2 is chosen. The system saves all of this information into a log file.. contains all seven nodes need to be powered on.. 3.3 Data Layout Correction. The effect of data catch up process leading to performance degradation of each method. When system changed to high gear to serve a service that requires processing over. (PARAID, RABBIT) is evaluated through the execution time of grep benchmark over. new updated dataset with higher performance desires, it needs to perform two functions.. updated dataset when upshift system from low mode to high mode. The experiments. The first function in to transfer the data written temporally at temporal datanodes to. were performed multiple times and memory cache was flushed between each time.. corresponding nodes. It could be achieved by reading the information from log files.. 4.2 Experiments Environment. The second function is to serve the service which scans all new dataset storing in storage. There are two elements in our framework.. system. It is well noticed that, comparing with normal serving at high gear when there. First, in storage, we use a number of nodes which play a role of datanode as in HDFS.. is no need of correcting data layout, the cost of allowing system to operate in multiple. Each datanodes is an autonomous disk which contains processor, memory, hard disk. mode for power saving highly depends on the amount of this catchup data.. and is designed for low power consumption. Next, in order to implement data placement and to manage information about data. 5. c 2011 Information Processing Society of Japan ⃝.
(6) Vol.2011-DBS-152 No.6 Vol.2011-IFAT-103 No.6 2011/8/2. 情報処理学会研究報告 IPSJ SIG Technical Report 表 3 Nodes specification Namenode. CPU Memory HDD Network Interface Card OS Java HDFS Block Size. Intel Pentium 4 3.00GHz SDRAM 2048MB SATA 320GB 1000Mb/s Linux 2.6.18 JDK-1.6.0 0.20.2 64MB. Execution time [s]. Datanode Transmeta Efficeon TM8600 1.0GHz DRAM 512MB IDE 100GB 100Mb/s Linux 2.6.18 JDK-1.6.0 0.20.2 64MB. 400 350. 314.1. 334.2. 316.3. 300 250 200 150. 表 4 Dataset specification Name Value. File size Old dataset New data. 313.9. 100. 200MB 1000MB (5 files) 200MB (1 files). 50. 20.3. 2.2. 0 Normal. location such as which datanode is containing what data, a namenode is used. At this. Catchup RABBIT. Penalty Cost. PARAID. namenode, the source codes relating to data placement of normal HDFS are touched to 図3. make it available to implement the layout policy of RABBIT and PARAID. Further-. Experiment result with grep benchmark. more, the function of implementing write offloading, setting operation mode of system through command line was added into namenode while datanode’s functions was kept. to higher gear node to perform benchmark over updated dataset. Penalty cost describes. untouched.. the difference between Normal and Catchup results.. The interconnect between datanodes and namenode is Extreme Network Summit. From this result, it is seen that in normal, both two nodes obtained similar results.. 16101 Gigabit Ethernet switch.. However, the penalty cost of RABBIT well overcome the one of PARAID by 10 times,. The specification of namenode and datanodes are summarized in Tab. 3.. 20 seconds comparing with 2 seconds. It is well reasoned that in this case, because the. Here, the dataset is a text file contains a number of fix 4-word length phrases, and. amount of data needed to transfer inside storage system was much larger in RABBIT. the pattern used in grep are generated randomly using Java-1.6.0. The size of storing. than in PARAID. There were only 8 MB needed to be write offloading in PARAID,. dataset was fixed to 1GB while the size of new written dataset was fixed to 200MB.. while the corresponding number in RABBIT was 196 MB. It is explained by the fact. The block size used in HDFS was 64MB and the number of replicas of data using in. that in this experiment, the number of replicas in RABBIT was set to 2, so it needs. RABBIT was set to 2.. much more data than PARAID to be stored in the system. However, with no repli-. 4.3 Experiments Results. cated data, PARAID is suggested not to be tolerant with the occurrence of failure in. Figure 3 shows the experiment result with grep benchmark. The results were aver-. datanode.. aged from two times running. Normal shows the execution time of 1.2GB dataset when no catchup occurred. Catchup indicates the result starts from the point system change. 6. c 2011 Information Processing Society of Japan ⃝.
(7) Vol.2011-DBS-152 No.6 Vol.2011-IFAT-103 No.6 2011/8/2. 情報処理学会研究報告 IPSJ SIG Technical Report. results through real deactivating nodes.. 5. Conclusion. Acknowledgements. Balancing performance and power consumption has become an important issue in distributed storage system area. For serving certain service over large amount of data. This work is partly supported by Grants-in-Aid for Scientific Research from Japan. storing in storage system, in order to achieve high performance, higher number of stor-. Science and Technology Agency (A) (#22240005).. age element is needed. However, it also makes the power consumption of whole system. 参. increased. Recently, a number of methods have been proposed to control the power. 考. 文. 献. 1) : Hadoop, http://hadoop.apache.org. 2) Charles, W., Mathew, O., Jin, Q., Andy, W. A.-I., Peter, R. and Geoff, K.: . 3) Hieu Hanh, L., Satoshi, H. and Haruo, Y.: Performance Comparison of PowerProportional Approaches in Storage Systems through Empirical Experiment, in the Proceedings of the 3rd Data Engineering and Information Management Forum (2011). 4) Hrishikesh, A., James, C., Varun, G., Gregory R., G., Michael A., K. and Karsten, S.: in the Proceeding of the 1st ACM Symposium on Cloud Computing, New York, NY, USA. 5) Kim, J. and Rotem, D.: Proceedings of the 14th International Conference on Extending Database Technology, New York, NY, USA. 6) Mao, B., Feng, D., Jiang, H., Wu, S., Chen, J. and Zeng, L.: in the Proceeding of IEEE International Symposium on Modeling, Analysis and Simulation of Computers and Telecommunication Systems, 2008. MASCOTS 2008. 7) Thereska, E., Donnelly, A. and Narayanan, D.: SIERRA: A Power-Proportional, Distributed Storage System (2009).. consumption and system’s performance. It makes the system can operate in multiple modes, however the power degradation occurred when system needs to catch up with new data while changing its operation mode from low gear to high gear is still not considered yet enough. In this paper, we decided to choose two representative methods, i.e PARAID and RABBIT in this field and compared them in the context of power degradation when the system has to catch up newest status of storing dataset and serves service requiring process over this dataset. Following the previous work, we developed this functions in PARAID and RABBIT over popular and open source Hadoop Distributed File System. In low gear, we applied the idea write offloading technique to write new data to temporal datanodes and when system changed to high gear, data layout correction is fulfilled. An empirical experiment through comparing execution time of grep benchmark that utilizes Map Reduce framework to find appropriate elements that matches certain pattern was performed. In both methods, the execution time of this benchmark at time catchup new data is needed and not needed were abstracted. From this experiment results, PARAID gained better performance comparing with RABBIT with faster execution time. The penalty cost for PARAID is 10 times better than RABBIT. One of considerable reasons is that because of its data placement policy, PARAID needs less amount of data to be relocated in data layout correction phase so, the bottleneck of system at that time was far behind one in RABBIT. In the future, we would like to examine with larger dataset and another benchmark. Furthermore, because the power consumption in this paper was implied as the number of active datanodes used in storage system, we also would like to obtain real numeric. 7. c 2011 Information Processing Society of Japan ⃝.
(8)
図


関連したドキュメント
A similar program for Drinfeld modular curves was started in [10], whose main results were the construction of the Jacobian J of M through non-Archimedean theta functions ( !;;z )
A combinatorial proof for the largest power of 2 in the number of involutions.. Jang
While early experiments with algebraic multigrid solvers have shown promising results [2], herein we focus on a domain decomposition approach based on the finite element tearing
Figure 83. The feedback pin modulates the frequency up to 130 kHz.. At low power levels or in no−load operation, the feedback voltage stays in the vicinity of 400 mV and
Combining energy-derived CO 2 emissions (industrial, commercial, residential, and transport sectors) with non-energy-derived CO 2 emissions (others), trends and composition ratios
Combining energy-derived CO 2 emissions (industrial, commercial, residential, and transport sectors) with non-energy-derived CO 2 emissions (others), trends and composition ratios
TEPCO is advancing technological development toward the realization of “smarter” power system networks through such initiatives as establishing power system networks that enable the
♦ Smart Sense Mode allows some digital and analog peripherals to remain active to monitor and acquire data from external sensors at a very low system−level power consumption..
