The Role of Central Bank in the Recession
̪---in the case of Japan’s recession---
Shigeyoshi Miyagawa Yoji Morita
Yoshitaka Sawada
Abstract
Japan’s economy is expanding and expected to continue expanding moderately as a trend, although the pace of growth seems to be slowing due to the temporal rise in oil and material prices. The BOJ declared the change of policy stance at the Monetary Policy Meeting held on July 14, 2006. The BOJ was obliged to tackle a severe recession which the Japanese economy had not experienced before. The economy was on the verge of financial panic, especially in 1997 and 1998, when major financial institutions had failed. It reminded us of the recurrence of the Great Depression in the 1930s.The article will clarify how the Japanese economy fell into a serious depression with a reflection on the role of the BOJ in the emergence of prolonged depression.
We will also estimate the interest rate elasticity of money demand in order to identify whether or not the Japanese economy was in a liquidity trap in the prolonged recession. We will use the EGARCH model to quantify the financial anxieties. The conclusion will suggest that the BOJ should have paid more attention to the behavior of money stock at the early stage of depression.
Keywords: bubble, money stock, financial anxieties, liquidity trap JEL classification: E21, E22, E24, E44
Introduction
Japan’s economy is expanding and expected to continue expanding moderately as a trend, although the pace of growth seems to be slowing due to the temporal rise in oil and food prices.
The nonperforming loans problem which had caused financial crisis has been almost overcome now.
Various economic indicators show the economy will expand for a substantial period. BOJ was obliged to tackle a severe recession which Japanese economy had not experienced before. The BOJ declared the change of policy stance at the Monetary Policy Meeting held on July 14, 2006. The Japanese economy has recovered from a very long recession which had never occurred after the Second World War, since the collapse of the bubble at the end of the 1980s.
Heated debates had been done over the cause of the prolonged recession. Debates were basically
̪The paper was originally submitted to the PCRC Workshop 'Power, Games and Institutions', held at Åland island, Finland, August 18-21, 2008. First author thanks University of Turku and Turku school of Economics for the invitation. He also thanks to the participants for their useful comments and discussions. The
workshop can be shown at the website:
http://www.soc.utu.fi/sivustot/pcrc/news/Alandworkshop.html
̪
Shigeyoshi Miyagawa Yoji Morita
Yoshitaka Sawada
divided into two parties. One party insisted that the recession came from real factors, such as an aging society, cheap goods imported from Asian countries, and the internationally converged technical level. They thought the microeconomic policies were necessary and there was no economic growth without structural reform. The other stressed the importance and necessity of macroeconomic policy, using the aggregate demand and supply (AD-AS) model in the textbook.
They focused on the shortage of demand caused by the leftward shift of the AD curve. Under the assumption the macro stimulating policy, such as government expenditure, reduction of tax, monetary policy would be needed. These debates remind us of the Great Depression in the 1930s.
People thought the liquidation was important, because the economic system was very inefficient at the first stage of depression1. Demands side was ignored. The recent researches clearly explain that the idea of liquidationists deepened the recession and developed the simple recession into the Great Depression. Inefficiency in the market cannot explain the increasing rate of unemployment.
Declining prices, deflation, caused the vicious circle of depression as Irving Fisher (1930)
suggested. It is important to stop the decline of prices in line with this thought, first of all. Deflation is also a monetary phenomenon as inflation. So monetary policy, especially controlling money stock is very important.
However unfortunately, the BOJ did not admit the importance of money stock. They kept the conventional monetary policy which targeted the inter-bank rate, even after the financial panic occurred in 1997. In 2003, the BOJ announced that there existed no more cointegration between the money stock and the real economic variables based on formal statistical tests. Besides, several economists pointed that the Japanese economy was in a liquidity trap at the inter-bank rate near zero.
At a very low interest rate, people are unwilling to hold bonds, preferring money instead as J.M.
Keynes suggested. So increasing money stock is absorbed only as idle balance and has no effect on the economy. Under a liquidity trap monetary policy would be ineffective and central bank would have no responsibility for the recession.
We will make it clear that there still exists a cointegration among the money stock and the real economic factors. We will also show that Japan was not in a liquidity trap. Our estimation results will show that the BOJ has a strong responsibility for the prolonged recession. The recession is characterized by rapid decline in asset prices which substantially accumulated the nonperforming loans. The mounting nonperforming loans, especially in the financial sectors, hampered the normal functions of financial intermediaries and Japan’s economy came to the verge of financial panic.
Financial panic caused the financial anxieties which had very negative effects on the economic activities. We will focus on the unobservable variables, financial anxieties, in the statistical estimation.
Before the statistical test, we will chronologically review the Japanese economy by dividing the period in two parts, before and after the burst of the bubble. The financial distress and deflation is rooted in the so-called bubble economy of the latter half of the 1980s when the economy had experienced the expansion of bubbles in asset prices. The review will focus on how the economic bubble occurred, how the recession started with the collapse of the bubble and how the authority, especially the Bank of Japan responded to its deterioration. We will conclude that the BOJ should not ignore the role of money stock by showing the statistical evidence on cointegration and liquidity trap.
1 The quotation of Treasury Secretary Andrew Melow who advised President Hoover is well known;
Liquidate labor, liquidate stocks, liquidate the farmers, liquidate real estate. It will purge the rottenness out of system. High costs of living and high living will come down. People will work harder, live a more moral life. Values will be adjusted, and enterprising people will pick up the wrecks from less competent people. See Randal Parker (2002), Ch.1.
1 The chronological review 1: the background of asset price bubble
Mounting trade surplus was often condemned by other countries, especially by United States of America. International cooperation was always and strongly required. First, we will explain the characteristics of the Japanese economy in order to understand why trade surplus kept increasing.
The Japanese economy is basically export-dependent because of lack of natural resources. The government, chiefly MITI (The Ministry of International Trade and Industry) supported and fostered the export-oriented industries by various measures, known as “industrial policy”. The BOJ and MOF (The Ministry of Finance) also supported them by a low interest rate policy. Financial system was strictly regulated, known as “convoy system”. The interest rates were rigidly regulated and the establishment of any new bank was not admitted. Such Japanese economy often caused trade friction especially with United States. After the oil shock in 1973, Japanese industries aggressively promoted the exports due to the shrinking domestic market. However Japanese yen rapidly appreciated after the Japanese currency system had changed from the fixed rate to the floating rate in 1974. The industries made great efforts to overcome the difficult situation caused by the highly appreciated yen. Many industries concentrated on high technology to increase the productivity. As a result Japanese export kept increasing in spite of highly appreciated yen.
However the trade friction between Japan and U.S got worse year by year especially after President Ronald Reagan started so-called Reaganomics by adopting monetarist policy and supply side policy. His policy, targeting a low inflation rate and strong dollar, had caused twin deficit of trade and budget in U.S. The U.S trade deficit with Japan accounted for over half of its total trade deficit in the 1980s. U.S congress took very hard stance to the Japanese increasing trade surplus and threatened with retaliating trade measures.
U.S demanded to open the meeting to discuss the U.S huge trade deficit. The Ministers of Finance and governors of the central bank of G5 countries (United States, United Kingdom, France, West Germany, and Japan) gathered to Plaza Hotel in New York in 1985. They discussed how to correct the trade imbalance between U.S and Japan and West Germany, especially how to reduce the huge trade deficit in U.S.
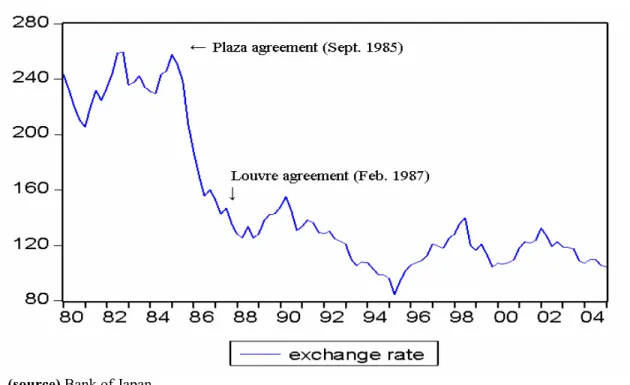
G5 countries agreed to concert to depreciate the high dollar in the meeting. The cooperative interest reduction began. In 1985, the long-term interest rate in U.S was 10.8 percent, while that in Japan was 5.8 percent. The difference was 4.7 percent as shown in Figure 2 when the exchange rate was 250s yen per dollar. In August 1986, U.S’s interest rate was reduced to 7.3 percent while Japan’s rate was 5.2 percent. The difference was reduced to 2.1 percent, which caused the rapid yen’s appreciation from 250s to 150s (see Figure 1). However Japanese current account balance did not decrease in spite of the yen’s rapid appreciation. U.S government was afraid that the further appreciation of the yen would make the Japanese economy so stagnant that it would be counter productive to the U.S economy. The Japanese economy was in a slight recession due to the high yen after Plaza agreement. So U.S gave the pressure to stimulate the Japan’s domestic demand and to raise the imports.
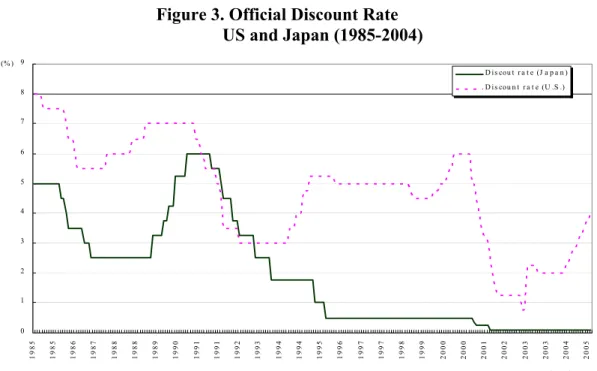
In the February 1987 Louvre agreement, Japan was demanded to take much easier monetary policy. The Bank of Japan reduced the official discount rate to 2.5 percent, the lowest level in response to the Louvre agreement in February 1987, while U.S increased the discount rate to 6.0
percent as shown in Figure 3. As a result, the difference between the long-term interest rate in U.S and that in Japan expanded from 2.2 percent to 4.5 percent which depreciated yen to the normal level, 140s yen.
Money growth started to rise in 1987 Q1. It grew more than 10 percent from 1987 Q1 through 1990 Q2. It was the beginning of the Japanese bubble. Some felt that the low discount rate and rapid increase of money growth might cause inflation. However a market crash had happened in New York in October 1987. G7 countries decided to cooperate to take easy monetary policy to avoid the world depression. As a result, Japan was compelled to keep the low interest rate policy.
However the Bundesbank (a central bank of West Germany) raised the discount rate and returned monetary policy to the neutral level (4.5 percent).
The reason why only Japan had to keep the easy monetary policy is as follows. The dollar was still weak to the Japanese yen. It was thought that the dollar would rapidly depreciate and bond and stock prices would substantially decrease and cause the depression in U.S, if the BOJ raised the discount rate. Then people thought the BOJ would never take the tight policy and the easy policy would continue for a long time2.
Under the assumption of affluent funds available, banks were very aggressive and competitive in their loan business. Anybody could get loans very easily from the banks as far as they had lands as the collateral because land price was believed to keep increasing forever. Large firms could get funds easily by using “equity finances”. So banks had tried to expand the loans to households and small firms which had not enough collateral with the expectation of their rise. Even housewives were advised to manage the apartment by borrowing money from the banks.
Both the stock and land prices had rapidly increased from 1988 through 1989 as shown in Figures 5 and 6, which could not be explained rationally by the fundamentals. The hike of asset prices did not respond to the first rise of the discount rate in May 1988 from 2.5 to 3.25 percent and the second rise in January 1989 from 3.25 to 3.75 percent at all. The bullish expectation had dispelled the negative effects on the asset prices. The asset prices kept increasing.
The both meetings of G5 remind us of G4 (England, Germany, France, US) meeting held in New York in 1927. England returned to the gold standard system at the prewar parity, though higher pound was expected to have a negative effect on the balance of payment. As a result, England which suffered from large trade deficit demanded the meeting. The meeting enforced U.S to take easy monetary policy which caused the rapid rise of asset prices, especially stock prices.
The Japanese government was obliged to follow the directions of the meeting. The government repeatedly explained to the people the importance and necessity of international cooperation. Under the old Bank of Japan Law established during the Second World War, the BOJ could not become independent from the government. People learned how important it was to have the central bank independent from government. On the reflection of the experience, the new Bank of Japan Law became effective in April 1998.
2 See Suzuki (1993) in more detail.
Figure 1. Exchange Rate, yen/dollar
(source) Bank of Japan
Figure 2. Long-term Interest Rate Difference, US and Japan (1985-89)
ource) Bank of Japan
2 . 0 2 . 5 3 . 0 3 . 5 4 . 0 4 . 5 5 . 0
1 9 8 5 1 9 8 6 1 9 8 7 1 9 8 8 1 9 8 9
D i f f e r e n c e b e t w e e n u s r a t e a n d J r a t e
(s
Figure 3. Official Discount Rate 4)
e 4. Money Growth Rate (year on year )
(source)
US and Japan (1985-200
0 1 2 3 4 5 6 7 8 9
1985 1985 1986 1987 1988 1988 1989 1990 1991 1991 1992 1993 1994 1994 1995 1996 1997 1997 1998 1999 2000 2000 2001 2002 2003 2003 2004 2005
(ye a r ) (% )
D is cou t r a t e (J a p a n ) D is cou n t r a t e (U .S .)
(source) Bank of Japan
Figur
.1 4
Bank of Japan -.0 2
.0 0 .0 2 .0 4 .0 6 .0 8 .1 0 .1 2
8 0 8 2 8 4 8 6 8 8 9 0 9 2 9 4 9 6 9 8 0 0 0 2 D E L T A M
2 The chronological review 2: after the burst of bubble
.25 percent in December 1989 hen a new governor Yasuo Mieno had taken his office. However the market was still bullish. Land
ount
last. The money stock (M2+CD) rapidly declined. It recorded egative year on year growth in mid –1992 as shown in Figure 4. After hitting a record high of
l
very because of the stimulus policies in 1994, some adverse factors hampered the economy. The highly appreciated yen damaged the export i
d
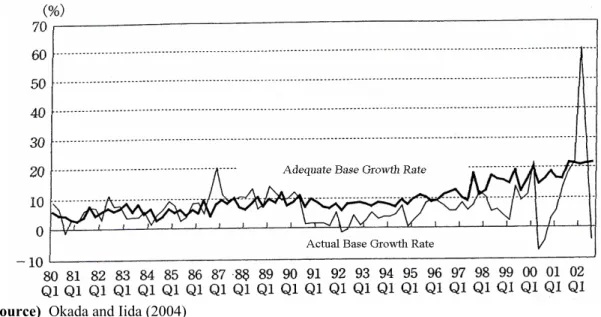
rowth with that of adequate monetary base growth based on the McCallum policy reaction rule as shown in Figure 75.
le
and
The BOJ implemented the third rise of discount rate from 3.75 to 4 w
and stock prices continued to rise to levels that could not be rationalized by the fundamentals of the Japanese economy. He had showed very strong stance to the bullish economy by fourth rise of discount rate from 4.25 to 5.25 percent3. He took the role of arbitrage of asset prices, unfortunately for the Japanese economy4. Furthermore governor Mieno had implemented the fifth rise of disc rate to 6.0 percent to avoid the homemade inflation caused by the Gulf War in August 1990 as shown in Figure 3. In addition the government also placed a ceiling on the total amount of financing available for real estate purchase.
The burst of the bubble began at n
38,915 yen at the end of 1989, the stock price (Nikkei Dow-Jones Index) rapidly began to decline.
In August 1992, stock price dipped below 15,000 yen, a 63 percent plunge from a peak level in Figure 5. Land price began to fail after hitting a peak in September 1990 and kept falling until now as shown in Figure 6. In response to the asset price decline, the BOJ reduced the discount rate six times from July 1991 to February 1993. The discount rate was ultimately reduced from 6.0 percent to 2.5 percent in Figure 3. The government also implemented the fiscal stimulus by spending a tota of 29.9 trillion yen in two years from 1992 to 1993.
Though the economy showed signs of a slight reco
ndustries. Yen reached a record high level of 79.75 yen per dollar on April 19, 1995. In addition, the great earthquake attacked Kansai districts and seriously damaged its economy in 1995. Lan and stock prices were promoted to decline. Prices, especially wholesale price, continued to decline and increased the deflationary pressure. Firms were obliged to continue the adjustment of their balance sheet damaged by the decline of asset prices. Under these conditions, the BOJ continued to lower the discount rate from 1.75 to 0.5 percent successively as shown in Figure 3. However, in hindsight those policy measures were not enough to recover the economy.
Okada and Iida (2004) compared the movement of actual monetary base g
According to their results, adequate monetary growth rate derived from the McCallum policy ru remained less than actual monetary growth in the bubble period from the half of 1980s. On the contrary, the adequate base growth has been consistently exceeding the actual base growth indicating that the volume of monetary base has remained insufficient since 1991.The results suggest that monetary policy was too easy in the latter half of 1980s and too tight since 1991 did not respond properly to the external shock which affected the Japanese economy.
3 New governor Mieno was hailed as an “Onihei of Heisei era”, who had strongly fought against the gangs as a leader of police officers in the Edo era more than 200 years ago.
4 Nowadays many economists understand that central bank should not take the role of the arbitrage of asset prices. See Randal Parker (2002).
5 The base growth rule was computed under the assumption that target rate of nominal GDP is 5 percent (3 percent real GDP growth and 2 percent inflation). See Okada and Iida (2004) in more detail.
Prime Minister Hashimoto, worried about the future of the government finance, implemented easures to reconstruct the financial structure. He was afraid that fiscal condition would get worse
eflationary conditions, a financial panic occurred. Hokkaido Takushoku Bank, one f Japan’s city banks (largest twenty banks), and Yamaichi Securities Company, one of Japan’s four
ks
e provide 30 trillion yen funds by suing bonds. The government was not willing to inject public funds into the problem banks by
s
ratio in arch 1998. However it had no significant effect on the banks because it was lax. Long-Term
g government hesitated to quickly resolve the nonperforming loans and bank problems which eakened financial institutions and caused long recession. The government officially announced in
s situation, both the BOJ and the overnment admitted at last that Japanese economy had fallen into the deflation. The Japanese
m
and worse with the coming of aging society in Japan. He decided to increase the consumption tax from 3 to 5 percent and abolish a special income tax cut in April 1997, which amounted to a tax increase of 9 trillion yen. It reminds us of Herbert Hoover who increased the tax in the midst of the depression in 1930s. Consumption had rapidly shrunk in response to Hashimoto’s tax increase policy. Unfortunately for the Japanese economy, the East Asian economic crises occurred in July 1997. The fiscal contraction compounded by the Asian crisis decreased the aggregate demand substantially.
Under the d o
largest security companies, failed in November 1997. The failure of two big financial institutions sent the sign that the government gave up the “too big to fail” policy. People thought no financial institutions were immune from failures. Rumors about the other banks’ failure had spread out through Japan. The stock prices of many financial institutions sharply declined and “Japan premium” in the international money market jumped by around 100 basis points. Japanese ban were obliged to pay the additional basis points for raising funds in the oversea financial markets.
The premium is calculated as the difference between the quoted rates of TIBOR in the Tokyo offshore market and LIBOR in the London offshore market. Bonds issued not only by Japanese financial institutions but also by Japanese government were downgraded at the investment grad ratings by international credit-rating agencies, such as Moody’s.
In response to the serious situation, the government decided to is
considering the negative sentiments of the congress and public at first. However the financial panic was so severe that neither the congress nor the public strongly opposed an injection of public fund to assist the problem banks. The 30 trillion yen was divided into the following two categories: 13 trillion yen was prepared for the enforcement of the Deposit Insurance System, while the remaining 17 trillion yen was intended for the capital injection of the problem financial institutions.
The government actually injected 1.8 trillion yen to 21 large banks to raise their capital M
Credit Bank and Nippon Credit Bank had failed in 1998 after the injection of public funds. 7.5 trillion yen was again injected in March 1999. The implementation was quite different from the former injection. Banks were strongly required to submit a detailed and meaningful restructurin plan6.
The w
late 1995 that nonperforming loans totaled 38 trillion yen, 4 percent of outstanding loans. In 1998, nonperforming loans increased to 73.1 trillion yen, 12 percent of all loans or 10 percent of GDP. All efforts by the government and private banks to decrease nonperforming loans did not succeed in reducing them at all because of the severe deflationary pressure.
The signs of deflation were apparent. In response to the seriou g
6 See M. Hutchison and K. McDill (1999) p. 66.
economy was thus caught in a vicious circle, so-called deflationary spiral indicated by Irving Fisher (1933). Decline in demand—Decline in production and price—Decline in employment (declin consumption) and Increase in loan in real term (decline in investment)—Decline in demand. GDP recorded negative growth for 5 consecutive quarters from the 1997 Q4 onward (for the first time since the start of GDP statistics in 1955).
The BOJ adopted further easy monetar
e in
y policy by reducing the call rate to 0.25 percent in 1998.
he BOJ also took the so-called zero interest policy by reducing it to virtually zero percent in licy, covery.
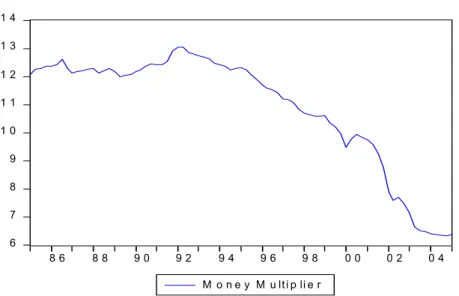
cause money multiplier rapidly decreased. Its behavior is depicted in Figure 12. The reasons why
where M: money supply, H: m C: cash, D: bank deposit, R: bank reserve
e of
onperforming loans contributed to the decline of their capital. Banks internationally operating are the
s ed ted T
February 1999. Furthermore the BOJ adopted the untraditional monetary policy, so-called quantitative easy policy by putting the bank reserve on its target. Owing to the expansionary po the financial panic seemed to settle down. The Japanese economy began to show signs of re
In spite of the BOJ’s efforts, money supply did not increase so much as shown in Figure 4, be
money multiplier declined are thought to be as follows. Money multiplier can be calculated as
/ 1
/ /
M C D H
C D R D u
onetary base,
Private banks were under pressure to meet the international BIS standard. The increas n
required to maintain an 8 percent capitalization for risk-weighted assets. Other banks limited to domestic operation are required to meet 4 percent. Banks with deteriorated balance sheets were obliged to reduce the commercial loans because the rise of risk assets decreased their own capital ratio. They had to increase the reserve ratio. Besides, banks tried to keep the cash on hand to prepare for the unexpected deposit withdrawals, especially after the financial panic in 1997. Thus bank lending had rapidly declined as shown in Figure 8. The negative bank lending had seriou effects on the firms, especially small and medium sized firms, which heavily relied on the bank lending. With mounting financial anxieties, not only banks but firms and households also increas cash holdings which increased cash-deposit ratio. Thus, the rise of both of C/D and R/D contribu to the decline of money multiplier.
Figure 5. Stock Price ( Nikkei 225)
(source)
nge of Land Price (year on year
)(source)
industrial)
4 0 0 0 0
Tokyo Stock Exchange
Figure 6. Cha
Japan Real Estate Institute, 6 Large Urban Areas, average (residential, commercial, and
0 5 0 0 0 1 0 0 0 0 1 5 0 0 0 2 0 0 0 0 2 5 0 0 0 3 0 0 0 0 3 5 0 0 0
1 9 7 0 1 9 7 5 1 9 8 0 1 9 8 5 1 9 9 0 1 9 9 5 2 0 0 0 sto ck p rice
- 3 0 - 2 0 - 1 0 0 1 0 2 0 3 0 4 0
1 9 8 4 1 9 8 6 1 9 8 8 1 9 9 0 1 9 9 2 1 9 9 4 1 9 9 6 1 9 9 8 2 0 0 0
Figure 7. Adequate and Actual Growth Rate
(source)
(source) Okada and Iida (2004)
Figure 8. Bank Loan Growth Rate (year on year)
. 0 2
Bank of Japan
- . 0 7 - . 0 6 - . 0 5 - . 0 4 - . 0 3 - . 0 2 - . 0 1 . 0 0 . 0 1
9 4 9 5 9 6 9 7 9 8 9 9 0 0 0 1 0 2
D L O A N
Figure 9. Inflation Rate (GDP deflator)
(source)
(source) Bank of Japan
.0 8
Bank of Japan
Figure 10. Call Rate
-.0 4 -.0 2 .0 0 .0 2 .0 4 .0 6
8 0 8 2 8 4 8 6 8 8 9 0 9 2 9 4 9 6 9 8 0 0 0 2
IN F G D P
9
0 1 2 3 4 5 6 7 8
8 6 8 8 9 0 9 2 9 4 9 6 9 8 0 0 0 2 0 4
C A L L
Figure 11. Bank Reserve
ource) Bank of Japan
Figure 12. Money Multiplier
ource) Bank of Japan
3 5 0 0 0 0
(s
(s
0 5 0 0 0 0 1 0 0 0 0 0 1 5 0 0 0 0 2 0 0 0 0 0 2 5 0 0 0 0 3 0 0 0 0 0
9 4 9 5 9 6 9 7 9 8 9 9 0 0 0 1 0 2 0 3 0 4
r e s e r v e
1 4
6 7 8 9 1 0 1 1 1 2 1 3
8 6 8 8 9 0 9 2 9 4 9 6 9 8 0 0 0 2 0 4
M o n e y M u lt i p li e r
3 The cointegration analysis and liquidity trap
oney stock
the
Does m y in a
liquid
responsiv n. To deal
with the s e more
interest sens
very low since 1995. A liquidity trap hypothesis was originally pointed 7), who suggested that at a low interest rate the demand for money will be ighly elastic to the interest rate and the demand curve would be flat. As people would only
crease their holdings of money in a liquidity trap even if the central bank increased the money ock, monetary policy would be inept and fiscal policy would be recommended. However Keynes
mas. The research addressing this topic as not so active. However a recent paper of Paul Krugman (1998) and the prolonged Japanese
le economy. There already exist several empirical studies o
e
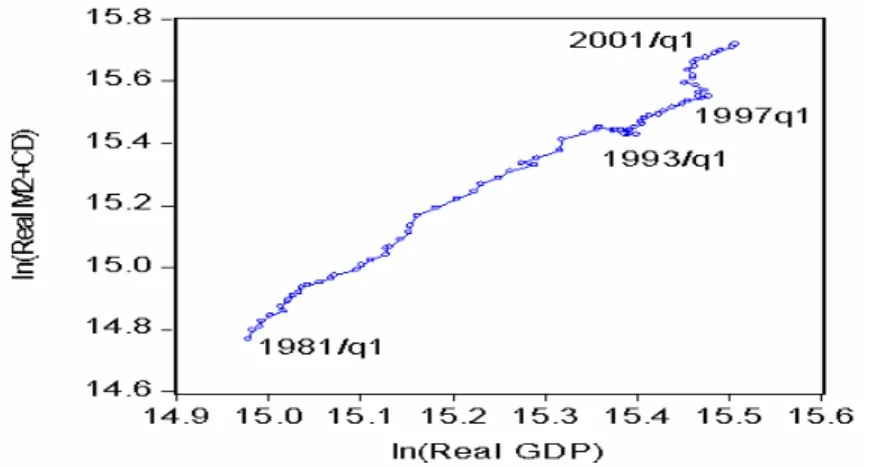
Under the serious economic situation reviewed above, in 2003 the BOJ had strongly questioned the relationship between money and the economic activity as follows. During the 1970s and the early 1980s, in spite of two oil shocks, long-run relationship was observed between the m and the real economy and between the money stock and prices in Japan. However, with the recession of 1990s, the relationship between them became harder to discern. We depicted the relationship between money and real GDP at the scatter diagram in Figure 13. We confirm
stable relationship between them before 1997. However two variables seem to diverge year by year after 1997 as the BOJ indicated.
oney stock have any relationship with the real economy? Is the Japanese econom ity trap? These problems are closely related with the effectiveness of monetary policy and
eness of the BOJ. We will perform the cointegration test for the first questio econd question we will focus on the issue of whether the demand for money becam
itive after the collapse of the bubble, especially after the financial crisis in 1997.
A liquidity trap is now a very controversial topic among economists, because the short term interest rate has remained
ut by J. M. Keynes (193 o
h in st
himself thought that a liquidity trap was just one of the dog w
recession renewed the interest. Krugman argued that the Japanese economy was in a liquidity trap and recommended the BOJ should take the inflation target policy. He insisted that the equilibrium interest rate is negative in a liquidity trap or saving and investment are equal at the negative real interest rate. In order to recover the equilibrium, Investment must increase. Investment will react to the real interest. So he suggested the adopt of inflation targeting policy, which will increase the inflation.
We investigate the possibility of liquidity trap which the Japanese economy might have fallen to after the collapse of the bubb
in
addressing a liquidity trap in the Japanese economy, which are McKinnon and Ohno (1977), Plender (1997), Wolf (1998), Hondroyiannis, Swamy, and Tavlas (2000), Fujiki and Watanabe (2004), Miyao (2004), and Nakashima and Saito (2006). The critical aspects of these researches d not take into consideration the characteristics of Japan’s prolonged recession. As we emphasized in the above chronological review, the negative sentiments spread out among people. Especially
ounting anxieties since autumn 1997 should not be neglected. The development of the Japanese m
recession would be a good example of “Lucas critique.” Mounting anxieties are thought to chang the econometric parameters which fitted well before the severe recession. Our approach will focus on the role of mounting anxieties in the process of deflation.
We perform a formal cointegration test to identify whether or not there exists a long-run
equilibrium relationship between the money stock and the economic activity in Japan. We focus on the relationship between three variables; the real money stock, real GDP, and the opportunity cost of holding money. For the opportunity cost, two interest rate series are used. One is the difference between the interest rates on the money stock and that on other financial assets, actually the spread
Figure 13. Relation Between Real Money and Real GDP (1981-2001)
Figure 14. Financial Anxieties
between 3 months CD rate and rate on government bond (ten years maturity). The other is just interest rate on government bond (ten years maturity) for the long rate. Both interest rates are alternatively used in estimation. M2+CD is the best available measure which the BOJ uses as an important policy variable.
If a long-run equilibrium relationship exists between the real money stock, real GDP, and the opportunity cost, we could say that money demand rises in line with increase in real GDP or decline in the opportunity cost. The system model is described by the VECM in the following7:
ǻrm(t) = cm0 + Įm ect(t-1)
+ i=1k cmi ǻrm(t-i) + i=1k dmi ǻy(t-i) + i=1k emiǻr(t-i) + İm(t) (1) y(t) = cy0 + Įy ect(t-1)
+ i=1k cyi ǻrm(t-i) + i=1k dyi ǻy(t-i) + i=1k eyiǻr(t-i) + İy(t) (2) r(t) = cr0 + Įr ect(t-1)
+ i=1k cri ǻrm(t-i) + i=1k dri ǻy(t-i) + i=1k eriǻr(t-i) + İr(t) (3) ect(t) = rm(t) + ȕyy(t) + ȕrr(t) + const. (4)
here
m(t) is real money stock (t) is real GDP
(t) is opportunity cost
ct(t) is an error correction term
ur results of cointegration test are in brief as follows. The detail will be shown later.
1. A long-run equilibrium relationship between the real money stock, the real GDP, and the
he reason why the relationship between the money stock and economic activity has been unstable
ew variable to explain the rise of precautionary demand for money since ple due to the x i
TANKAN in order to qualify the unobservable variable.
ǻ
ǻ w r y r e O
opportunity cost can be found in the sample period before late 1997.
2. However, the long-run equilibrium relationship can no longer be detected in the sample period expanded beyond late 1997, when financial anxieties over the Japanese financial system emerged.
T
seems to be related to the financial anxiety which rapidly increased after the sudden collapse of big financial institutions in 1997 and 1998. The financial anxieties drastically increased the
precautionary demand by both firms and households.
We need to comprise a n
autumn 1997. The new variable has to capture the psychological change of peo
nancial an iet es. We used the Corporate Financial Position Diffusion Index issued quarterly by fi
Bank of Japan known as
First we identified the order of integration maintained by each of the variables using
both DF-GLS test and KPSS test. All variables except for financial anxieties DV1 defined later were shown to be nonstationary and their first difference to be stationary. Test results will be shown upon request.
We used an EGARCH model in which a change of corporate financial position ('DI ) is regressed by a change of bank lending rate ('rate)8. )h2(t is the financial anxieties which can be
i
captured as the condit onal variance ofH(t). The estimation result we got is as follows.
), ( ) 1 ( 0236 . 0 ) ( 0037 . 0 0446 . 0
2.26) ( )
37 . 0 ( ) 18 . 0
(
)
'DI(t 'ratet 'ratet H t
) 59 . 1 ( )
08 . 1 ( )
26 . 4 ( ) 21 . 1 (
), 1 (
) 1 168 ( . ) 0 1 (
) 1 2249 ( . 0 )) 1 ( log(
7746 . 0 3565 . 0 )) (
log(h2 t 2
ht
t t
h t t
h H H
The
see ions
and pid
decline ow
agnitude the loans held by depository institutions).
lready s.
Prim nister f
inst l
blic funds to elp affected banks. People’s anxieties tremendously increased, as indicated in the rise of DV in 1998.
where values in the parentheses are t-values.
financial anxieties (h2) is given in Figure 14. Anxieties variable denoted by DVt (=ht21) is n to rise at first from 1992 to 1994 (the first financial anxiety in Japan), when small credit un
cooperatives failed because of an increase in the nonperforming loans caused by the ra of stock and land prices after the bust of the bubble. The Japanese economy began to sh the signs of a modest recovery in late 1995, when real GDP began to increase and the official estimation of NPLs decreased. The Ministry of Finance had issued a report entitled “Reorganizing the Japanese Financial system (kinyu shisutemu no kinoukaifuku nituite)” in June 1995, in which they showed a diehard attitude to tackle the NPLs problems by officially disclosing the m
bad loans totalled 40 trillion yen (about 4 percent of of
Furthermore the MOF strongly pledged the complete deposit guarantee by March 2001, with a reform of the Deposit Insurance Corporation and Prompt Corrective Act, which had been a implemented with a success in the United States in 1991 after the financial crisis in the end of 1980 As a result the financial anxieties had been dispelled in 1995.
However, as we already discussed, the economy sharply declined in 1997 when e Mi Ryutaro Hashimoto had decided the rise of the consumption tax from 3 to 5 percent and the end o temporary income tax cut. Major Japanese financial itutions failed. Rumours about financia panic spread out through Japan when government took a very negative view to using pu
h
8 Kimura and Fujita (1999) used the following TARCH model.
, I h
h
), t ( ) t ( rate c ) t ( rate c c ) t ( DI
t t t t
t 1
2 1 2
1 2
1 1 0 2
2 1
0 1
JH E H D D
H
where It1 = 1 if Ht1< 0
= 0 otherwise.
In this model, for TARCH effect, the asymmetry termJ > 0 and the condition for non-negativity will be D0t 0, D1t 0, E t 0 and D1J t0. The conditional varianceht2 is subject to an impact D1 from good news (Ht1 t 0), while an impact (D1J ) from bad news (Ht1< 0). However their result cannot be explained rationally from an economic point of view. For example financial anxieties increases in the bubble period in the latter half of 1980s. Furthermore, the estimated E takes a negative value. Therefore, in our case, we introduce the growth rate model of regressed by
and consider the logarithm of in the EGARCH model.
'DI 'rate h2(t)
Then DV rapidly decreased after 1999. The decline can be understood as follows. The Bank of Japan had adopted an aggressive monetary easing policy to reduce the inter-bank money rate to a low level in February 1999. Thanks to this so-called zero interest policy, the uncollateralized overnight call rate was lowered to 0.01 percent and further declined to 0.001 percent when the BOJ introduced the so-called quantitative easy policy in March 2001. The Japanese government also decided to inject public funds to the banking sector; the amounts were 1.8 trillion yen in 1998, and oth efforts of the BOJ and the government succeeded 7.8 trillion yen in 1999 as already reviewed. B
in dispelling the financial anxiety. Thus, DV rapidly decreased after 1999.
We shall newly define the adjusted money stock as follows, by lettingDV t1( ){h t2( 1). rmadj( )t = rm t( )k DV t* 1( )
The above system in Eqs. (1) to (4) can be rewritten as follows, by replacing the variable rm (t) with a new rmadj (t).
( ) 1( ) ( 1) k i ( ( ) 1( ))
rm t c k DV t D ect t c rm t i kDV t i
' 0 '
¦
'1
1 1
( ) ( ) ( ) (5)
m m m
i
k k
i i
m m m
i i
d y t i e r t i H t
¦
'¦
'1
p 1
1 1
1
1
( ) 0 ( 1) ( ( ) 1( )) ( )
( ) (t) (6)
i i
y y
i i
p i y i
y t cy yect t c rm t i k DV t i d y t i
e r t i y
D
H
' ' ' '
'
¦ ¦
¦
1 1
( )
p p
i i
r t
'
p
r r
cr Drect t
¦
c 'rm t i 'k DV t i¦
d y t i'1 1
1
1
( ) ( ), (7)
i i
p i
r i
e r t i Hr t
¦
'where ect (t) is concerned with variables (rm (t)
( 1) ( ( ) 1( )) ( )
0
– kDV1 (t)), y (t) and r (t).
Every parameter including k in Eqs. (5) to (7) should be estimated with the criterion:
parameters unknown
t.
r.
w.
)}, ( ) ( ) ( { .
min 2 2 2
1
t t
t y r
m T t
H H
H
¦
The estimation procedure is shown in Appendix. Our results of cointegration estimation are as mand caused by financial stock, n in the sample beyond 1998. The cointegration results are
Rea money (rm(t)) and adjusted money stock (rmadj(t)) are shown in Figure 15, where the estimated period is [1980q1-2003q2] and adjusted money is estimated by rm(t)-0.0141*DV. The difference between two money stocks indicates the precautionary demand caused by financial anxiety. The big differences shown in around 1993 and 1998 suggest that both firms and household rapidly increased their money holdings facing the financial crisis. It means that there was rather shortage of money stock, though the BOJ insisted they provided enough money to the private sector by a low interest policy. The increase of precautionary demand for money means the decline of
(8)
follows. Cointegration still holds when we delete the precautionary de anxiety from real money eve
exemplarily exhibited in Table 1. For comparison, the cointegration results without anxieties are also exhibited in Table 2.
l
Figure 15. Real Money and Adjusted Money
14.6 16.0
14.8 15.0 15.2 15.4 15.6 15.8
80 82 84 86 88 90 92 94 96 98 00 02 rm(t)=ln(real m2+CD)
adjusted money
=rm(t)-k*DV1(t)
y
o e interest rate after 1997. The elasticity of interest spread declines from -0.03 (1980Q1-1997Q1)
bond rate also deceases. It fluctuates e elasticity is still small, when we compare with the elasticity in the United States. For example, Laidler (1985)9 shows that the elasticity of demand for money M2, with respect to the short rate of interest, varied between roughly -0.12 and -0.15 and, with respect to the long rate of interest rate, between-0.2 and -0.6. Money demand was not so sensitive to the interest rate even under the lowest interest rate at the early 2000s10.
(k=0.0141)
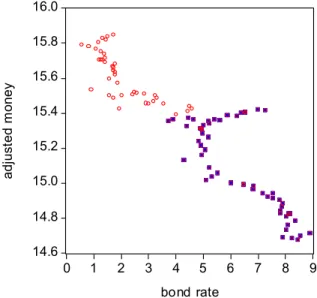
active money which has positive effects on the economy. The results shown here are in the case of interest spread as opportunity cost. Although the results of bond rate are not shown, they are almost same as of the interest spread. The adjusted money in the case of bond rate is estimated by rm (t)- 0.0081*DV.
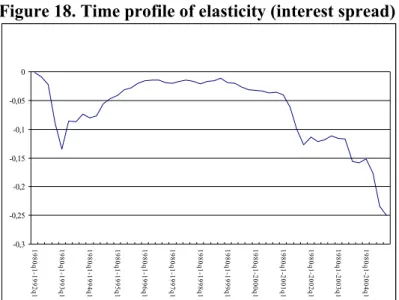
The scatter diagram of interest rate and adjusted mone are shown in Figures 16 and 17. The diagram was discriminated before and after 1995. The estimated coefficients of the cointegration vectors given in Table 1 show the elasticity of interest rate and income. The coefficients of each variable in the cointegration vector are significant. The coefficients of the interest rate (c2) are of negative sign. The coefficient is the equilibrium interest elasticity of the demand for money. Figures 18 and 19 show the time profile of the interest rate elasticity. The results show that the elasticity of interest rate gradually decreases (increase in absolute value) after the period around 1997 when financial anxieties rapidly increased. This will mean that money demand became more sensitive t th
to -0.05 (1980Q1-2004Q1) in Figure 18. The elasticity of around -0.1 in Figure 19. However th
9 See D. Laidler (1985) p.130
The elasticity is semi-elasticity of interest rate in a strict meaning. We need to recalculate it to
10
compare with Laidler’s elasticity. Semi-elasticity can be defined by KD/r=KE, where KD, r, and KE are elasticity, interest rate, and semi-elasticity, respectively. So the elasticity of interest spread varied between -0.045 and -0.075 assuming the average spread of interest rate of 1.5% , while that of bond rate varied around -0.4 assuming the average bond rate of 4%.
Figure 16. Scatter Diagram (adjusted money and interest spread)
1 4 .6 1 4 .8 1 5 .0 1 5 .2 1 5 .4 1 5 .6 1 5 .8 1 6 .0
-4 -3 -2 -1 0 1 2 3
s p re a d
adjusted money
(1980q1-1994q4) denoted by square and (1995q1-2004q3) denoted by circle
Figure 17. Scatter Diagram (adjusted money and interest spread)
14.6 14.8 15.0 15.2 15.4 15.6 1 16.0
5.8
0 1 2 3 4 5 6 7 8 9
bond rate
adjusted money
(1980q1-1994q4) denoted by square and (1995q1-2004q3) denoted by circle
Figure 18. Time profile of elasticity (interest spread)
-0,3 -0,25 -0,2 -0,15 -0,1 -0,05 0
1980q1-1992q1 1980q1-1993q1 1980q1-1994q1 1980q1-1995q1 1980q1-1996q1 1980q1-1997q1 1980q1-1998q1 1980q1-1999q1 1980q1-2000q1 1980q1-2001q1 1980q1-2002q1 1980q1-2003q1 1980q1-2004q1
Figure 19. Time profile of elasticity (bond rate)
0,04
-0,12 -0,1 -0,08 -0,06 -0,04 -0,02 0 0,02
1980q1-1994q1 1980q1-1995q1 1980q1-1996q1 1980q1-1997q1 1980q1-1998q1 1980q1-1999q1 1980q1-2000q1 1980q1-2001q1 1980q1-2002q1 1980q1-2003q1 1980q1-2004q1
The less sensitivity of money demand to interest rate before 1997 can be attributed to the
deregulation of the Japanese financial system. Financial instruments that comprise M2+CD came to provide the attractive interest rates by the deregulation started in the early 1980s, though its
development was gradual. For example, some time deposits provide even much higher interest rate than government 10 years bond rate in the early 1990s. As a result the spread between short-term interest rate and the long-term interest rate became negative. However with the rapid decline of interest rate by BOJ’s radical easy policy, zero interest rate policy, people’s money holdings
ecame a little elastic to the interest rate. However the elasticity is far from a liquidity trap.
b
Table 1 Cointegration Test with adjusted money
cointegration madj=c0+c1*y+c2*r
k P(trace) P(max-eigenvalue) c1 c2
1980q1-1999q2 0,0143 n=0: p=0.0002* n=0: p=0.0025* 1,569 -0,02
n=1: p=0.0217* n=1: p=0.0584**
1980q1-2000q2 0,0144 n=0: p=0.0024* n=0: p=0.0144* 1,629 -0,0332
n=1: p=0.0555** n=1: p=0.1045
1980q1-2001q2 0,0157 n=0: p=0.0098* n=0: p=0.045* 1,671 -0,0608
n=1: p=0.0809** n=1: p=0.1524
1980q1-2002q2 0,0143 n=0: p=0.0719** n=0: p=0.0703** 1,701 -0,1211
n=1: p=0.429 n=1: p=0.5798
1980q1-2003q2 0,0141 n=0: p=0.0341* n=0: p=0.0275* 1,694 -0,1169
n=1: p=0.4369 n=1: p=0.5185
** (*) denotes rejection of hypotheses at 5% (10%) significance.
P (trace) is p-value for trace detection of cointegration. P (max-eigenvalue) is p-value for max-eigenvalue etection. Delay order of cointegration is fixed to be ''3'' At n=''1'' or ''2'', cointegration test results are almost
milar as n=''3'' and coefficients c1 and c2 have similar tendency.
d si
Table 2 Cointegration Test with real money
㩷 㩷 cointegration 㩷 r(m2cd)=c0+c1*y+c2*r
㩷 㩷 P(trace) P(max-eigenvalue) c1 c2
1980q1-1997q2 n=0: p=0.0242* n=0: p=0.0753** 1.586 -0.0274
㩷 㩷 n=1: p=0.1295 n=1: p=0.533 㩷 㩷
1980q1-1998q2 n=0: p=0.0178* n=0: p=0.066** 1.581 -0.024
㩷 㩷 n=1: p=0.1056 n=1: p=0.292 㩷 㩷
1980q1-1999 8q2 n=0: p=0.0 72** n=0: p=0.254 1.588 -0.0363
㩷 㩷 n=1: p=0.1519 n=1: p=0.303 㩷 㩷
1980q1-2000q2 n=0: p=0.1338 n=0: p=0.3643 1.538 -0.083
㩷 㩷 n=1: p=0.1 55 6 n=1: p=0.3729 㩷 㩷
1980q1-2001q2 n=0: p=0.1709 n=0: p=0.2459 1.466 -0.1413
㩷 㩷 n=1: p=0.3 73 5 n=1: p=0.4 8 46 㩷 㩷
1980q1-2002q2 n=0: p=0.2238 n=0: p=0.2301 1.347 -0.233
㩷 㩷 n 1= : p=0.5137 n=1: p=0.4 4 44 㩷 㩷
1980q1-2003 2q2 n=0: p=0.1 55 n=0: p=0.1 2 13 1.458 -0.14 23
㩷 㩷 n=1: p=0.5051 n=1: p=0.4 6 71 㩷 㩷
Conclusion
Now we conclude with reflections on the role of the BOJ in the process of Japan’s prolonged ecession. We chronologically reviewed Japan’s economy bef
r ore and after the bubble. We also
erformed the cointegration analysis to identify whether or not the Japanese economy was in a quidity trap. The results indicate that the interest rate elasticity of money demand is not so large,
oug te. The results suggest that the BOJ
h a nder the strong pressure of U.S and
Japanese government. They strongly and repeatedly demanded easy monetary policy to boost the mestic demand especially after the Louvre agreement in 19 nestly accepted
U.S’ di tion with opposition e tedly persuaded the people how
ternati is sed the m stock b 3 percent
r year. T BOJ had ho is to k the money stock at the stable
apane ri ion in 1974. The BOJ rapidly increased
ney stoc o combat against the adver d by th irst oil sh ck. High growth rate of
heavy year. The B o lear esson
hen the 79. Th ric as v le, though
recess OJ y grow at
Howeve nfortuna ane BOJ got the son and increased
lowing irec ent. One reason why the BOJ kept
reasing ney stoc cra in 19 . Anoth reason is that price level
The h ed y e inflation re. Besides the trade
eralizati of agricu , su d bee d contr ted to the decline of
ice11. A po the old Bank of Japan Law. The old Law
ing the BOJ dent o he ent. The BOJ should
have more strongly insisted that the current
originally caused by the structural imbalance between domestic savings and investment in the U.S economy. It should have been more independent of the government and should not have forgotten the lesson from the first oil shock.
o ld have realized the threat of deflation. The BOJ had been reluctant to ease the
d
ey p
li
th h it gradually decreased with the decline of the interest ra strong responsibility for monetary policy. The BOJ was u as
do 87. The government ho
the rec out any . The government r pea
important the in onal cooperation . The BOJ increa oney eyond 1
pe he got a lesson on w important it eep
level when the J se economy expe enced high inflat
mo k t se effect cause e f o
money caused a
behaved wel w inflation, beyond
ck30 percent per OJ wh
e leve ned the l ery stab l
g
second oil sho ion, since the B
occurred in 19 kept the mone
e p th
l w
w th very sli hti a moderate level.
r u tely for the Jap se economy the for les money stock fol honestly the d tion of governm
inc mo k is the market sh of New York 87 er
had been stable. ighly appreciat en had eased th pressu
lib on ltural products ch as orange an f ha ibu
consumption pr ablished r
nother more im rtant reason is est du War made the heavily depen
account imbalance between Japan and U.S was n t governm
The BOJ sh u
money because of the fear of recurrence of the bubble economy. At the early stage of the recession, the BOJ thought that some downward pressure on prices was what has been referred to as “good deflation,” resulting from the technical change and the increase of cheap products from China an deregulation in Japan’s rigid service sector12. It was often said at the time that Tokyo was the most expensive city. One more reason is that the BOJ thought that monetary conditions were already extremely loose, which might hamper the effort of both firms and banks to adjust their damaged balance sheet. Much lower interest policy was thought to incur a moral hazard. However such BOJ’s stance provided very negative effects on the financial institutions and stock prices. The event reminds us of the liquiditionists’ policy in the early stage of Great Depression, which contributed to deepen the recession.
Both the government and BOJ were reluctant to disclose the nonperforming loan statistics. Th had still believed the “myth of ever-rising land price” in the sense that the land price and the
11 Japan opened up these agricultural products in 1988, in response to U.S strong demand.
12 Japan had many administrative regulations. For example, it was very difficult to open new large tore. A department store and large supermarket were strongly regulated by the Large-scale Retail Store Law.
s
economy would recover so soon. They thought the problems would be rapidly solved once the anticipated recovery occurred. They took the forbearance policy. They published NPLs of on then 21 major banks in 1992, and published the statistics for each of the banks in 1993. The regional banks only started to disclose in 1994. The statistics were widely admitted as underestimated by flexible definition of nonperforming loans. Such “buying time policy” made the NPL problems worse. The Finnish economy which also underwent an extremely severe recession in early 1990s, rapidly recovered because of the injection of public funds immediately after the financial crisis
ly the the
f the
. ad strongly opposed.
ed
52:5-59.
Elliott, G., T. J. Rothenberg and J. H. Stock, 1996, “Efficient Tests for an Autoregressive Unit Root,”
13. I they had dissolved the nonperforming loan problems at the early stage as in the Finish case, credit crunch would not have occurred and money multiplier would not have declined substantially Public funds should have been injected to revitalize the financial system before the drastic decline in 1997, though opposition parties h
The radical contraction of money stock in 1990 tells us that monetary policy should not be us to change the asset prices. The central bank should not take the role of arbitrage of asset prices. We have to remember that it takes lots of time to revitalize the economy once it falls into a recession.
We have found that there still exists a cointegration between the money stock and the real economic activity even after the burst of the bubble, and a liquidity trap is not evident by cointegration test with the financial anxieties. As Milton Friedman said, both inflation and deflation are monetary phenomena in the long-run. The BOJ should pay a close attention to the behavior of money stock and can’t get rid of the responsibility for the recession.
References
Ahearne, A., J. Gagnon, J. Haltmair, and S. Kamin, 2002, “Preventing Deflation: Lessons from Japan’s Experience in the 1990s,” International Finance Discussion Papers, Board of Governors of Federal Reserve System No. 729.
Bank of Japan, 1997, “M2+CD to keizaikannkei ni tuite (On the relationship between M2+CD and economic activity in Japan),” Bank of Japan Monthly Review, 101-123 (in Japanese).
Bank of Japan, 2003, “The Role of the Money Stock in Conducting Monetary Policy,” Bank of Japan Research Papers, Policy Planning Office.
Bollerslev, Tim, Ray Y. Chou, and Kenneth F. Kroner, 1992, “ARCH modeling in Finance: A Review of the Theory and Empirical Evidence,” Journal of Econometrics
Cargil T., M. Hutchison, and I. Takatoshi, 2000, Financial Policy and Central Banking in Japan, The MIT Press, Cambridge and London.
Fisher I. 1933, “The Debt-Deflation theory of Great Depression,” Econometrica, 11, 337- 57.
Econometrica, 64, 813–836.
13 See P. Nyberg and V. Vihriala (1993).
Engle, R. F. and C. Granger, 1987, “Co–Integration and Error Correction: Representatio Estimation and Testing,” Econometrica, 55, 251
n, –276.
ng , Robert F. and Victor K. Ng, 1991, “Measuring and Testing the Impact of News on Volatility,” University of California, San Diego, Mimeo.
Fujiki, H., C. Hsioo, and Y. Shen, 2002, “Is There a Stable Money Demand Function under the Low Interest Policy? A Panel Data Analysis,” BOJ Monetary and Economic Studies.
Fujiki, H., and Watanabe, K., 2004, Japanese Demand for Narrow Monetary aggregate in the 90s:
00, Is the Japanese economy in a liquidity
g Paper e return of the liquidity trap, Brookings Papers on Economic Activity, No.2,137-205.
thesis of tionarity Against the Alternatives of a Unit Root: How Sure Are We That Economic ey; theories, Evidence, and Problems, third ed., Harper
McKin in, Engle, R. and C. Granger, (eds.),
McKinnon, R., Ohno, K., 1997, In Dollar and Yen: Resolving Economic Conflict between the
d Finland, mimeo.
justments in
Nakash
arket with a low interest rate policy, Kyoto Gakuen University
Nishim aku (The Reform of the Japanese Financial System),
E le
Time series versus cross-sectional Evidence from Japan, Monetary and Economic studies, 22, 47-77.
Hondroyiannis, G., P.A.V.B. Swamy, and G.S.Tavlas, 20 Trap?, Economics Letters 66.
Hamilton, J.D. 1994, Time Series Analysis, Princeton, NJ: Princeton University Press.
Hutchison, M. and K. McDill, 1999, “Empirical determinants of banking crisis: Japan’s experience in international perspective, in C. Freeman, ed., Why Did Japan Stumble? Causes and Cures, Edward England.
Kimura, T. and S. Fujita, 1999, “Kiyufuan to mane, jittaikeizai, bukka no kankeinituite (The relationship between financial anxieties, money, real economy, and prices)” Workin
99-6, Bank of Japan (in Japanese).
Krugman, P., It’s baaack:Japan’s slump and th Kwiatkow
Staski, D., P.C.B. Phillips, P. Schmidt and Y. Shin, 1992, "Testing the Null Hypo Time Series Have a Unit Root?" Journal of Econometrics, 54:159-178.
Laidler, David, 1985, The Demand for Mon
& Row.
non, J., 1991, “Critical Values for Cointegration Tests,”
Long–Run Economic Relationships: Readings in Cointegration, Oxford University Press, Oxford.
United States and Japan, MIT Press, Cambridge, MA.
Miyagawa, S., Y. Morita, and Y. Sawada, 2008, Financial Crisis and Money Demand ---in the case of Japan an
Miyao, R., 2006, Macro Monetary Policy and Time Series (in Japanese), Nikkei Press.
Mori, N. S. Shiratsuka. and H. Taguchi, 2001 “Policy Responses to the Post-Bubble Ad Japan: A Tentative Review,” BOJ Monetary Economic studies (Special Edition).
ima, K and M.Saito, 2004, Uncovering interest-elastic money demand: evidence from the Japanese money m
Economic Review, 14-2, 21-55.
ura, Y., 2003, Nippon no kinyu kaik