Experimental Results of International ESD test in Kyushu Institute of Technology
Hirokazu Masui, Kazuhiro Toyoda, Mengu Cho (KIT), Suresh Puthanveettil (ISRO) and Xu Yanlin (CAST)
Kyushu Institute of Technology
Sensui 1-1, Tobata, Kitakyushu, 804-8550, Japan India Space Research Organization and
China Academy of Space Technology
ABSTRACT : This paper describes the resul ts of international ESD tests conducted in Kyushu Institute of Technol ogy (KIT). The sol ar array coupons of ISRO (India Space Research Organi ation) and CAST (China Academy of Space Technol ogy) were tested in the test f acil ities of KIT. These test were conducted with the procedure proposed by KIT. In the test procedure, threshol d test, cel l degradation test and sustained arc test were incl uded. This paper expl ains experimental resul ts of international ESD test.
1. Introduction
The discharge occurring in solar array panel has been a serious problem plaguing the space photovoltaic community [1]. This discharge is termed ESD (electrostatic discharge) and causes the reduction of spacecraft power. Figure.1 shows the cross sectional view of solar cell.
When a spacecraft encounters a geomagnetic substorm (and the associated flow of high energy electrons), the coverglass attached to the solar cell assumes a higher potential than the spacecraft chassis due to the difference in the coefficients of secondary
electron emission between the two. An electric field is created at the triple junction, which is the boundary of conductor, dielectric and plasma. The triple junction exists at the edge of an interconnector and a cell. This charging situation is named as beam inverted gradient. In this charging situation, electrons are emitted from the triple junction. The electric field is enhanced by collisions of the emitted electrons with the side of the coverglass. At the same time, outgassing from the coverglass is accelerated.
ESD occurs when the electric field exceeds a threshold value and the electrons ionize the outgassed neutrals. This type discharge is called as a primary arc (PA). PA creates an arc spot and causes the cell degradation [2].
Of late, the power reduction by PA has been
found to be significant and its estimation has
been recommended for improving the solar
array design. When PA occurs between string
gaps, a secondary arc or sustained arc (SA) is
induced. The arc plasma of PA can
electrically connect solar cell strings. The
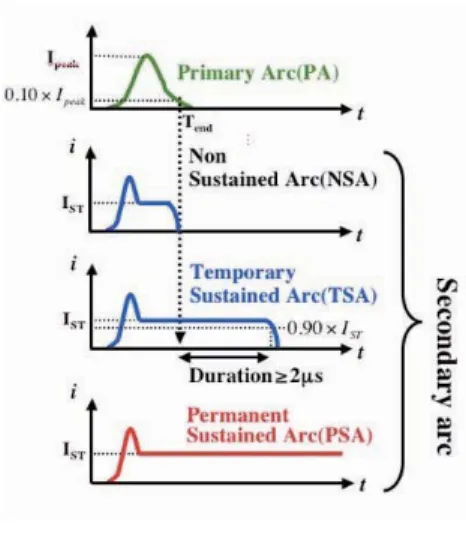
Fig. 1 Cross section view of solar cell stringcurrent generated by solar cells flows into the plasma. The arc plasma is heated and causes the thermal damage to the insulator layer of a polyimide sheet. Secondary arc causes permanent power loss. The definition of SA is shown in Fig. 2. The category of SA is defined from the comparison with the end of PA pulse width. The end of PA is defined as the time at which the waveform falls to less than 10% of the maximum current peak (Ipeak). For temporal difference between the end of SA and that of PA shorter than 2 s, SA is termed as non sustained arc (NSA).
When the duration of SA is longer by 2 s than the duration of PA, SA is categorized as temporary sustained arc (TSA). If the duration of TSA is sufficiently long, the underlying polyimide sheet loses insulation resistance and TSA shifts to PSA. This stage is a complete short circuit and the power generated by the solar array is not supplied to satellite loads. In the worst case, the satellite loses a function or stops working altogether.[3][4].
Recently, these ESD accidents have been recognized as problems to be avoided by taking precautionary measures. A ground test for ESD is therefore, of prime importance before a satellite launch. Japan, France and US independently established standards for ESD ground test [5][6][7]. From the viewpoint of an international space development, these standards are being integrated into ISO standard [8]. However, it is difficult to carry out the ESD test because it needs the facilities such as, high vacuum chamber, electron beam gun and plasma source etc. Kyushu Institute of Technology (KIT) is offering the ESD test in KIT for other research institutes because KIT has specialized facilities for the ESD test and has know-how through a lot of charging and arcing experiments for Japanese satellites so
far. We accepted requests made by ISRO (India Space Research Organization) and CAST (China Academy Space Technology) and conducted ESD tests for their solar array panels. This paper describes experimental results of ISRO and CAST in KIT. These tests were conducted with test circuits and procedures which are suggested by KIT in the establishment of the ISO standard. In
addition to experimental results, we explain the detail of test procedures.
2. Test procedures and circuits
ESD tests in this paper consist of three parts.
For all tests, an electron beam environment, simulating geosynchronous earth orbit (GEO), was assumed.
1) Threshold test
Fig. 2 Definition of SA
Fig. 3 Test procedure of threshold
Figure 3 and 4 show the procedure of threshold test and test circuit, respectively.
The surface potential is measured by a noncontact potential probe. The surface potential value immediately before PA is used as the threshold. The obtained threshold is used in the estimation of the total discharge number by MUSCAT simulation [9][10].
2) Cell degradation test
Cell degradation test evaluates the resistance of solar cell for PA. Figure 4 and 5 show the procedure of cell degradation test and circuit,
respectively. PA in this test is the flashover current in which a total amount of charge stored on all the coverglasses in the actual solar array of larger size is released. Lext and Rext in Fig. 5 control the waveform to match with the expected flashover current. Cell degradation is checked by a measurement of dark VI. A total discharge number is approximately 100.
3) Sustained arc test
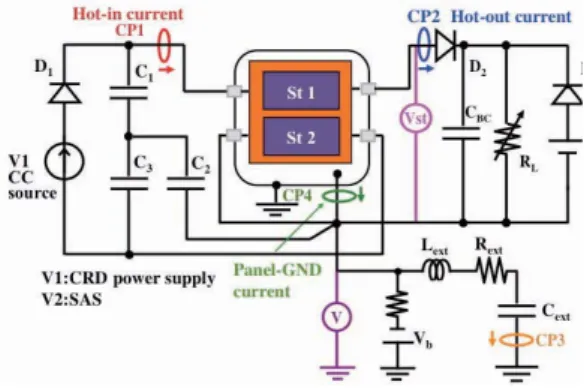
Sustained arc test verifies occurrences of TSA and PSA. The circuit of sustained arc test is shown in Fig. 7. The top-side circuit and power supplies simulate the power generation of satellite. We developed the power supply using current regulated diodes (CRD) because V1 of constant current power source needs to have rapid response and low internal capacitance. The condition of string voltage (Vst) and string current (Ist) adopted is nominal. After the nominal condition, Vst and Ist are increased.
3. Experimental results 3.1 ISRO results
The threshold test and sustained arc test were conducted for ISRO coupons. Figure 8 shows tested coupons. 2 types solar cell, Triple junction cell (TJ) A and TJ B, are used. Three coupons, TJ A, TJ B and TJ with RTV, were tested. In two coupons, string gap was exposed.
Fig. 5 Test procedure of cell degradation Fig. 4 Test circuit of threshold
Fig. 6 Test circuit of cell degradation
Fig. 7 Test circuit of sustained arc
Gaps of TJ with RTV were filled with room temperature Vulcanizer Adhesive. Thickness of coverglass is 100 m for all cases. Gap lengths were 0.8, 2.0 and 4.0 mm in TJ A. Gap lengths of TJ B were 3.0 and 5.0 mm.
Threshold tests were conducted for TJ A and TJ with RTV. Electron beam energy and current were 8 – 9 keV and 100 μA, respectively.
Figure 8 shows the differential potential distributions of TJ A and TJ with RTV immediately before PA. Threshold values were 1.7 kV and 3.0 kV, respectively.
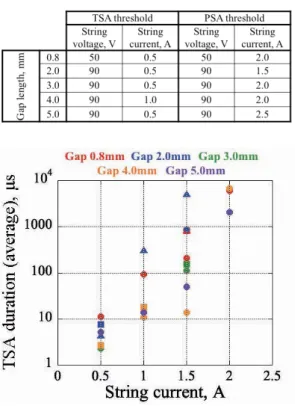
Table 1 shows threshold values of SA for TJ A and TJ B. Cext = 5 nF was used. TSA
occurred for a long gap length over 2.0 mm and occurrence of TSA depends on the string voltage. TSA threshold can be defined as Vst
= 50 V for 0.5 mm and Vst = 90V for over 2.0 mm. As a result, increasing of a gap length is not an easy option to prevent the occurrence of SA. Occurrence of PSA strongly depends on Ist rather than Vst. PSA can occur for over Ist = 1.5 A. Figure 9 shows TSA durations of TJ A (0.5, 2.0 and 4.0 mm) and TJ B (3.0 and 5.0 mm). TSA duration increased rapidly with increasing of Ist. For gap length 4.0 and 5.0 mm, increasing of TSA duration below Ist = 1.5 A was slower than other short gap length.
However, the TSA duration in Ist = 2.0 A was the same as that of gap length 0.8 mm.
These results show that the extension of gap length is not an effective method to prevent from TSA and PSA in the solar array panel exposed gaps.
Table 2 shows a threshold value of TJ with RTV. The threshold value increased compared with TJ A and TJ B. We confirmed that occurrence of SA was not observed in a nominal condition. However, PSA occurred for the high string voltage as Vst = 200 V.
PSA image is shown in Fig. 10. The position of PSA was in a gap between strings. PSA can occur when a part of gap was not covered.
Table 1 Threshold value of SA for TJ A and TJ with RTV
Fig. 9 TSA duration of TJ A and TJ B Table 2 Threshold value of SA for TJ with RTV
Fig. 10 PSA image of TJ with RTV
3.2 CAST results
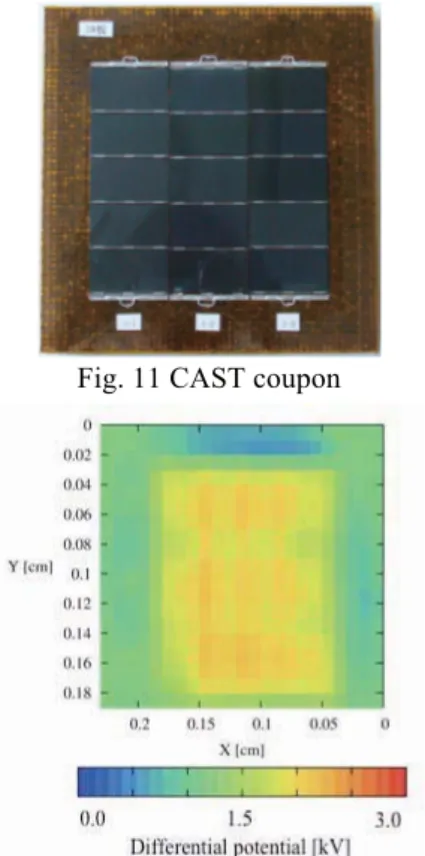
For CAST coupons, the threshold test, cell degradation test and sustained arc test was conducted. Figure 9 shows the test coupon of CAST. This coupon has 3 strings and 5 silicon solar cells are connected with the series. One coupon was used for the threshold test and cell degradation test and two coupons were used for the sustained arc test. Gap length is 0.8 mm and gaps were not filled with RVT.
Figure 11 shows a differential potential distribution before PA. Electron beam condition, energy and current, were 5 keV and 50 A. The distribution was uniform and the value on the surface of coverglass was 1.7 kV. However, the potential of arc position was low because arcs occurred at bus bars. As a result, the threshold value was estimated as about 1 kV.
A flashover current was calculated from the
result of the threshold test. In this calculation, we assumed that the solar array panel of 4 m in length and 2 m in width. For characteristics of the waveform, the pulse width is 360 s and the peak current is 12 A.
A total amount of charge is 2.4 mC. We chose Cext, Lext and Rext to match calculation waveform with experimental one in particular the pulse width and peak current.
A typical experimental waveform is shown in Fig. 13. Cell degradation test was conducted by using this waveform. For a total discharge
Fig. 11 CAST coupon
Fig. 12 Differential potential distribution
Fig. 13 Typical waveform for cell degradation test in nominal condition
Fig. 14 Typical waveform for cell degradation test in severe condition
Fig. 15 VI characteristic before and after test
number of 100 PAs, cell degradation was not observed in all strings. We additionally performed a severe condition test to verify the resistance of solar cell. Figure 14 shows a waveform in the severe condition. We did not use Rext and Lext for increasing of peak current. Cext was 100 nF. A peak current reached about 50 A. A VI characteristic shown in Fig. 15 did not change for 20 arcs.
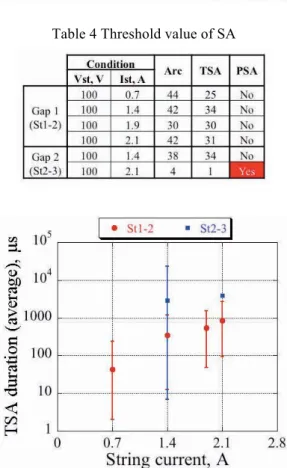
Sustained arc test was performed in two steps. In the first step, occurrence of SA was verified for a flashover current. TSA duration was measured in the second step. Table 3 shows the threshold value of SA for flashover current. Parameter of Cext and Rext and Lext is also shown. For Vst = 100 V and Ist = 0.7 A, TSA not was observed though NSA was observed. TSA was not observed for Vst = 50V and Ist = 1.4 A, however, PSA occurred for Vst = 50 V and Ist = 2.1 A. Table 4 shows the threshold value of SA under Cext = 5nF. Vst was fixed at 100 V, and Ist was only increased. This test was performed for 2 gaps, St 1-2 and St 2-3. For gap St 1-2, PSA did not occur for Ist
= 2.1 A. PSA occurred for Ist = 2.1 A in gap St 2-3. We considered that microscopic condition of gap St 1-2 affected occurrence of PSA. However, in observation of microscope pictures, a remarkable difference was not identified. TSA duration of Table 4 is shown in Fig. 16. TSA duration of St 2-3 in Ist = 2.1 A reaches about 1 ms. From the viewpoint of a safety design, the condition of Ist = 2.1 A is regarded as dangerous though PSA did not occur.
4. Conclusions
KIT conducted international ESD ground tests as a part of ISO standardization campaign. The coupons of ISRO and CAST were tested in KIT facilities. We obtained results as follows,
1) ISRO results
Threshold values of PA inception were 1.7 kV for TJ A and 3.0 kV for TJ with RTV.
For SA thresholds, TSA occurred in Vst
=50V, Ist = 0.5 A for normal TJ, and PSA occurred in Vst = 50 V, Ist = 2.0 A.
Acknowledgment
We thank ISRO and CAST for giving the opportunity of these international ESD tests.
Also, the first author personally expresses his pleasure in meeting with Suresh
Puthanveettil and Xu Yanlin.
Table 3 Threshold value of SA
Table 4 Threshold value of SA
Fig. 16 TSA duration of gap St 1-2 and St 2-3
References
[1]Frost & Sullivan Corporation.: Commercial Communications Satellite Bus Reliability Analy- sis, August 2004, 2004.
[2] T, Okumura., H, Masui., K, Toyoda., M, Imaizumi., M, Cho.: Degradation of electric performance due to electrostatic discharge on silicon solar cell for space, J. Japan Soc. Aero.
Space Sci., Vol.55, No.647, pp.590-596, 2007.
[3]I, Katz., V.A.Davis., D.B.Snyder.: Mechanism for Spacecraft Charging Initiated Destruction of Solar Arrays in GEO, AIAA Paper 98-1002, 36th Aerospace Sci. Meeting, 1998.
[4]Hosoda, S., Kim, J., Cho, M., Toyoda, K., Kawakita, S., Kusawake, M., Takahashi., M. and Maejima, H.: Ground Investigation of Sustained Arc Phenomena in Power Cables on ADEOS- Satellite, Journal of the Japan Society for Aeronautical and Space Sciences, Vol. 54, pp.427-433, 2006.
[5] Low Earth Orbit Spacecraft Charging Design Guidelines, Ferguson,
D.C., and Hillard, G.B., NASA/TP-2003-212287.
[6] ECSS-E20-06, Space Engineering – Spacecraft Charging.
[7] WG1-18-1-3, Design standard relative to charging and arcing.
[8] "Space Systems – Space Solar Panels – Spacecraft Charging Induced Electrostatic Discharge Test Methods", ISO/CD 11221, ISO TC20/SC14/WG1, 2008
[9] Muranaka, T., Hosoda, S., Kim, J., Hatta, S., Ikeda, K., Hamanaga, T., Cho, M., Usui, H., Ueda, H., Koga, K. and Goka, T.: Development of Multi-Utility Spacecraft Charging Analysis Tools (MUSCAT), Journal of IEEE Transaction on Plasma Science, Vol. 36, pp. 2336-2349, 2009.
[10] Hosoda, S., Muranaka, T., Kuninaka, H., Kim, J., Hatta, S., Kurahara, N., Cho, M., Ueda, H., Koga, K. and Goka, T.: Laboratory Experiments for Code Validation of Multi-Utility Spacecraft Charging Analysis Tool (MUSCAT), Journal of IEEE Transaction on Plasma Science, Vol. 36, pp.
2350-2359, 2009.